Immigrants from Czechoslovakia Disability Age Under 5

COMPARE

Immigrants from Czechoslovakia
Race
Ancestry
AfghanAfricanAlaska NativeAlaskan AthabascanAlbanianAleutAlsatianAmericanApacheArabArapahoArgentineanArmenianAssyrian/Chaldean/SyriacAustralianAustrianBahamianBangladeshiBarbadianBasqueBelgianBelizeanBermudanBhutaneseBlackfeetBolivianBrazilianBritishBritish West IndianBulgarianBurmeseCajunCambodianCanadianCape VerdeanCarpatho RusynCelticCentral AmericanCentral American IndianCherokeeCheyenneChickasawChileanChineseChippewaChoctawColombianColvilleComancheCosta RicanCreeCreekCroatianCrowCubanCypriotCzechCzechoslovakianDanishDelawareDominicanDutchDutch West IndianEastern EuropeanEcuadorianEgyptianEnglishEstonianEthiopianEuropeanFijianFilipinoFinnishFrenchFrench American IndianFrench CanadianGermanGerman RussianGhanaianGreekGuamanian/ChamorroGuatemalanGuyaneseHaitianHmongHonduranHopiHoumaHungarianIcelanderIndian (Asian)IndonesianInupiatIranianIraqiIrishIroquoisIsraeliItalianJamaicanJapaneseJordanianKenyanKiowaKoreanLaotianLatvianLebaneseLiberianLithuanianLumbeeLuxembourgerMacedonianMalaysianMalteseMarshalleseMenomineeMexicanMexican American IndianMongolianMoroccanNative HawaiianNavajoNepaleseNew ZealanderNicaraguanNigerianNorthern EuropeanNorwegianOkinawanOsageOttawaPaiutePakistaniPalestinianPanamanianParaguayanPennsylvania GermanPeruvianPimaPolishPortuguesePotawatomiPuebloPuerto RicanPuget Sound SalishRomanianRussianSalvadoranSamoanScandinavianScotch-IrishScottishSeminoleSenegaleseSerbianShoshoneSierra LeoneanSiouxSlavicSlovakSloveneSomaliSouth AfricanSouth AmericanSouth American IndianSoviet UnionSpaniardSpanishSpanish AmericanSpanish American IndianSri LankanSubsaharan AfricanSudaneseSwedishSwissSyrianTaiwaneseThaiTlingit-HaidaTohono O'OdhamTonganTrinidadian and TobagonianTsimshianTurkishU.S. Virgin IslanderUgandanUkrainianUruguayanUteVenezuelanVietnameseWelshWest IndianYakamaYaquiYugoslavianYumanYup'ikZimbabwean
Immigration
NonimmigrantsImmigrantsAfghanistanAfricaAlbaniaArgentinaArmeniaAsiaAustraliaAustriaBahamasBangladeshBarbadosBelarusBelgiumBelizeBoliviaBosnia and HerzegovinaBrazilBulgariaBurma/MyanmarCabo VerdeCambodiaCameroonCanadaCaribbeanCentral AmericaChileChinaColombiaCongoCosta RicaCroatiaCubaCzechoslovakiaDenmarkDominicaDominican RepublicEastern AfricaEastern AsiaEastern EuropeEcuadorEgyptEl SalvadorEnglandEritreaEthiopiaEuropeFijiFranceGermanyGhanaGreeceGrenadaGuatemalaGuyanaHaitiHondurasHong KongHungaryIndiaIndonesiaIranIraqIrelandIsraelItalyJamaicaJapanJordanKazakhstanKenyaKoreaKuwaitLaosLatin AmericaLatviaLebanonLiberiaLithuaniaMalaysiaMexicoMicronesiaMiddle AfricaMoldovaMoroccoNepalNetherlandsNicaraguaNigeriaNorth AmericaNorth MacedoniaNorthern AfricaNorthern EuropeNorwayOceaniaPakistanPanamaPeruPhilippinesPolandPortugalRomaniaRussiaSaudi ArabiaScotlandSenegalSerbiaSierra LeoneSingaporeSomaliaSouth AfricaSouth AmericaSouth Central AsiaSouth Eastern AsiaSouthern EuropeSpainSri LankaSt. Vincent and the GrenadinesSudanSwedenSwitzerlandSyriaTaiwanThailandTrinidad and TobagoTurkeyUgandaUkraineUruguayUzbekistanVenezuelaVietnamWest IndiesWestern AfricaWestern AsiaWestern EuropeYemenZaireZimbabweAzores
Select to Compare
Race
Ancestry
AfghanAfricanAlaska NativeAlaskan AthabascanAlbanianAleutAlsatianAmericanApacheArabArapahoArgentineanArmenianAssyrian/Chaldean/SyriacAustralianAustrianBahamianBangladeshiBarbadianBasqueBelgianBelizeanBermudanBhutaneseBlackfeetBolivianBrazilianBritishBritish West IndianBulgarianBurmeseCajunCambodianCanadianCape VerdeanCarpatho RusynCelticCentral AmericanCentral American IndianCherokeeCheyenneChickasawChileanChineseChippewaChoctawColombianColvilleComancheCosta RicanCreeCreekCroatianCrowCubanCypriotCzechCzechoslovakianDanishDelawareDominicanDutchDutch West IndianEastern EuropeanEcuadorianEgyptianEnglishEstonianEthiopianEuropeanFijianFilipinoFinnishFrenchFrench American IndianFrench CanadianGermanGerman RussianGhanaianGreekGuamanian/ChamorroGuatemalanGuyaneseHaitianHmongHonduranHopiHoumaHungarianIcelanderIndian (Asian)IndonesianInupiatIranianIraqiIrishIroquoisIsraeliItalianJamaicanJapaneseJordanianKenyanKiowaKoreanLaotianLatvianLebaneseLiberianLithuanianLumbeeLuxembourgerMacedonianMalaysianMalteseMarshalleseMenomineeMexicanMexican American IndianMongolianMoroccanNative HawaiianNavajoNepaleseNew ZealanderNicaraguanNigerianNorthern EuropeanNorwegianOkinawanOsageOttawaPaiutePakistaniPalestinianPanamanianParaguayanPennsylvania GermanPeruvianPimaPolishPortuguesePotawatomiPuebloPuerto RicanPuget Sound SalishRomanianRussianSalvadoranSamoanScandinavianScotch-IrishScottishSeminoleSenegaleseSerbianShoshoneSierra LeoneanSiouxSlavicSlovakSloveneSomaliSouth AfricanSouth AmericanSouth American IndianSoviet UnionSpaniardSpanishSpanish AmericanSpanish American IndianSri LankanSubsaharan AfricanSudaneseSwedishSwissSyrianTaiwaneseThaiTlingit-HaidaTohono O'OdhamTonganTrinidadian and TobagonianTsimshianTurkishU.S. Virgin IslanderUgandanUkrainianUruguayanUteVenezuelanVietnameseWelshWest IndianYakamaYaquiYugoslavianYumanYup'ikZimbabwean
Immigration
NonimmigrantsImmigrantsAfghanistanAfricaAlbaniaArgentinaArmeniaAsiaAustraliaAustriaBahamasBangladeshBarbadosBelarusBelgiumBelizeBoliviaBosnia and HerzegovinaBrazilBulgariaBurma/MyanmarCabo VerdeCambodiaCameroonCanadaCaribbeanCentral AmericaChileChinaColombiaCongoCosta RicaCroatiaCubaDenmarkDominicaDominican RepublicEastern AfricaEastern AsiaEastern EuropeEcuadorEgyptEl SalvadorEnglandEritreaEthiopiaEuropeFijiFranceGermanyGhanaGreeceGrenadaGuatemalaGuyanaHaitiHondurasHong KongHungaryIndiaIndonesiaIranIraqIrelandIsraelItalyJamaicaJapanJordanKazakhstanKenyaKoreaKuwaitLaosLatin AmericaLatviaLebanonLiberiaLithuaniaMalaysiaMexicoMicronesiaMiddle AfricaMoldovaMoroccoNepalNetherlandsNicaraguaNigeriaNorth AmericaNorth MacedoniaNorthern AfricaNorthern EuropeNorwayOceaniaPakistanPanamaPeruPhilippinesPolandPortugalRomaniaRussiaSaudi ArabiaScotlandSenegalSerbiaSierra LeoneSingaporeSomaliaSouth AfricaSouth AmericaSouth Central AsiaSouth Eastern AsiaSouthern EuropeSpainSri LankaSt. Vincent and the GrenadinesSudanSwedenSwitzerlandSyriaTaiwanThailandTrinidad and TobagoTurkeyUgandaUkraineUruguayUzbekistanVenezuelaVietnamWest IndiesWestern AfricaWestern AsiaWestern EuropeYemenZaireZimbabweAzores
Disability Age Under 5
Income
Poverty
Unemployment
Labor Participation
Family Structure
Vehicle Availability
Education Level
Disability

Immigrants from Czechoslovakia Disability Age Under 5
Excellent

1.2%
DISABILITY | AGE UNDER 5
82.8/ 100
METRIC RATING
138th/ 347
METRIC RANK

Immigrants from Czechoslovakia Disability Age Under 5 Correlation Chart

The statistical analysis conducted on geographies consisting of 125,406,021 people shows a slight positive correlation between the proportion of Immigrants from Czechoslovakia and percentage of population with a disability under the age of 5 in the United States with a correlation coefficient (R) of 0.072 and weighted average of 1.2%. On average, for every 1% (one percent) increase in Immigrants from Czechoslovakia within a typical geography, there is an increase of 0.32% in percentage of population with a disability under the age of 5.
Immigrants from Czechoslovakia Disability Age Under 5
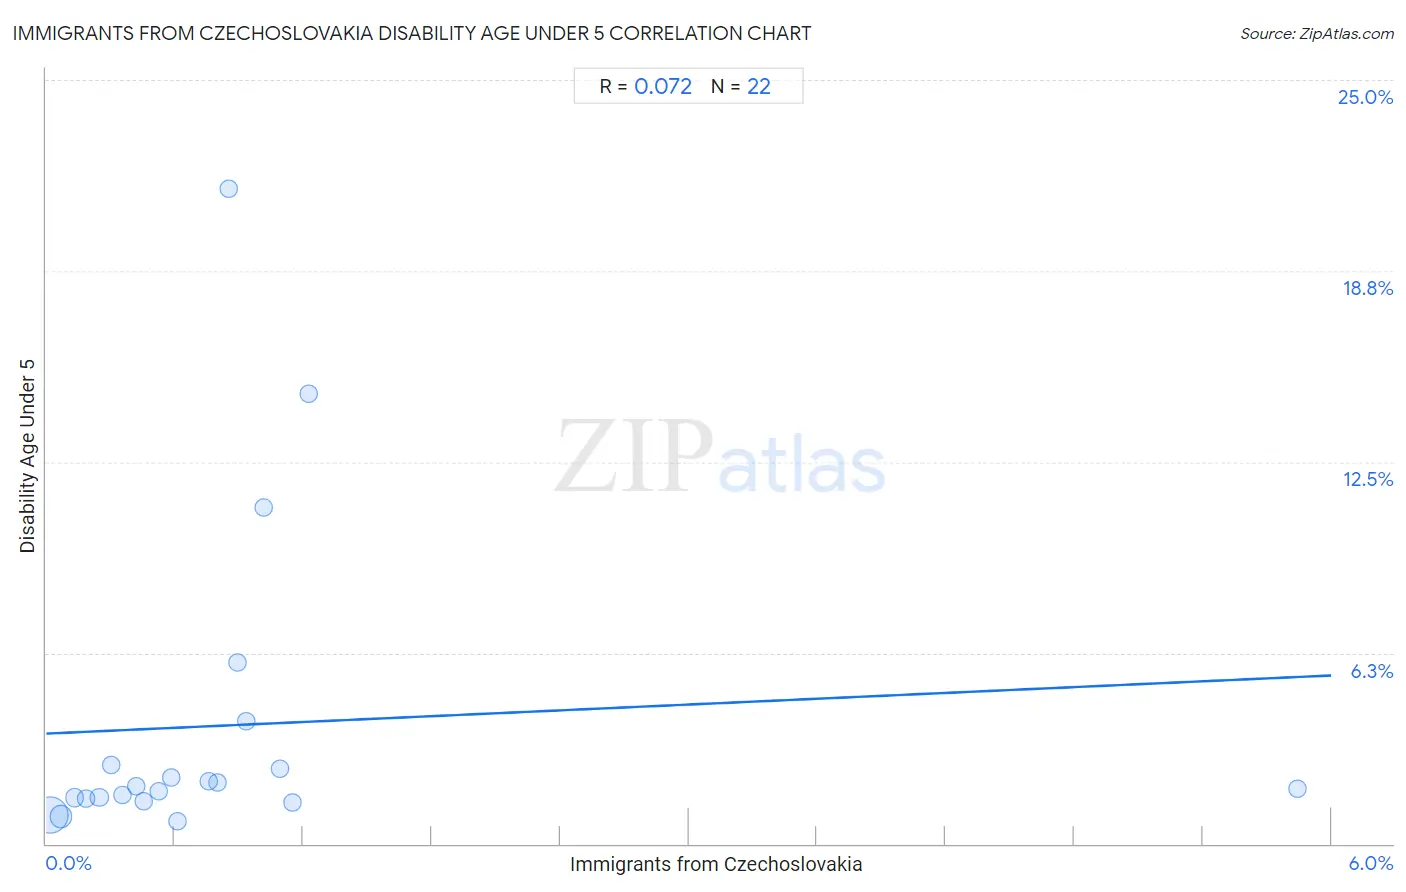
It is essential to understand that the correlation between the percentage of Immigrants from Czechoslovakia and percentage of population with a disability under the age of 5 does not imply a direct cause-and-effect relationship. It remains uncertain whether the presence of Immigrants from Czechoslovakia influences an upward or downward trend in the level of percentage of population with a disability under the age of 5 within an area, or if Immigrants from Czechoslovakia simply ended up residing in those areas with higher or lower levels of percentage of population with a disability under the age of 5 due to other factors.

Demographics Similar to Immigrants from Czechoslovakia by Disability Age Under 5

In terms of disability age under 5, the demographic groups most similar to Immigrants from Czechoslovakia are Immigrants from Eastern Africa (1.2%, a difference of 0.050%), Moroccan (1.2%, a difference of 0.14%), New Zealander (1.2%, a difference of 0.23%), Fijian (1.2%, a difference of 0.32%), and Somali (1.2%, a difference of 0.32%).
DemographicsRating | RankDisability Age Under 5
Immigrants from Serbia
87.6
/100
|
#131
Excellent
1.2%
Immigrants from Eastern Europe
87.3
/100
|
#132
Excellent
1.2%
Immigrants from Spain
86.5
/100
|
#133
Excellent
1.2%
Argentineans
85.7
/100
|
#134
Excellent
1.2%
Fijians
84.7
/100
|
#135
Excellent
1.2%
Moroccans
83.6
/100
|
#136
Excellent
1.2%
Immigrants from Eastern Africa
83.1
/100
|
#137
Excellent
1.2%
Immigrants from Czechoslovakia
82.8
/100
|
#138
Excellent
1.2%
New Zealanders
81.4
/100
|
#139
Excellent
1.2%
Somalis
80.8
/100
|
#140
Excellent
1.2%
Immigrants from Honduras
80.4
/100
|
#141
Excellent
1.2%
Immigrants from Colombia
79.3
/100
|
#142
Good
1.2%
Alsatians
79.3
/100
|
#143
Good
1.2%
Immigrants from Middle Africa
79.3
/100
|
#144
Good
1.2%
Immigrants from Zimbabwe
77.9
/100
|
#145
Good
1.2%

Immigrants from Czechoslovakia Disability Age Under 5 Correlation Summary

MeasurementImmigrants from Czechoslovakia DataDisability Age Under 5 Data
Minimum0.020%0.72%
Maximum5.8%21.4%
Range5.8%20.7%
Mean0.84%3.9%
Median0.60%1.8%
Interquartile 25% (IQ1)0.30%1.5%
Interquartile 75% (IQ3)0.93%2.6%
Interquartile Range (IQR)0.63%1.1%
Standard Deviation (Sample)1.2%5.2%
Standard Deviation (Population)1.1%5.1%

Correlation Details

Immigrants from Czechoslovakia PercentileSample SizeDisability Age Under 5
[
0.0%
-
0.5%
]
0.020%
95,042,4530.95%
[
0.0%
-
0.5%
]
0.069%
22,242,3660.90%
[
0.0%
-
0.5%
]
0.13%
4,404,6721.5%
[
0.0%
-
0.5%
]
0.19%
1,716,3611.5%
[
0.0%
-
0.5%
]
0.25%
839,4171.5%
[
0.0%
-
0.5%
]
0.30%
299,7832.6%
[
0.0%
-
0.5%
]
0.36%
247,5681.6%
[
0.0%
-
0.5%
]
0.42%
185,6241.9%
[
0.0%
-
0.5%
]
0.45%
113,7631.4%
[
0.5%
-
1.0%
]
0.52%
112,8921.7%
[
0.5%
-
1.0%
]
0.59%
57,3872.2%
[
0.5%
-
1.0%
]
0.61%
21,9530.72%
[
0.5%
-
1.0%
]
0.76%
67,0012.0%
[
0.5%
-
1.0%
]
0.80%
9,0272.0%
[
0.5%
-
1.0%
]
0.85%
5,41121.4%
[
0.5%
-
1.0%
]
0.89%
13,0025.9%
[
0.5%
-
1.0%
]
0.93%
1,1794.0%
[
1.0%
-
1.5%
]
1.02%
2,46211.0%
[
1.0%
-
1.5%
]
1.09%
6,9542.4%
[
1.0%
-
1.5%
]
1.15%
11,1551.4%
[
1.0%
-
1.5%
]
1.23%
3,58914.7%
[
5.5%
-
6.0%
]
5.84%
2,0021.8%