Native/Alaskan Disability Age Under 5
COMPARE
Native/Alaskan
Select to Compare
Disability Age Under 5
Native/Alaskan Disability Age Under 5
1.9%
DISABILITY | AGE UNDER 5
0.0/ 100
METRIC RATING
334th/ 347
METRIC RANK
Native/Alaskan Disability Age Under 5 Correlation Chart
The statistical analysis conducted on geographies consisting of 253,755,946 people shows a moderate positive correlation between the proportion of Natives/Alaskans and percentage of population with a disability under the age of 5 in the United States with a correlation coefficient (R) of 0.413 and weighted average of 1.9%. On average, for every 1% (one percent) increase in Natives/Alaskans within a typical geography, there is an increase of 0.093% in percentage of population with a disability under the age of 5.
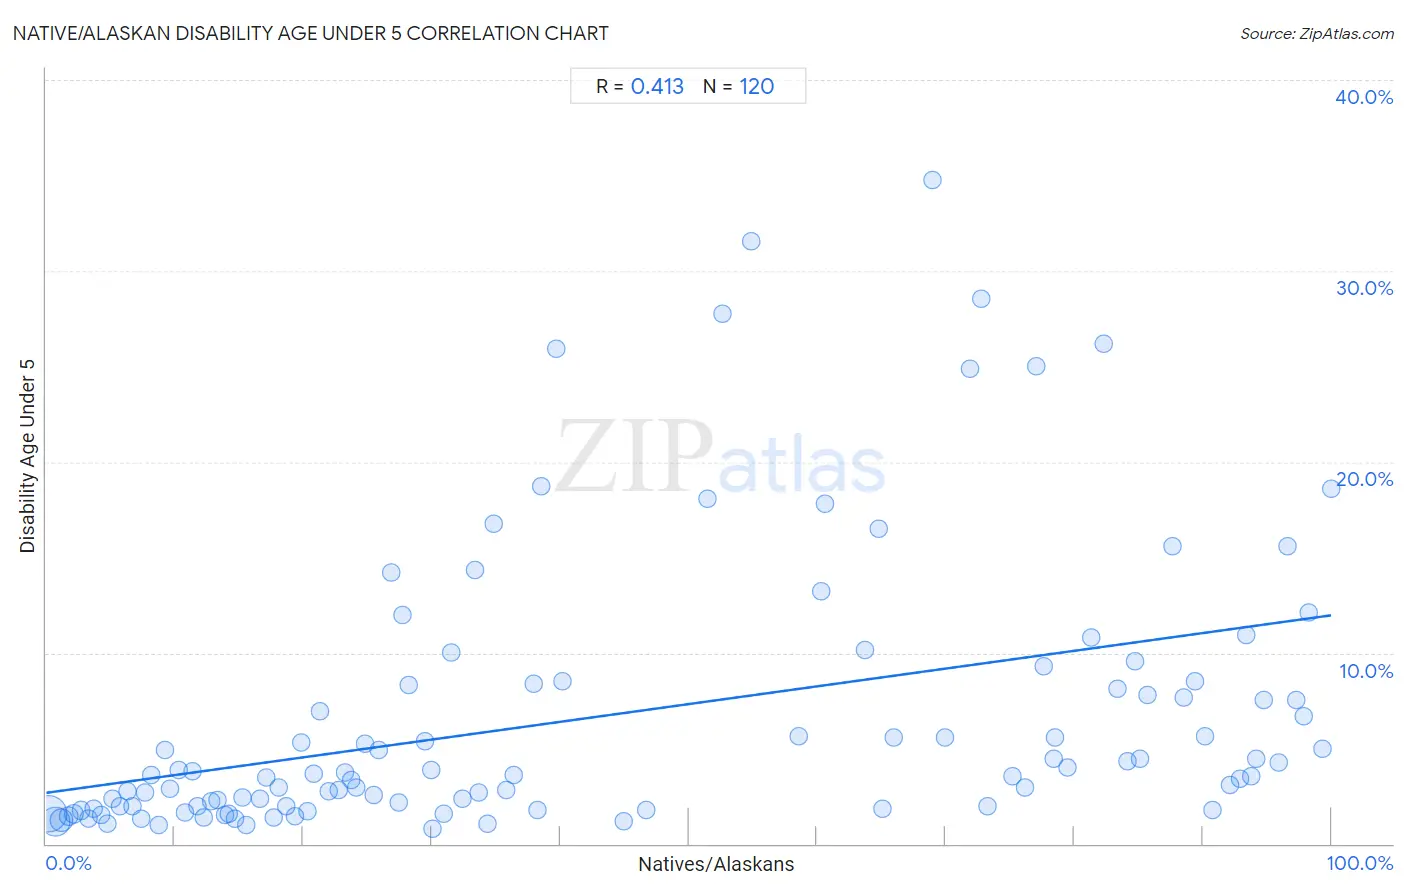
It is essential to understand that the correlation between the percentage of Natives/Alaskans and percentage of population with a disability under the age of 5 does not imply a direct cause-and-effect relationship. It remains uncertain whether the presence of Natives/Alaskans influences an upward or downward trend in the level of percentage of population with a disability under the age of 5 within an area, or if Natives/Alaskans simply ended up residing in those areas with higher or lower levels of percentage of population with a disability under the age of 5 due to other factors.
Demographics Similar to Natives/Alaskans by Disability Age Under 5
In terms of disability age under 5, the demographic groups most similar to Natives/Alaskans are Pennsylvania German (1.9%, a difference of 0.38%), Dutch West Indian (1.9%, a difference of 0.40%), Paraguayan (2.0%, a difference of 1.7%), Chippewa (1.9%, a difference of 3.4%), and French Canadian (1.9%, a difference of 3.4%).
| Demographics | Rating | Rank | Disability Age Under 5 |
| Osage | 0.0 /100 | #327 | Tragic 1.8% |
| Americans | 0.0 /100 | #328 | Tragic 1.9% |
| Houma | 0.0 /100 | #329 | Tragic 1.9% |
| Choctaw | 0.0 /100 | #330 | Tragic 1.9% |
| French Canadians | 0.0 /100 | #331 | Tragic 1.9% |
| Chippewa | 0.0 /100 | #332 | Tragic 1.9% |
| Dutch West Indians | 0.0 /100 | #333 | Tragic 1.9% |
| Natives/Alaskans | 0.0 /100 | #334 | Tragic 1.9% |
| Pennsylvania Germans | 0.0 /100 | #335 | Tragic 1.9% |
| Paraguayans | 0.0 /100 | #336 | Tragic 2.0% |
| Apache | 0.0 /100 | #337 | Tragic 2.0% |
| Tohono O'odham | 0.0 /100 | #338 | Tragic 2.2% |
| Immigrants from the Azores | 0.0 /100 | #339 | Tragic 2.2% |
| Menominee | 0.0 /100 | #340 | Tragic 2.3% |
| Tsimshian | 0.0 /100 | #341 | Tragic 2.4% |
Native/Alaskan Disability Age Under 5 Correlation Summary
| Measurement | Native/Alaskan Data | Disability Age Under 5 Data |
| Minimum | 0.23% | 0.79% |
| Maximum | 100.0% | 34.8% |
| Range | 99.8% | 34.0% |
| Mean | 43.4% | 6.7% |
| Median | 32.8% | 3.6% |
| Interquartile 25% (IQ1) | 15.0% | 2.0% |
| Interquartile 75% (IQ3) | 76.6% | 8.4% |
| Interquartile Range (IQR) | 61.6% | 6.4% |
| Standard Deviation (Sample) | 32.4% | 7.3% |
| Standard Deviation (Population) | 32.3% | 7.3% |
Correlation Details
| Native/Alaskan Percentile | Sample Size | Disability Age Under 5 |
[ 0.0% - 0.5% ] 0.23% | 125,091,905 | 1.6% |
[ 0.5% - 1.0% ] 0.71% | 69,541,958 | 1.2% |
[ 1.0% - 1.5% ] 1.18% | 30,818,052 | 1.2% |
[ 1.5% - 2.0% ] 1.74% | 9,617,935 | 1.4% |
[ 2.0% - 2.5% ] 2.18% | 6,661,219 | 1.6% |
[ 2.5% - 3.0% ] 2.70% | 2,236,632 | 1.7% |
[ 3.0% - 3.5% ] 3.28% | 2,568,487 | 1.3% |
[ 3.5% - 4.0% ] 3.70% | 1,077,700 | 1.8% |
[ 4.0% - 4.5% ] 4.28% | 1,440,257 | 1.5% |
[ 4.5% - 5.0% ] 4.77% | 1,222,685 | 1.0% |
[ 5.0% - 5.5% ] 5.19% | 240,815 | 2.4% |
[ 5.5% - 6.0% ] 5.73% | 401,685 | 2.0% |
[ 6.0% - 6.5% ] 6.32% | 191,429 | 2.8% |
[ 6.5% - 7.0% ] 6.74% | 116,095 | 2.0% |
[ 7.0% - 7.5% ] 7.35% | 478,267 | 1.3% |
[ 7.5% - 8.0% ] 7.69% | 176,044 | 2.7% |
[ 8.0% - 8.5% ] 8.20% | 196,654 | 3.6% |
[ 8.5% - 9.0% ] 8.71% | 304,801 | 0.96% |
[ 9.0% - 9.5% ] 9.24% | 68,008 | 4.9% |
[ 9.5% - 10.0% ] 9.64% | 53,171 | 2.9% |
[ 10.0% - 10.5% ] 10.27% | 26,531 | 3.9% |
[ 10.5% - 11.0% ] 10.79% | 45,724 | 1.6% |
[ 11.0% - 11.5% ] 11.36% | 28,306 | 3.8% |
[ 11.5% - 12.0% ] 11.80% | 69,121 | 2.0% |
[ 12.0% - 12.5% ] 12.27% | 125,064 | 1.4% |
[ 12.5% - 13.0% ] 12.82% | 32,118 | 2.2% |
[ 13.0% - 13.5% ] 13.34% | 38,093 | 2.3% |
[ 13.5% - 14.0% ] 13.87% | 43,833 | 1.5% |
[ 14.0% - 14.5% ] 14.20% | 40,440 | 1.6% |
[ 14.5% - 15.0% ] 14.71% | 34,557 | 1.3% |
[ 15.0% - 15.5% ] 15.25% | 81,880 | 2.4% |
[ 15.5% - 16.0% ] 15.56% | 37,778 | 0.99% |
[ 16.5% - 17.0% ] 16.64% | 35,950 | 2.3% |
[ 17.0% - 17.5% ] 17.14% | 53,635 | 3.5% |
[ 17.5% - 18.0% ] 17.74% | 21,684 | 1.4% |
[ 18.0% - 18.5% ] 18.10% | 99,221 | 2.9% |
[ 18.5% - 19.0% ] 18.72% | 22,453 | 2.0% |
[ 19.0% - 19.5% ] 19.34% | 37,012 | 1.4% |
[ 19.5% - 20.0% ] 19.87% | 2,813 | 5.3% |
[ 20.0% - 20.5% ] 20.30% | 16,307 | 1.7% |
[ 20.5% - 21.0% ] 20.79% | 3,357 | 3.7% |
[ 21.0% - 21.5% ] 21.33% | 5,987 | 6.9% |
[ 22.0% - 22.5% ] 22.01% | 268 | 2.8% |
[ 22.5% - 23.0% ] 22.72% | 11,582 | 2.8% |
[ 23.0% - 23.5% ] 23.23% | 1,339 | 3.7% |
[ 23.5% - 24.0% ] 23.74% | 14,365 | 3.4% |
[ 24.0% - 24.5% ] 24.14% | 1,914 | 2.9% |
[ 24.5% - 25.0% ] 24.80% | 7,608 | 5.3% |
[ 25.0% - 25.5% ] 25.45% | 9,628 | 2.6% |
[ 25.5% - 26.0% ] 25.87% | 3,549 | 4.9% |
[ 26.5% - 27.0% ] 26.86% | 2,107 | 14.2% |
[ 27.0% - 27.5% ] 27.46% | 8,306 | 2.2% |
[ 27.5% - 28.0% ] 27.75% | 7,992 | 12.0% |
[ 28.0% - 28.5% ] 28.20% | 2,096 | 8.3% |
[ 29.0% - 29.5% ] 29.47% | 1,310 | 5.4% |
[ 29.5% - 30.0% ] 29.95% | 7,892 | 3.9% |
[ 30.0% - 30.5% ] 30.02% | 16,389 | 0.79% |
[ 30.5% - 31.0% ] 30.89% | 1,868 | 1.6% |
[ 31.0% - 31.5% ] 31.48% | 1,099 | 10.0% |
[ 32.0% - 32.5% ] 32.37% | 8,033 | 2.4% |
[ 33.0% - 33.5% ] 33.32% | 6,908 | 14.3% |
[ 33.5% - 34.0% ] 33.71% | 1,792 | 2.7% |
[ 34.0% - 34.5% ] 34.34% | 30,812 | 1.1% |
[ 34.5% - 35.0% ] 34.82% | 560 | 16.8% |
[ 35.5% - 36.0% ] 35.78% | 8,623 | 2.8% |
[ 36.0% - 36.5% ] 36.43% | 1,466 | 3.6% |
[ 37.5% - 38.0% ] 37.98% | 2,146 | 8.4% |
[ 38.0% - 38.5% ] 38.25% | 8,108 | 1.8% |
[ 38.5% - 39.0% ] 38.51% | 1,158 | 18.8% |
[ 39.5% - 40.0% ] 39.72% | 360 | 25.9% |
[ 40.0% - 40.5% ] 40.18% | 3,156 | 8.5% |
[ 44.5% - 45.0% ] 44.96% | 5,358 | 1.2% |
[ 46.5% - 47.0% ] 46.70% | 2,195 | 1.7% |
[ 51.0% - 51.5% ] 51.45% | 1,240 | 18.0% |
[ 52.5% - 53.0% ] 52.67% | 150 | 27.8% |
[ 54.5% - 55.0% ] 54.89% | 348 | 31.6% |
[ 58.5% - 59.0% ] 58.57% | 1,103 | 5.6% |
[ 60.0% - 60.5% ] 60.36% | 2,969 | 13.3% |
[ 60.5% - 61.0% ] 60.57% | 3,982 | 17.8% |
[ 63.5% - 64.0% ] 63.76% | 574 | 10.1% |
[ 64.5% - 65.0% ] 64.75% | 9,755 | 16.5% |
[ 65.0% - 65.5% ] 65.10% | 6,499 | 1.8% |
[ 65.5% - 66.0% ] 65.96% | 285 | 5.6% |
[ 68.5% - 69.0% ] 68.98% | 864 | 34.8% |
[ 69.5% - 70.0% ] 69.93% | 838 | 5.6% |
[ 71.5% - 72.0% ] 71.85% | 2,714 | 24.9% |
[ 72.5% - 73.0% ] 72.78% | 338 | 28.6% |
[ 73.0% - 73.5% ] 73.29% | 12,346 | 2.0% |
[ 75.0% - 75.5% ] 75.20% | 613 | 3.5% |
[ 76.0% - 76.5% ] 76.19% | 525 | 2.9% |
[ 77.0% - 77.5% ] 77.00% | 200 | 25.0% |
[ 77.5% - 78.0% ] 77.61% | 1,206 | 9.3% |
[ 78.0% - 78.5% ] 78.42% | 959 | 4.4% |
[ 78.5% - 79.0% ] 78.51% | 698 | 5.6% |
[ 79.0% - 79.5% ] 79.45% | 472 | 4.0% |
[ 81.0% - 81.5% ] 81.31% | 1,980 | 10.8% |
[ 82.0% - 82.5% ] 82.30% | 610 | 26.2% |
[ 83.0% - 83.5% ] 83.40% | 2,650 | 8.1% |
[ 84.0% - 84.5% ] 84.10% | 1,465 | 4.3% |
[ 84.5% - 85.0% ] 84.70% | 7,247 | 9.6% |
[ 85.0% - 85.5% ] 85.11% | 1,175 | 4.5% |
[ 85.5% - 86.0% ] 85.68% | 4,666 | 7.8% |
[ 87.5% - 88.0% ] 87.64% | 1,755 | 15.6% |
[ 88.5% - 89.0% ] 88.56% | 6,365 | 7.7% |
[ 89.0% - 89.5% ] 89.39% | 5,229 | 8.5% |
[ 90.0% - 90.5% ] 90.21% | 1,308 | 5.6% |
[ 90.5% - 91.0% ] 90.77% | 3,499 | 1.8% |
[ 92.0% - 92.5% ] 92.14% | 992 | 3.1% |
[ 92.5% - 93.0% ] 92.88% | 20,884 | 3.4% |
[ 93.0% - 93.5% ] 93.35% | 2,405 | 11.0% |
[ 93.5% - 94.0% ] 93.78% | 16,660 | 3.6% |
[ 94.0% - 94.5% ] 94.19% | 8,440 | 4.4% |
[ 94.5% - 95.0% ] 94.73% | 4,990 | 7.5% |
[ 95.5% - 96.0% ] 95.90% | 1,122 | 4.2% |
[ 96.5% - 97.0% ] 96.59% | 3,577 | 15.6% |
[ 97.0% - 97.5% ] 97.23% | 4,693 | 7.5% |
[ 97.5% - 98.0% ] 97.85% | 1,768 | 6.7% |
[ 98.0% - 98.5% ] 98.25% | 8,798 | 12.1% |
[ 99.0% - 99.5% ] 99.30% | 2,419 | 5.0% |
[ 99.5% - 100.0% ] 100.00% | 6,921 | 18.6% |