Immigrants from Jamaica Disability Age Under 5
COMPARE
Immigrants from Jamaica
Select to Compare
Disability Age Under 5
Immigrants from Jamaica Disability Age Under 5
1.2%
DISABILITY | AGE UNDER 5
58.8/ 100
METRIC RATING
170th/ 347
METRIC RANK
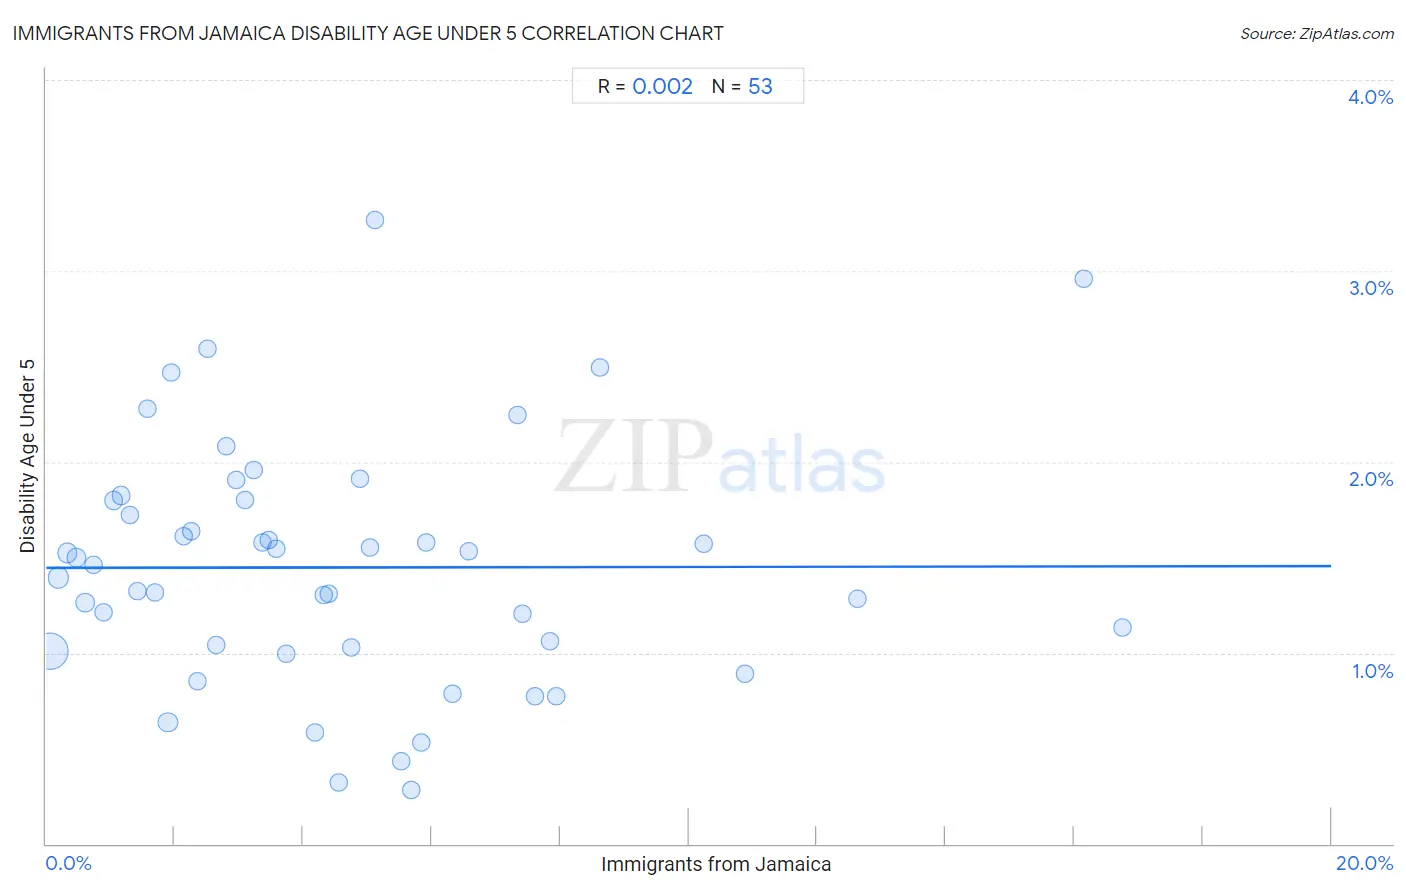
Immigrants from Jamaica Disability Age Under 5 Correlation Chart
The statistical analysis conducted on geographies consisting of 173,327,307 people shows no correlation between the proportion of Immigrants from Jamaica and percentage of population with a disability under the age of 5 in the United States with a correlation coefficient (R) of 0.002 and weighted average of 1.2%. On average, for every 1% (one percent) increase in Immigrants from Jamaica within a typical geography, there is an increase of 0.00043% in percentage of population with a disability under the age of 5.
It is essential to understand that the correlation between the percentage of Immigrants from Jamaica and percentage of population with a disability under the age of 5 does not imply a direct cause-and-effect relationship. It remains uncertain whether the presence of Immigrants from Jamaica influences an upward or downward trend in the level of percentage of population with a disability under the age of 5 within an area, or if Immigrants from Jamaica simply ended up residing in those areas with higher or lower levels of percentage of population with a disability under the age of 5 due to other factors.
Demographics Similar to Immigrants from Jamaica by Disability Age Under 5
In terms of disability age under 5, the demographic groups most similar to Immigrants from Jamaica are Immigrants from Uruguay (1.2%, a difference of 0.020%), Sierra Leonean (1.2%, a difference of 0.030%), Guamanian/Chamorro (1.2%, a difference of 0.090%), Immigrants from Argentina (1.2%, a difference of 0.13%), and Immigrants from Central America (1.2%, a difference of 0.25%).
| Demographics | Rating | Rank | Disability Age Under 5 |
| Immigrants from Guatemala | 63.2 /100 | #163 | Good 1.2% |
| Laotians | 62.8 /100 | #164 | Good 1.2% |
| Immigrants from Kuwait | 62.6 /100 | #165 | Good 1.2% |
| Immigrants from Central America | 61.4 /100 | #166 | Good 1.2% |
| Immigrants from Argentina | 60.2 /100 | #167 | Good 1.2% |
| Sierra Leoneans | 59.1 /100 | #168 | Average 1.2% |
| Immigrants from Uruguay | 59.0 /100 | #169 | Average 1.2% |
| Immigrants from Jamaica | 58.8 /100 | #170 | Average 1.2% |
| Guamanians/Chamorros | 57.8 /100 | #171 | Average 1.2% |
| Crow | 51.0 /100 | #172 | Average 1.2% |
| Immigrants from Ireland | 50.3 /100 | #173 | Average 1.2% |
| Immigrants from Latvia | 50.0 /100 | #174 | Average 1.2% |
| Immigrants from Nigeria | 50.0 /100 | #175 | Average 1.2% |
| Immigrants from Kenya | 48.6 /100 | #176 | Average 1.2% |
| Comanche | 47.5 /100 | #177 | Average 1.2% |
Immigrants from Jamaica Disability Age Under 5 Correlation Summary
| Measurement | Immigrants from Jamaica Data | Disability Age Under 5 Data |
| Minimum | 0.054% | 0.28% |
| Maximum | 16.7% | 3.3% |
| Range | 16.7% | 3.0% |
| Mean | 4.5% | 1.4% |
| Median | 3.6% | 1.5% |
| Interquartile 25% (IQ1) | 1.8% | 1.0% |
| Interquartile 75% (IQ3) | 6.1% | 1.8% |
| Interquartile Range (IQR) | 4.3% | 0.78% |
| Standard Deviation (Sample) | 3.7% | 0.64% |
| Standard Deviation (Population) | 3.7% | 0.63% |
Correlation Details
| Immigrants from Jamaica Percentile | Sample Size | Disability Age Under 5 |
[ 0.0% - 0.5% ] 0.054% | 109,154,839 | 1.0% |
[ 0.0% - 0.5% ] 0.19% | 19,115,479 | 1.4% |
[ 0.0% - 0.5% ] 0.33% | 9,459,368 | 1.5% |
[ 0.0% - 0.5% ] 0.47% | 5,281,580 | 1.5% |
[ 0.5% - 1.0% ] 0.60% | 5,245,420 | 1.3% |
[ 0.5% - 1.0% ] 0.74% | 2,134,896 | 1.5% |
[ 0.5% - 1.0% ] 0.89% | 2,227,605 | 1.2% |
[ 1.0% - 1.5% ] 1.05% | 1,457,828 | 1.8% |
[ 1.0% - 1.5% ] 1.17% | 1,689,792 | 1.8% |
[ 1.0% - 1.5% ] 1.30% | 783,348 | 1.7% |
[ 1.0% - 1.5% ] 1.41% | 754,966 | 1.3% |
[ 1.5% - 2.0% ] 1.58% | 798,593 | 2.3% |
[ 1.5% - 2.0% ] 1.70% | 617,161 | 1.3% |
[ 1.5% - 2.0% ] 1.89% | 9,355,258 | 0.64% |
[ 1.5% - 2.0% ] 1.94% | 236,916 | 2.5% |
[ 2.0% - 2.5% ] 2.13% | 509,603 | 1.6% |
[ 2.0% - 2.5% ] 2.26% | 297,894 | 1.6% |
[ 2.0% - 2.5% ] 2.35% | 169,245 | 0.85% |
[ 2.5% - 3.0% ] 2.51% | 146,814 | 2.6% |
[ 2.5% - 3.0% ] 2.64% | 301,732 | 1.0% |
[ 2.5% - 3.0% ] 2.80% | 83,129 | 2.1% |
[ 2.5% - 3.0% ] 2.96% | 369,274 | 1.9% |
[ 3.0% - 3.5% ] 3.09% | 178,672 | 1.8% |
[ 3.0% - 3.5% ] 3.24% | 88,363 | 2.0% |
[ 3.0% - 3.5% ] 3.36% | 317,802 | 1.6% |
[ 3.0% - 3.5% ] 3.45% | 74,443 | 1.6% |
[ 3.5% - 4.0% ] 3.58% | 158,843 | 1.5% |
[ 3.5% - 4.0% ] 3.73% | 164,722 | 1.00% |
[ 4.0% - 4.5% ] 4.18% | 222,343 | 0.59% |
[ 4.0% - 4.5% ] 4.31% | 112,682 | 1.3% |
[ 4.0% - 4.5% ] 4.40% | 58,746 | 1.3% |
[ 4.5% - 5.0% ] 4.54% | 159,313 | 0.32% |
[ 4.5% - 5.0% ] 4.75% | 22,506 | 1.0% |
[ 4.5% - 5.0% ] 4.89% | 9,246 | 1.9% |
[ 5.0% - 5.5% ] 5.04% | 70,365 | 1.6% |
[ 5.0% - 5.5% ] 5.12% | 131,713 | 3.3% |
[ 5.5% - 6.0% ] 5.53% | 111,618 | 0.43% |
[ 5.5% - 6.0% ] 5.69% | 148,452 | 0.28% |
[ 5.5% - 6.0% ] 5.85% | 75,435 | 0.53% |
[ 5.5% - 6.0% ] 5.91% | 38,874 | 1.6% |
[ 6.0% - 6.5% ] 6.33% | 37,274 | 0.78% |
[ 6.5% - 7.0% ] 6.58% | 115,526 | 1.5% |
[ 7.0% - 7.5% ] 7.33% | 121,057 | 2.2% |
[ 7.0% - 7.5% ] 7.41% | 73,947 | 1.2% |
[ 7.5% - 8.0% ] 7.60% | 17,178 | 0.77% |
[ 7.5% - 8.0% ] 7.84% | 83,221 | 1.1% |
[ 7.5% - 8.0% ] 7.94% | 135,158 | 0.77% |
[ 8.5% - 9.0% ] 8.63% | 71,749 | 2.5% |
[ 10.0% - 10.5% ] 10.24% | 13,781 | 1.6% |
[ 10.5% - 11.0% ] 10.88% | 78,506 | 0.89% |
[ 12.5% - 13.0% ] 12.63% | 127,927 | 1.3% |
[ 16.0% - 16.5% ] 16.14% | 72,273 | 3.0% |
[ 16.5% - 17.0% ] 16.74% | 44,832 | 1.1% |