Taiwanese Disability Age Under 5
COMPARE
Taiwanese
Select to Compare
Disability Age Under 5
Taiwanese Disability Age Under 5
1.3%
DISABILITY | AGE UNDER 5
6.1/ 100
METRIC RATING
227th/ 347
METRIC RANK
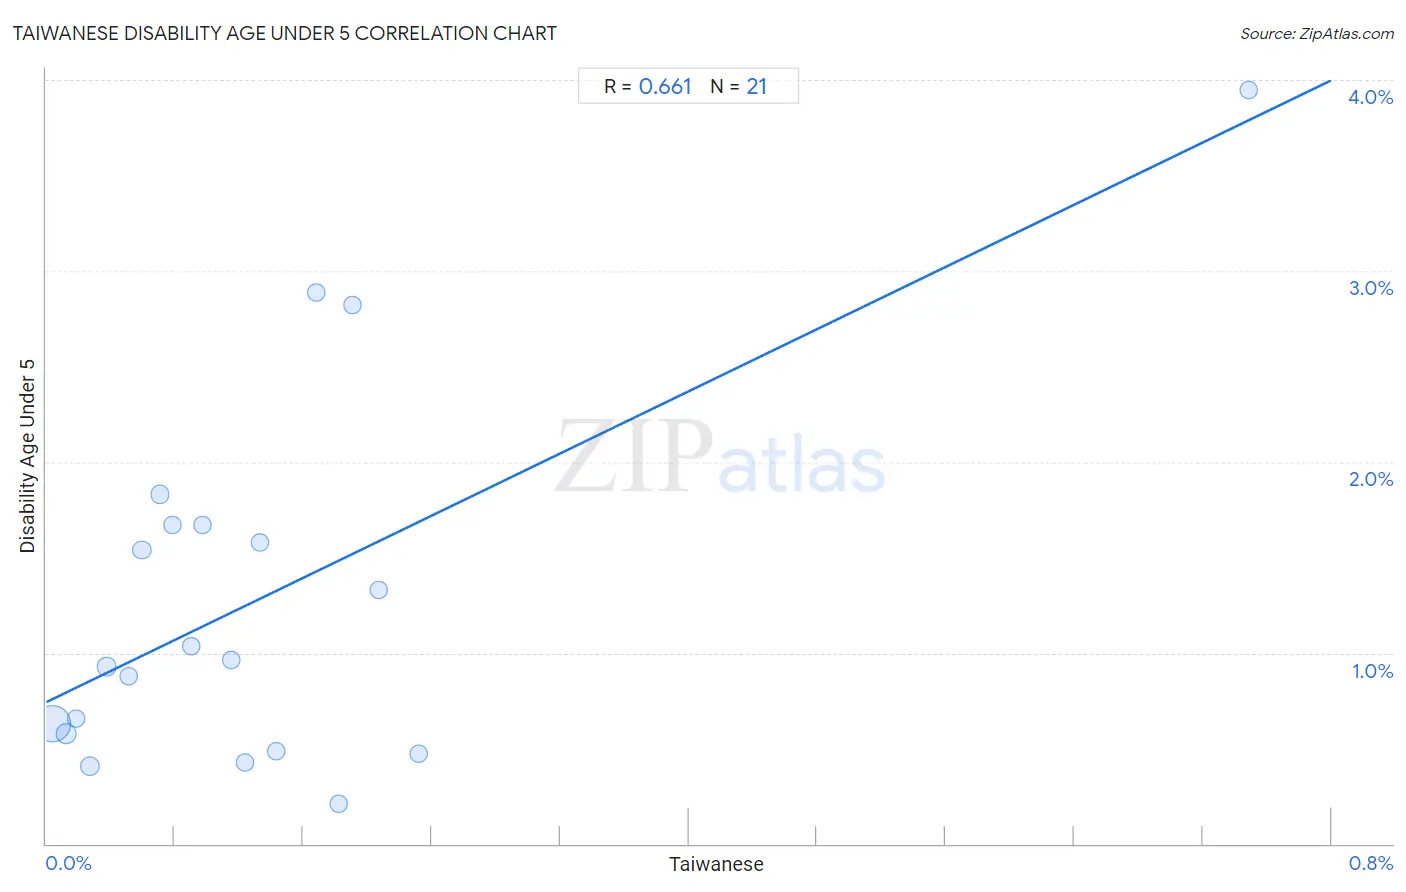
Taiwanese Disability Age Under 5 Correlation Chart
The statistical analysis conducted on geographies consisting of 29,016,682 people shows a significant positive correlation between the proportion of Taiwanese and percentage of population with a disability under the age of 5 in the United States with a correlation coefficient (R) of 0.661 and weighted average of 1.3%. On average, for every 1% (one percent) increase in Taiwanese within a typical geography, there is an increase of 4.1% in percentage of population with a disability under the age of 5.
It is essential to understand that the correlation between the percentage of Taiwanese and percentage of population with a disability under the age of 5 does not imply a direct cause-and-effect relationship. It remains uncertain whether the presence of Taiwanese influences an upward or downward trend in the level of percentage of population with a disability under the age of 5 within an area, or if Taiwanese simply ended up residing in those areas with higher or lower levels of percentage of population with a disability under the age of 5 due to other factors.
Demographics Similar to Taiwanese by Disability Age Under 5
In terms of disability age under 5, the demographic groups most similar to Taiwanese are Luxembourger (1.3%, a difference of 0.010%), Immigrants from Costa Rica (1.3%, a difference of 0.23%), Lebanese (1.3%, a difference of 0.32%), Panamanian (1.3%, a difference of 0.34%), and Bahamian (1.3%, a difference of 0.34%).
| Demographics | Rating | Rank | Disability Age Under 5 |
| Serbians | 9.6 /100 | #220 | Tragic 1.3% |
| Sub-Saharan Africans | 8.3 /100 | #221 | Tragic 1.3% |
| Ukrainians | 8.3 /100 | #222 | Tragic 1.3% |
| Hispanics or Latinos | 7.7 /100 | #223 | Tragic 1.3% |
| Latvians | 7.1 /100 | #224 | Tragic 1.3% |
| Panamanians | 7.1 /100 | #225 | Tragic 1.3% |
| Bahamians | 7.1 /100 | #226 | Tragic 1.3% |
| Taiwanese | 6.1 /100 | #227 | Tragic 1.3% |
| Luxembourgers | 6.1 /100 | #228 | Tragic 1.3% |
| Immigrants from Costa Rica | 5.5 /100 | #229 | Tragic 1.3% |
| Lebanese | 5.3 /100 | #230 | Tragic 1.3% |
| Immigrants from Northern Europe | 4.7 /100 | #231 | Tragic 1.3% |
| French American Indians | 4.5 /100 | #232 | Tragic 1.3% |
| Tongans | 4.2 /100 | #233 | Tragic 1.3% |
| Pueblo | 3.8 /100 | #234 | Tragic 1.3% |
Taiwanese Disability Age Under 5 Correlation Summary
| Measurement | Taiwanese Data | Disability Age Under 5 Data |
| Minimum | 0.0036% | 0.21% |
| Maximum | 0.75% | 4.0% |
| Range | 0.75% | 3.7% |
| Mean | 0.13% | 1.3% |
| Median | 0.098% | 0.96% |
| Interquartile 25% (IQ1) | 0.044% | 0.53% |
| Interquartile 75% (IQ3) | 0.17% | 1.7% |
| Interquartile Range (IQR) | 0.13% | 1.1% |
| Standard Deviation (Sample) | 0.16% | 0.96% |
| Standard Deviation (Population) | 0.15% | 0.94% |
Correlation Details
| Taiwanese Percentile | Sample Size | Disability Age Under 5 |
[ 0.0% - 0.5% ] 0.0036% | 22,126,525 | 0.63% |
[ 0.0% - 0.5% ] 0.012% | 3,172,593 | 0.58% |
[ 0.0% - 0.5% ] 0.018% | 344,365 | 0.66% |
[ 0.0% - 0.5% ] 0.027% | 1,731,117 | 0.41% |
[ 0.0% - 0.5% ] 0.038% | 611,212 | 0.93% |
[ 0.0% - 0.5% ] 0.051% | 160,828 | 0.88% |
[ 0.0% - 0.5% ] 0.060% | 80,643 | 1.5% |
[ 0.0% - 0.5% ] 0.071% | 123,053 | 1.8% |
[ 0.0% - 0.5% ] 0.079% | 70,952 | 1.7% |
[ 0.0% - 0.5% ] 0.091% | 101,631 | 1.0% |
[ 0.0% - 0.5% ] 0.098% | 41,006 | 1.7% |
[ 0.0% - 0.5% ] 0.11% | 30,446 | 0.96% |
[ 0.0% - 0.5% ] 0.12% | 21,050 | 0.43% |
[ 0.0% - 0.5% ] 0.13% | 68,996 | 1.6% |
[ 0.0% - 0.5% ] 0.14% | 47,549 | 0.48% |
[ 0.0% - 0.5% ] 0.17% | 32,717 | 2.9% |
[ 0.0% - 0.5% ] 0.18% | 44,570 | 0.21% |
[ 0.0% - 0.5% ] 0.19% | 63,422 | 2.8% |
[ 0.0% - 0.5% ] 0.21% | 48,399 | 1.3% |
[ 0.0% - 0.5% ] 0.23% | 29,359 | 0.47% |
[ 0.5% - 1.0% ] 0.75% | 66,249 | 4.0% |