Native Hawaiian Disability Age Under 5

COMPARE

Native Hawaiian
Race
Ancestry
AfghanAfricanAlaska NativeAlaskan AthabascanAlbanianAleutAlsatianAmericanApacheArabArapahoArgentineanArmenianAssyrian/Chaldean/SyriacAustralianAustrianBahamianBangladeshiBarbadianBasqueBelgianBelizeanBermudanBhutaneseBlackfeetBolivianBrazilianBritishBritish West IndianBulgarianBurmeseCajunCambodianCanadianCape VerdeanCarpatho RusynCelticCentral AmericanCentral American IndianCherokeeCheyenneChickasawChileanChineseChippewaChoctawColombianColvilleComancheCosta RicanCreeCreekCroatianCrowCubanCypriotCzechCzechoslovakianDanishDelawareDominicanDutchDutch West IndianEastern EuropeanEcuadorianEgyptianEnglishEstonianEthiopianEuropeanFijianFilipinoFinnishFrenchFrench American IndianFrench CanadianGermanGerman RussianGhanaianGreekGuamanian/ChamorroGuatemalanGuyaneseHaitianHmongHonduranHopiHoumaHungarianIcelanderIndian (Asian)IndonesianInupiatIranianIraqiIrishIroquoisIsraeliItalianJamaicanJapaneseJordanianKenyanKiowaKoreanLaotianLatvianLebaneseLiberianLithuanianLumbeeLuxembourgerMacedonianMalaysianMalteseMarshalleseMenomineeMexicanMexican American IndianMongolianMoroccanNative HawaiianNavajoNepaleseNew ZealanderNicaraguanNigerianNorthern EuropeanNorwegianOkinawanOsageOttawaPaiutePakistaniPalestinianPanamanianParaguayanPennsylvania GermanPeruvianPimaPolishPortuguesePotawatomiPuebloPuerto RicanPuget Sound SalishRomanianRussianSalvadoranSamoanScandinavianScotch-IrishScottishSeminoleSenegaleseSerbianShoshoneSierra LeoneanSiouxSlavicSlovakSloveneSomaliSouth AfricanSouth AmericanSouth American IndianSoviet UnionSpaniardSpanishSpanish AmericanSpanish American IndianSri LankanSubsaharan AfricanSudaneseSwedishSwissSyrianTaiwaneseThaiTlingit-HaidaTohono O'OdhamTonganTrinidadian and TobagonianTsimshianTurkishU.S. Virgin IslanderUgandanUkrainianUruguayanUteVenezuelanVietnameseWelshWest IndianYakamaYaquiYugoslavianYumanYup'ikZimbabwean
Immigration
NonimmigrantsImmigrantsAfghanistanAfricaAlbaniaArgentinaArmeniaAsiaAustraliaAustriaBahamasBangladeshBarbadosBelarusBelgiumBelizeBoliviaBosnia and HerzegovinaBrazilBulgariaBurma/MyanmarCabo VerdeCambodiaCameroonCanadaCaribbeanCentral AmericaChileChinaColombiaCongoCosta RicaCroatiaCubaCzechoslovakiaDenmarkDominicaDominican RepublicEastern AfricaEastern AsiaEastern EuropeEcuadorEgyptEl SalvadorEnglandEritreaEthiopiaEuropeFijiFranceGermanyGhanaGreeceGrenadaGuatemalaGuyanaHaitiHondurasHong KongHungaryIndiaIndonesiaIranIraqIrelandIsraelItalyJamaicaJapanJordanKazakhstanKenyaKoreaKuwaitLaosLatin AmericaLatviaLebanonLiberiaLithuaniaMalaysiaMexicoMicronesiaMiddle AfricaMoldovaMoroccoNepalNetherlandsNicaraguaNigeriaNorth AmericaNorth MacedoniaNorthern AfricaNorthern EuropeNorwayOceaniaPakistanPanamaPeruPhilippinesPolandPortugalRomaniaRussiaSaudi ArabiaScotlandSenegalSerbiaSierra LeoneSingaporeSomaliaSouth AfricaSouth AmericaSouth Central AsiaSouth Eastern AsiaSouthern EuropeSpainSri LankaSt. Vincent and the GrenadinesSudanSwedenSwitzerlandSyriaTaiwanThailandTrinidad and TobagoTurkeyUgandaUkraineUruguayUzbekistanVenezuelaVietnamWest IndiesWestern AfricaWestern AsiaWestern EuropeYemenZaireZimbabweAzores
Select to Compare
Race
Ancestry
AfghanAfricanAlaska NativeAlaskan AthabascanAlbanianAleutAlsatianAmericanApacheArabArapahoArgentineanArmenianAssyrian/Chaldean/SyriacAustralianAustrianBahamianBangladeshiBarbadianBasqueBelgianBelizeanBermudanBhutaneseBlackfeetBolivianBrazilianBritishBritish West IndianBulgarianBurmeseCajunCambodianCanadianCape VerdeanCarpatho RusynCelticCentral AmericanCentral American IndianCherokeeCheyenneChickasawChileanChineseChippewaChoctawColombianColvilleComancheCosta RicanCreeCreekCroatianCrowCubanCypriotCzechCzechoslovakianDanishDelawareDominicanDutchDutch West IndianEastern EuropeanEcuadorianEgyptianEnglishEstonianEthiopianEuropeanFijianFilipinoFinnishFrenchFrench American IndianFrench CanadianGermanGerman RussianGhanaianGreekGuamanian/ChamorroGuatemalanGuyaneseHaitianHmongHonduranHopiHoumaHungarianIcelanderIndian (Asian)IndonesianInupiatIranianIraqiIrishIroquoisIsraeliItalianJamaicanJapaneseJordanianKenyanKiowaKoreanLaotianLatvianLebaneseLiberianLithuanianLumbeeLuxembourgerMacedonianMalaysianMalteseMarshalleseMenomineeMexicanMexican American IndianMongolianMoroccanNavajoNepaleseNew ZealanderNicaraguanNigerianNorthern EuropeanNorwegianOkinawanOsageOttawaPaiutePakistaniPalestinianPanamanianParaguayanPennsylvania GermanPeruvianPimaPolishPortuguesePotawatomiPuebloPuerto RicanPuget Sound SalishRomanianRussianSalvadoranSamoanScandinavianScotch-IrishScottishSeminoleSenegaleseSerbianShoshoneSierra LeoneanSiouxSlavicSlovakSloveneSomaliSouth AfricanSouth AmericanSouth American IndianSoviet UnionSpaniardSpanishSpanish AmericanSpanish American IndianSri LankanSubsaharan AfricanSudaneseSwedishSwissSyrianTaiwaneseThaiTlingit-HaidaTohono O'OdhamTonganTrinidadian and TobagonianTsimshianTurkishU.S. Virgin IslanderUgandanUkrainianUruguayanUteVenezuelanVietnameseWelshWest IndianYakamaYaquiYugoslavianYumanYup'ikZimbabwean
Immigration
NonimmigrantsImmigrantsAfghanistanAfricaAlbaniaArgentinaArmeniaAsiaAustraliaAustriaBahamasBangladeshBarbadosBelarusBelgiumBelizeBoliviaBosnia and HerzegovinaBrazilBulgariaBurma/MyanmarCabo VerdeCambodiaCameroonCanadaCaribbeanCentral AmericaChileChinaColombiaCongoCosta RicaCroatiaCubaCzechoslovakiaDenmarkDominicaDominican RepublicEastern AfricaEastern AsiaEastern EuropeEcuadorEgyptEl SalvadorEnglandEritreaEthiopiaEuropeFijiFranceGermanyGhanaGreeceGrenadaGuatemalaGuyanaHaitiHondurasHong KongHungaryIndiaIndonesiaIranIraqIrelandIsraelItalyJamaicaJapanJordanKazakhstanKenyaKoreaKuwaitLaosLatin AmericaLatviaLebanonLiberiaLithuaniaMalaysiaMexicoMicronesiaMiddle AfricaMoldovaMoroccoNepalNetherlandsNicaraguaNigeriaNorth AmericaNorth MacedoniaNorthern AfricaNorthern EuropeNorwayOceaniaPakistanPanamaPeruPhilippinesPolandPortugalRomaniaRussiaSaudi ArabiaScotlandSenegalSerbiaSierra LeoneSingaporeSomaliaSouth AfricaSouth AmericaSouth Central AsiaSouth Eastern AsiaSouthern EuropeSpainSri LankaSt. Vincent and the GrenadinesSudanSwedenSwitzerlandSyriaTaiwanThailandTrinidad and TobagoTurkeyUgandaUkraineUruguayUzbekistanVenezuelaVietnamWest IndiesWestern AfricaWestern AsiaWestern EuropeYemenZaireZimbabweAzores
Disability Age Under 5
Income
Poverty
Unemployment
Labor Participation
Family Structure
Vehicle Availability
Education Level
Disability

Native Hawaiian Disability Age Under 5
Tragic

1.3%
DISABILITY | AGE UNDER 5
2.2/ 100
METRIC RATING
240th/ 347
METRIC RANK

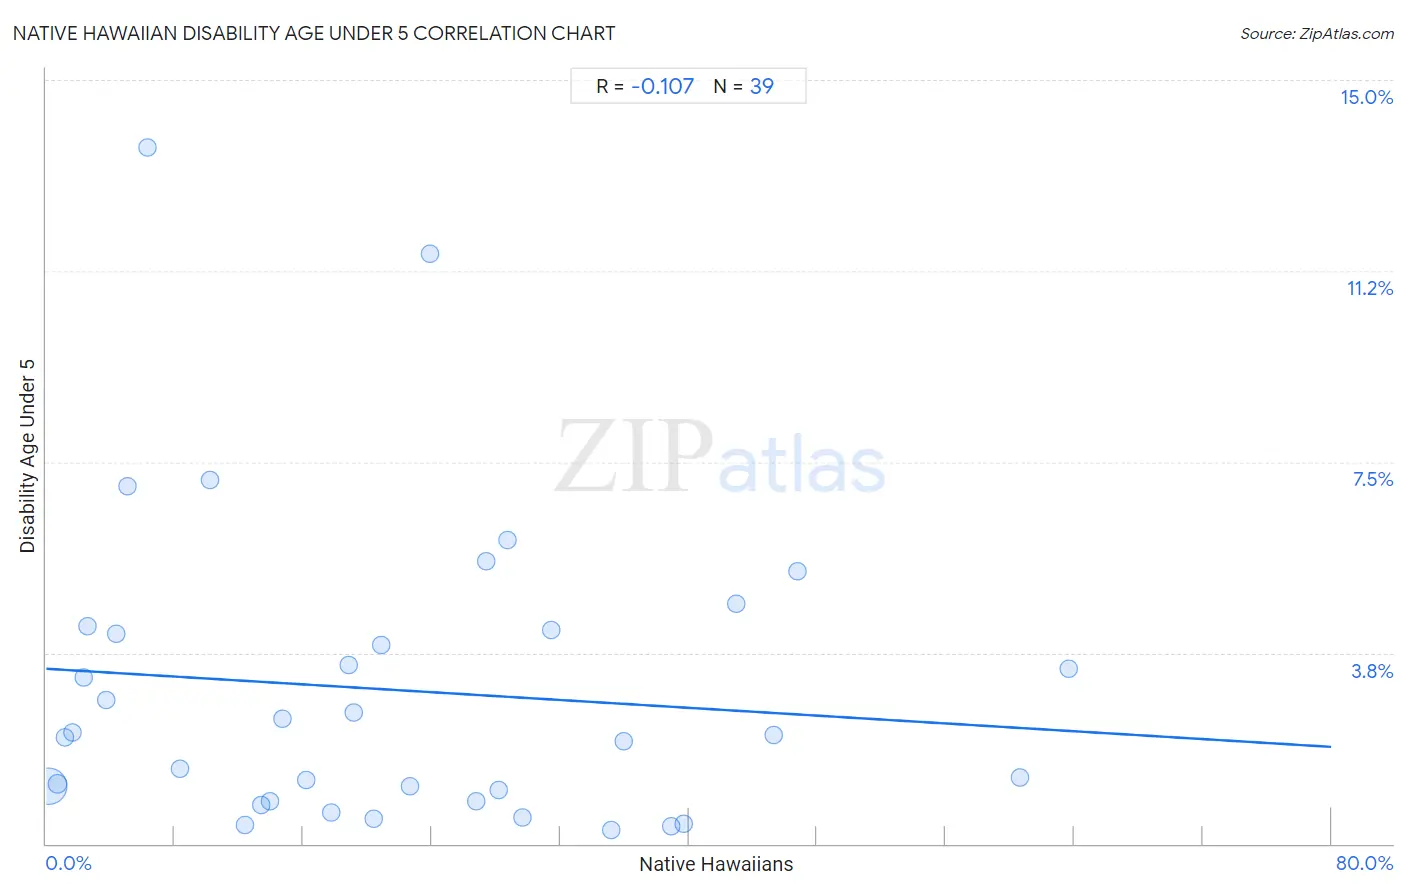
Native Hawaiian Disability Age Under 5 Correlation Chart

The statistical analysis conducted on geographies consisting of 196,669,282 people shows a poor negative correlation between the proportion of Native Hawaiians and percentage of population with a disability under the age of 5 in the United States with a correlation coefficient (R) of -0.107 and weighted average of 1.3%. On average, for every 1% (one percent) increase in Native Hawaiians within a typical geography, there is a decrease of 0.019% in percentage of population with a disability under the age of 5.
Native Hawaiian Disability Age Under 5
It is essential to understand that the correlation between the percentage of Native Hawaiians and percentage of population with a disability under the age of 5 does not imply a direct cause-and-effect relationship. It remains uncertain whether the presence of Native Hawaiians influences an upward or downward trend in the level of percentage of population with a disability under the age of 5 within an area, or if Native Hawaiians simply ended up residing in those areas with higher or lower levels of percentage of population with a disability under the age of 5 due to other factors.

Demographics Similar to Native Hawaiians by Disability Age Under 5

In terms of disability age under 5, the demographic groups most similar to Native Hawaiians are Immigrants from Austria (1.3%, a difference of 0.020%), Maltese (1.3%, a difference of 0.070%), Lumbee (1.3%, a difference of 0.15%), Spanish American Indian (1.3%, a difference of 0.18%), and Immigrants from Cameroon (1.4%, a difference of 0.53%).
DemographicsRating | RankDisability Age Under 5
Tongans
4.2
/100
|
#233
Tragic
1.3%
Pueblo
3.8
/100
|
#234
Tragic
1.3%
Central American Indians
3.6
/100
|
#235
Tragic
1.3%
South American Indians
3.3
/100
|
#236
Tragic
1.3%
Basques
3.0
/100
|
#237
Tragic
1.3%
Spanish American Indians
2.4
/100
|
#238
Tragic
1.3%
Immigrants from Austria
2.3
/100
|
#239
Tragic
1.3%
Native Hawaiians
2.2
/100
|
#240
Tragic
1.3%
Maltese
2.2
/100
|
#241
Tragic
1.3%
Lumbee
2.1
/100
|
#242
Tragic
1.3%
Immigrants from Cameroon
1.7
/100
|
#243
Tragic
1.4%
Spaniards
1.4
/100
|
#244
Tragic
1.4%
Potawatomi
1.1
/100
|
#245
Tragic
1.4%
Russians
1.0
/100
|
#246
Tragic
1.4%
Immigrants from England
1.0
/100
|
#247
Tragic
1.4%

Native Hawaiian Disability Age Under 5 Correlation Summary

MeasurementNative Hawaiian DataDisability Age Under 5 Data
Minimum0.12%0.27%
Maximum63.7%13.7%
Range63.6%13.4%
Mean21.6%3.0%
Median19.1%2.1%
Interquartile 25% (IQ1)6.3%0.83%
Interquartile 75% (IQ3)31.4%4.2%
Interquartile Range (IQR)25.2%3.4%
Standard Deviation (Sample)16.6%3.0%
Standard Deviation (Population)16.4%2.9%

Correlation Details

Native Hawaiian PercentileSample SizeDisability Age Under 5
[
0.0%
-
0.5%
]
0.12%
181,280,7501.1%
[
0.5%
-
1.0%
]
0.69%
11,213,1791.2%
[
1.0%
-
1.5%
]
1.14%
1,828,5502.1%
[
1.5%
-
2.0%
]
1.64%
687,0602.2%
[
2.0%
-
2.5%
]
2.37%
83,7603.3%
[
2.5%
-
3.0%
]
2.53%
34,4264.3%
[
3.5%
-
4.0%
]
3.74%
2,9452.8%
[
4.0%
-
4.5%
]
4.33%
6,9984.1%
[
5.0%
-
5.5%
]
5.07%
2,2877.0%
[
6.0%
-
6.5%
]
6.27%
1,58013.7%
[
8.0%
-
8.5%
]
8.36%
57,9381.5%
[
10.0%
-
10.5%
]
10.23%
7337.1%
[
12.0%
-
12.5%
]
12.41%
433,4580.36%
[
13.0%
-
13.5%
]
13.39%
95,1060.77%
[
13.5%
-
14.0%
]
13.91%
72,6050.83%
[
14.5%
-
15.0%
]
14.72%
47,4482.4%
[
16.0%
-
16.5%
]
16.21%
139,9301.2%
[
17.5%
-
18.0%
]
17.72%
38,6740.60%
[
18.5%
-
19.0%
]
18.82%
66,8433.5%
[
19.0%
-
19.5%
]
19.12%
60,2832.6%
[
20.0%
-
20.5%
]
20.38%
82,5040.49%
[
20.5%
-
21.0%
]
20.87%
27,4233.9%
[
22.5%
-
23.0%
]
22.64%
2,9021.1%
[
23.5%
-
24.0%
]
23.90%
2,06711.6%
[
26.5%
-
27.0%
]
26.80%
17,6040.83%
[
27.0%
-
27.5%
]
27.36%
47,2245.5%
[
28.0%
-
28.5%
]
28.13%
49,6231.1%
[
28.5%
-
29.0%
]
28.71%
6,4696.0%
[
29.5%
-
30.0%
]
29.65%
55,8880.52%
[
31.0%
-
31.5%
]
31.44%
4,6284.2%
[
35.0%
-
35.5%
]
35.21%
14,3100.27%
[
35.5%
-
36.0%
]
35.91%
22,7012.0%
[
38.5%
-
39.0%
]
38.95%
50,4530.35%
[
39.5%
-
40.0%
]
39.65%
47,6270.38%
[
42.5%
-
43.0%
]
42.99%
4,5554.7%
[
45.0%
-
45.5%
]
45.29%
10,0422.1%
[
46.5%
-
47.0%
]
46.76%
3,5935.3%
[
60.5%
-
61.0%
]
60.59%
51,3671.3%
[
63.5%
-
64.0%
]
63.68%
13,7493.4%