Immigrants from Ireland Disability Age Under 5
COMPARE
Immigrants from Ireland
Select to Compare
Disability Age Under 5
Immigrants from Ireland Disability Age Under 5
1.2%
DISABILITY | AGE UNDER 5
50.3/ 100
METRIC RATING
173rd/ 347
METRIC RANK
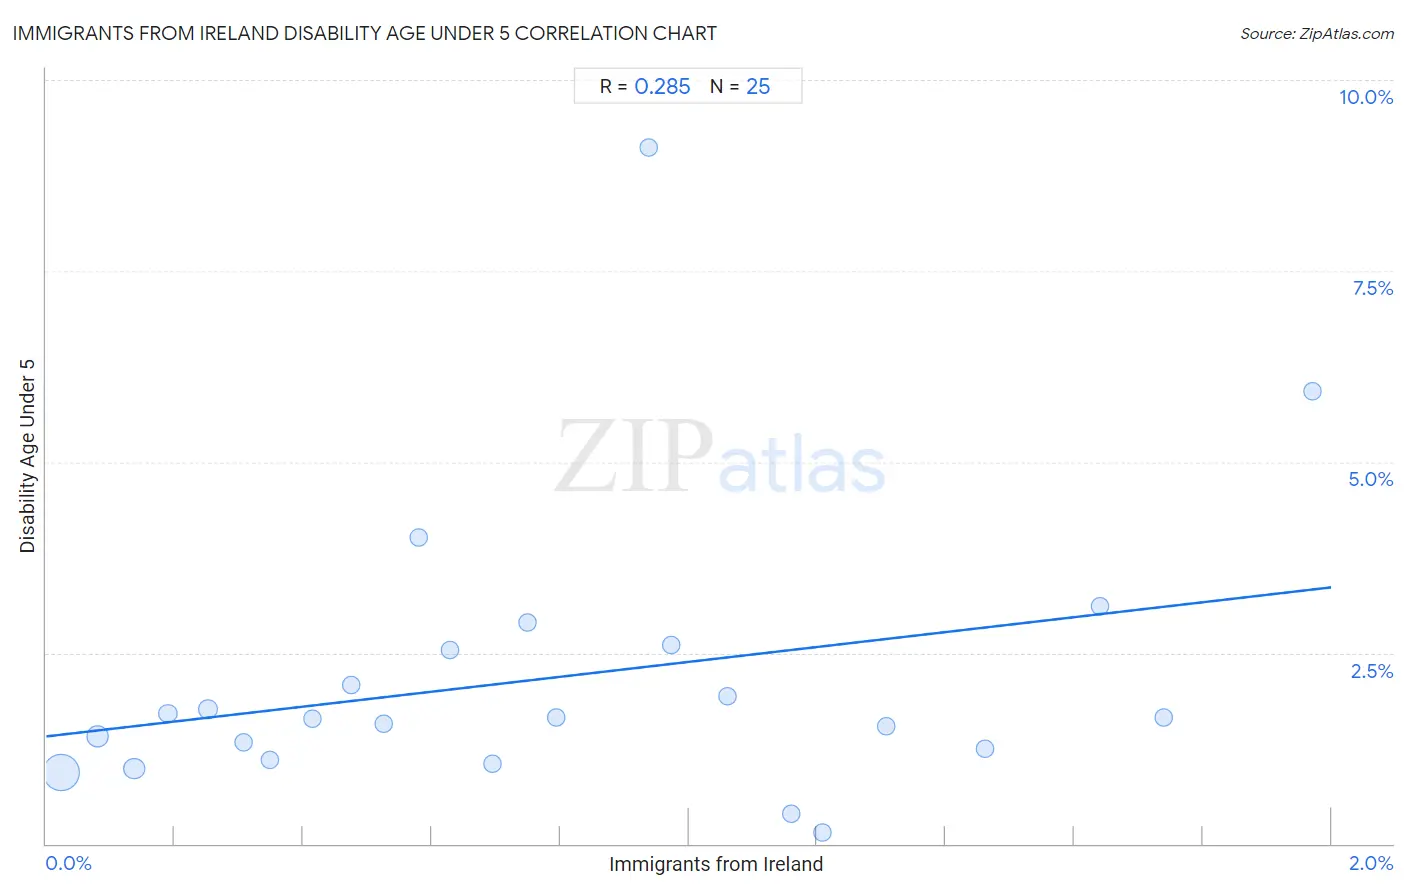
Immigrants from Ireland Disability Age Under 5 Correlation Chart
The statistical analysis conducted on geographies consisting of 143,988,066 people shows a weak positive correlation between the proportion of Immigrants from Ireland and percentage of population with a disability under the age of 5 in the United States with a correlation coefficient (R) of 0.285 and weighted average of 1.2%. On average, for every 1% (one percent) increase in Immigrants from Ireland within a typical geography, there is an increase of 0.98% in percentage of population with a disability under the age of 5.
It is essential to understand that the correlation between the percentage of Immigrants from Ireland and percentage of population with a disability under the age of 5 does not imply a direct cause-and-effect relationship. It remains uncertain whether the presence of Immigrants from Ireland influences an upward or downward trend in the level of percentage of population with a disability under the age of 5 within an area, or if Immigrants from Ireland simply ended up residing in those areas with higher or lower levels of percentage of population with a disability under the age of 5 due to other factors.
Demographics Similar to Immigrants from Ireland by Disability Age Under 5
In terms of disability age under 5, the demographic groups most similar to Immigrants from Ireland are Immigrants from Latvia (1.2%, a difference of 0.020%), Immigrants from Nigeria (1.2%, a difference of 0.030%), Crow (1.2%, a difference of 0.070%), Immigrants from Kenya (1.2%, a difference of 0.15%), and Comanche (1.2%, a difference of 0.25%).
| Demographics | Rating | Rank | Disability Age Under 5 |
| Immigrants from Central America | 61.4 /100 | #166 | Good 1.2% |
| Immigrants from Argentina | 60.2 /100 | #167 | Good 1.2% |
| Sierra Leoneans | 59.1 /100 | #168 | Average 1.2% |
| Immigrants from Uruguay | 59.0 /100 | #169 | Average 1.2% |
| Immigrants from Jamaica | 58.8 /100 | #170 | Average 1.2% |
| Guamanians/Chamorros | 57.8 /100 | #171 | Average 1.2% |
| Crow | 51.0 /100 | #172 | Average 1.2% |
| Immigrants from Ireland | 50.3 /100 | #173 | Average 1.2% |
| Immigrants from Latvia | 50.0 /100 | #174 | Average 1.2% |
| Immigrants from Nigeria | 50.0 /100 | #175 | Average 1.2% |
| Immigrants from Kenya | 48.6 /100 | #176 | Average 1.2% |
| Comanche | 47.5 /100 | #177 | Average 1.2% |
| Venezuelans | 47.1 /100 | #178 | Average 1.2% |
| Immigrants from Bahamas | 45.2 /100 | #179 | Average 1.2% |
| Immigrants from Mexico | 44.4 /100 | #180 | Average 1.2% |
Immigrants from Ireland Disability Age Under 5 Correlation Summary
| Measurement | Immigrants from Ireland Data | Disability Age Under 5 Data |
| Minimum | 0.023% | 0.14% |
| Maximum | 2.0% | 9.1% |
| Range | 1.9% | 9.0% |
| Mean | 0.79% | 2.2% |
| Median | 0.69% | 1.7% |
| Interquartile 25% (IQ1) | 0.33% | 1.2% |
| Interquartile 75% (IQ3) | 1.2% | 2.6% |
| Interquartile Range (IQR) | 0.86% | 1.4% |
| Standard Deviation (Sample) | 0.55% | 1.9% |
| Standard Deviation (Population) | 0.54% | 1.8% |
Correlation Details
| Immigrants from Ireland Percentile | Sample Size | Disability Age Under 5 |
[ 0.0% - 0.5% ] 0.023% | 101,474,886 | 0.93% |
[ 0.0% - 0.5% ] 0.080% | 19,016,724 | 1.4% |
[ 0.0% - 0.5% ] 0.14% | 14,639,783 | 0.98% |
[ 0.0% - 0.5% ] 0.19% | 2,777,754 | 1.7% |
[ 0.0% - 0.5% ] 0.25% | 1,683,235 | 1.8% |
[ 0.0% - 0.5% ] 0.31% | 1,556,140 | 1.3% |
[ 0.0% - 0.5% ] 0.35% | 1,275,194 | 1.1% |
[ 0.0% - 0.5% ] 0.42% | 392,395 | 1.6% |
[ 0.0% - 0.5% ] 0.48% | 129,108 | 2.1% |
[ 0.5% - 1.0% ] 0.52% | 101,781 | 1.6% |
[ 0.5% - 1.0% ] 0.58% | 192,468 | 4.0% |
[ 0.5% - 1.0% ] 0.63% | 137,850 | 2.5% |
[ 0.5% - 1.0% ] 0.69% | 82,214 | 1.0% |
[ 0.5% - 1.0% ] 0.75% | 92,048 | 2.9% |
[ 0.5% - 1.0% ] 0.79% | 2,896 | 1.7% |
[ 0.5% - 1.0% ] 0.94% | 6,937 | 9.1% |
[ 0.5% - 1.0% ] 0.97% | 47,106 | 2.6% |
[ 1.0% - 1.5% ] 1.06% | 34,076 | 1.9% |
[ 1.0% - 1.5% ] 1.16% | 30,418 | 0.39% |
[ 1.0% - 1.5% ] 1.21% | 235,918 | 0.14% |
[ 1.0% - 1.5% ] 1.31% | 20,273 | 1.5% |
[ 1.0% - 1.5% ] 1.46% | 26,488 | 1.3% |
[ 1.5% - 2.0% ] 1.64% | 6,098 | 3.1% |
[ 1.5% - 2.0% ] 1.74% | 21,506 | 1.7% |
[ 1.5% - 2.0% ] 1.97% | 4,770 | 5.9% |