Immigrants from Vietnam Disability Age Under 5
COMPARE
Immigrants from Vietnam
Select to Compare
Disability Age Under 5
Immigrants from Vietnam Disability Age Under 5
1.1%
DISABILITY | AGE UNDER 5
99.1/ 100
METRIC RATING
63rd/ 347
METRIC RANK
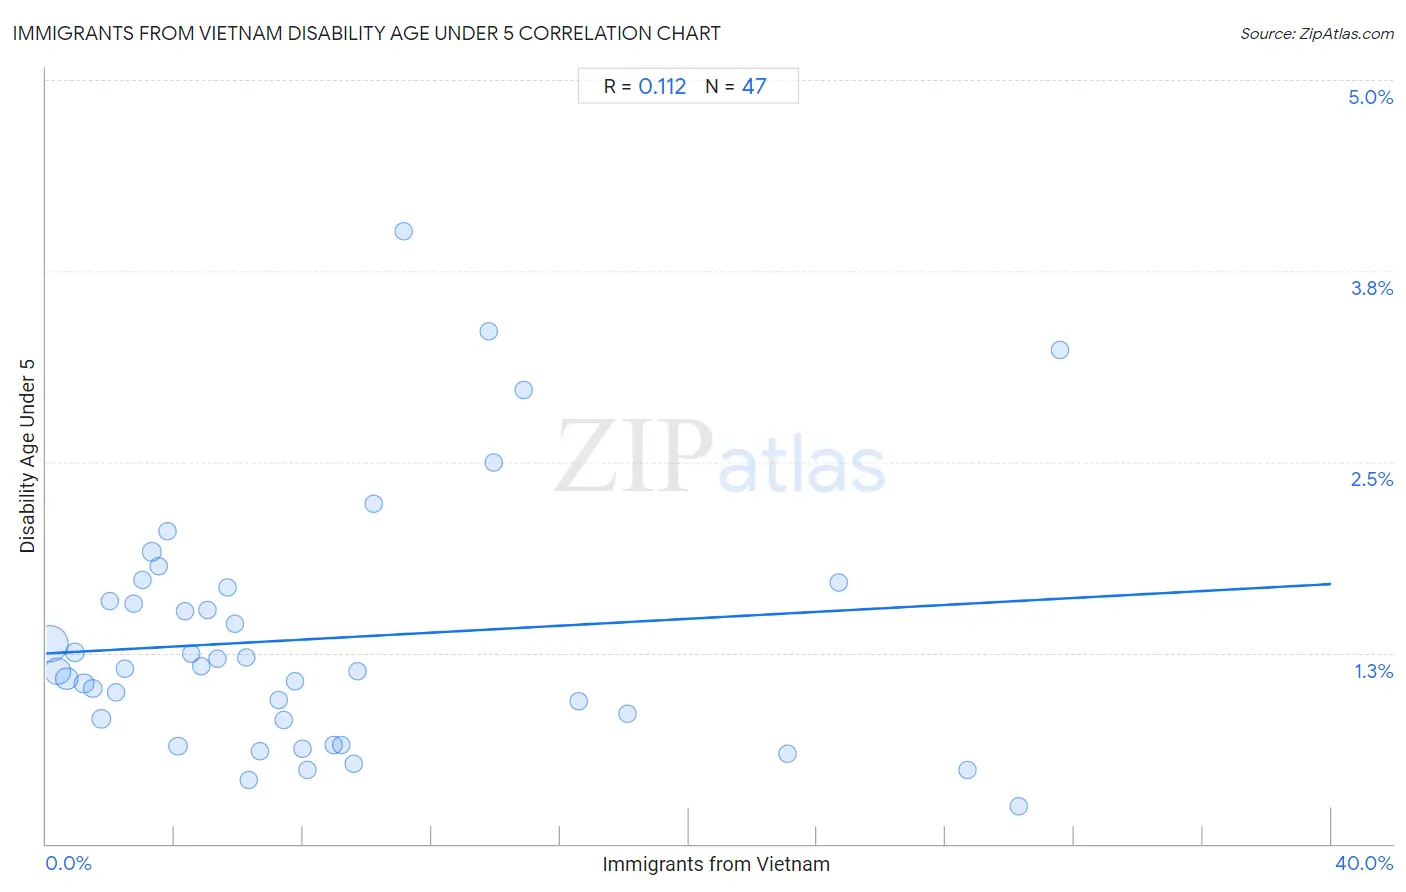
Immigrants from Vietnam Disability Age Under 5 Correlation Chart
The statistical analysis conducted on geographies consisting of 220,992,476 people shows a poor positive correlation between the proportion of Immigrants from Vietnam and percentage of population with a disability under the age of 5 in the United States with a correlation coefficient (R) of 0.112 and weighted average of 1.1%. On average, for every 1% (one percent) increase in Immigrants from Vietnam within a typical geography, there is an increase of 0.011% in percentage of population with a disability under the age of 5.
It is essential to understand that the correlation between the percentage of Immigrants from Vietnam and percentage of population with a disability under the age of 5 does not imply a direct cause-and-effect relationship. It remains uncertain whether the presence of Immigrants from Vietnam influences an upward or downward trend in the level of percentage of population with a disability under the age of 5 within an area, or if Immigrants from Vietnam simply ended up residing in those areas with higher or lower levels of percentage of population with a disability under the age of 5 due to other factors.
Demographics Similar to Immigrants from Vietnam by Disability Age Under 5
In terms of disability age under 5, the demographic groups most similar to Immigrants from Vietnam are Immigrants from Switzerland (1.1%, a difference of 0.11%), Immigrants from Ethiopia (1.1%, a difference of 0.12%), Immigrants from Western Asia (1.1%, a difference of 0.18%), Egyptian (1.1%, a difference of 0.46%), and Immigrants from Korea (1.1%, a difference of 0.80%).
| Demographics | Rating | Rank | Disability Age Under 5 |
| Ecuadorians | 99.5 /100 | #56 | Exceptional 1.1% |
| Assyrians/Chaldeans/Syriacs | 99.5 /100 | #57 | Exceptional 1.1% |
| Immigrants from Egypt | 99.4 /100 | #58 | Exceptional 1.1% |
| Immigrants from Malaysia | 99.4 /100 | #59 | Exceptional 1.1% |
| Immigrants from Western Asia | 99.2 /100 | #60 | Exceptional 1.1% |
| Immigrants from Ethiopia | 99.2 /100 | #61 | Exceptional 1.1% |
| Immigrants from Switzerland | 99.2 /100 | #62 | Exceptional 1.1% |
| Immigrants from Vietnam | 99.1 /100 | #63 | Exceptional 1.1% |
| Egyptians | 98.9 /100 | #64 | Exceptional 1.1% |
| Immigrants from Korea | 98.8 /100 | #65 | Exceptional 1.1% |
| Immigrants from Indonesia | 98.7 /100 | #66 | Exceptional 1.1% |
| Immigrants from Belize | 98.7 /100 | #67 | Exceptional 1.1% |
| South Africans | 98.7 /100 | #68 | Exceptional 1.1% |
| Israelis | 98.7 /100 | #69 | Exceptional 1.1% |
| Immigrants from Ecuador | 98.6 /100 | #70 | Exceptional 1.1% |
Immigrants from Vietnam Disability Age Under 5 Correlation Summary
| Measurement | Immigrants from Vietnam Data | Disability Age Under 5 Data |
| Minimum | 0.12% | 0.25% |
| Maximum | 31.6% | 4.0% |
| Range | 31.4% | 3.8% |
| Mean | 8.5% | 1.3% |
| Median | 6.2% | 1.1% |
| Interquartile 25% (IQ1) | 3.0% | 0.81% |
| Interquartile 75% (IQ3) | 10.2% | 1.7% |
| Interquartile Range (IQR) | 7.2% | 0.87% |
| Standard Deviation (Sample) | 8.0% | 0.81% |
| Standard Deviation (Population) | 7.9% | 0.80% |
Correlation Details
| Immigrants from Vietnam Percentile | Sample Size | Disability Age Under 5 |
[ 0.0% - 0.5% ] 0.12% | 106,535,095 | 1.3% |
[ 0.0% - 0.5% ] 0.37% | 49,591,670 | 1.1% |
[ 0.5% - 1.0% ] 0.64% | 22,509,092 | 1.1% |
[ 0.5% - 1.0% ] 0.90% | 8,481,971 | 1.3% |
[ 1.0% - 1.5% ] 1.19% | 10,654,523 | 1.0% |
[ 1.0% - 1.5% ] 1.44% | 3,707,029 | 1.0% |
[ 1.5% - 2.0% ] 1.73% | 6,171,276 | 0.82% |
[ 1.5% - 2.0% ] 1.97% | 1,994,041 | 1.6% |
[ 2.0% - 2.5% ] 2.17% | 1,514,158 | 0.99% |
[ 2.0% - 2.5% ] 2.46% | 1,138,918 | 1.1% |
[ 2.5% - 3.0% ] 2.73% | 878,334 | 1.6% |
[ 2.5% - 3.0% ] 3.00% | 559,310 | 1.7% |
[ 3.0% - 3.5% ] 3.29% | 675,689 | 1.9% |
[ 3.5% - 4.0% ] 3.51% | 642,907 | 1.8% |
[ 3.5% - 4.0% ] 3.76% | 264,862 | 2.0% |
[ 4.0% - 4.5% ] 4.10% | 671,472 | 0.64% |
[ 4.0% - 4.5% ] 4.34% | 345,309 | 1.5% |
[ 4.5% - 5.0% ] 4.52% | 168,622 | 1.2% |
[ 4.5% - 5.0% ] 4.84% | 245,205 | 1.2% |
[ 5.0% - 5.5% ] 5.00% | 132,247 | 1.5% |
[ 5.0% - 5.5% ] 5.32% | 438,290 | 1.2% |
[ 5.5% - 6.0% ] 5.64% | 156,464 | 1.7% |
[ 5.5% - 6.0% ] 5.87% | 154,795 | 1.4% |
[ 6.0% - 6.5% ] 6.22% | 165,775 | 1.2% |
[ 6.0% - 6.5% ] 6.29% | 42,330 | 0.42% |
[ 6.5% - 7.0% ] 6.64% | 188,982 | 0.60% |
[ 7.0% - 7.5% ] 7.24% | 128,814 | 0.94% |
[ 7.0% - 7.5% ] 7.41% | 90,072 | 0.81% |
[ 7.5% - 8.0% ] 7.74% | 63,757 | 1.1% |
[ 7.5% - 8.0% ] 7.96% | 264,401 | 0.62% |
[ 8.0% - 8.5% ] 8.12% | 1,060,064 | 0.48% |
[ 8.5% - 9.0% ] 8.96% | 143,036 | 0.65% |
[ 9.0% - 9.5% ] 9.19% | 158,485 | 0.65% |
[ 9.5% - 10.0% ] 9.58% | 108,682 | 0.53% |
[ 9.5% - 10.0% ] 9.70% | 84,700 | 1.1% |
[ 10.0% - 10.5% ] 10.21% | 61,593 | 2.2% |
[ 11.0% - 11.5% ] 11.11% | 16,827 | 4.0% |
[ 13.5% - 14.0% ] 13.77% | 31,102 | 3.4% |
[ 13.5% - 14.0% ] 13.95% | 38,271 | 2.5% |
[ 14.5% - 15.0% ] 14.88% | 142,257 | 3.0% |
[ 16.5% - 17.0% ] 16.59% | 52,555 | 0.93% |
[ 18.0% - 18.5% ] 18.08% | 59,761 | 0.85% |
[ 23.0% - 23.5% ] 23.07% | 171,637 | 0.59% |
[ 24.5% - 25.0% ] 24.66% | 36,657 | 1.7% |
[ 28.5% - 29.0% ] 28.68% | 47,549 | 0.48% |
[ 30.0% - 30.5% ] 30.26% | 181,268 | 0.25% |
[ 31.5% - 32.0% ] 31.56% | 22,622 | 3.2% |