South American Female Disability
COMPARE
South American
Select to Compare
Female Disability
South American Female Disability
11.4%
DISABILITY | FEMALES
99.9/ 100
METRIC RATING
57th/ 347
METRIC RANK
South American Female Disability Correlation Chart
The statistical analysis conducted on geographies consisting of 494,047,696 people shows a moderate negative correlation between the proportion of South Americans and percentage of females with a disability in the United States with a correlation coefficient (R) of -0.423 and weighted average of 11.4%. On average, for every 1% (one percent) increase in South Americans within a typical geography, there is a decrease of 0.093% in percentage of females with a disability.
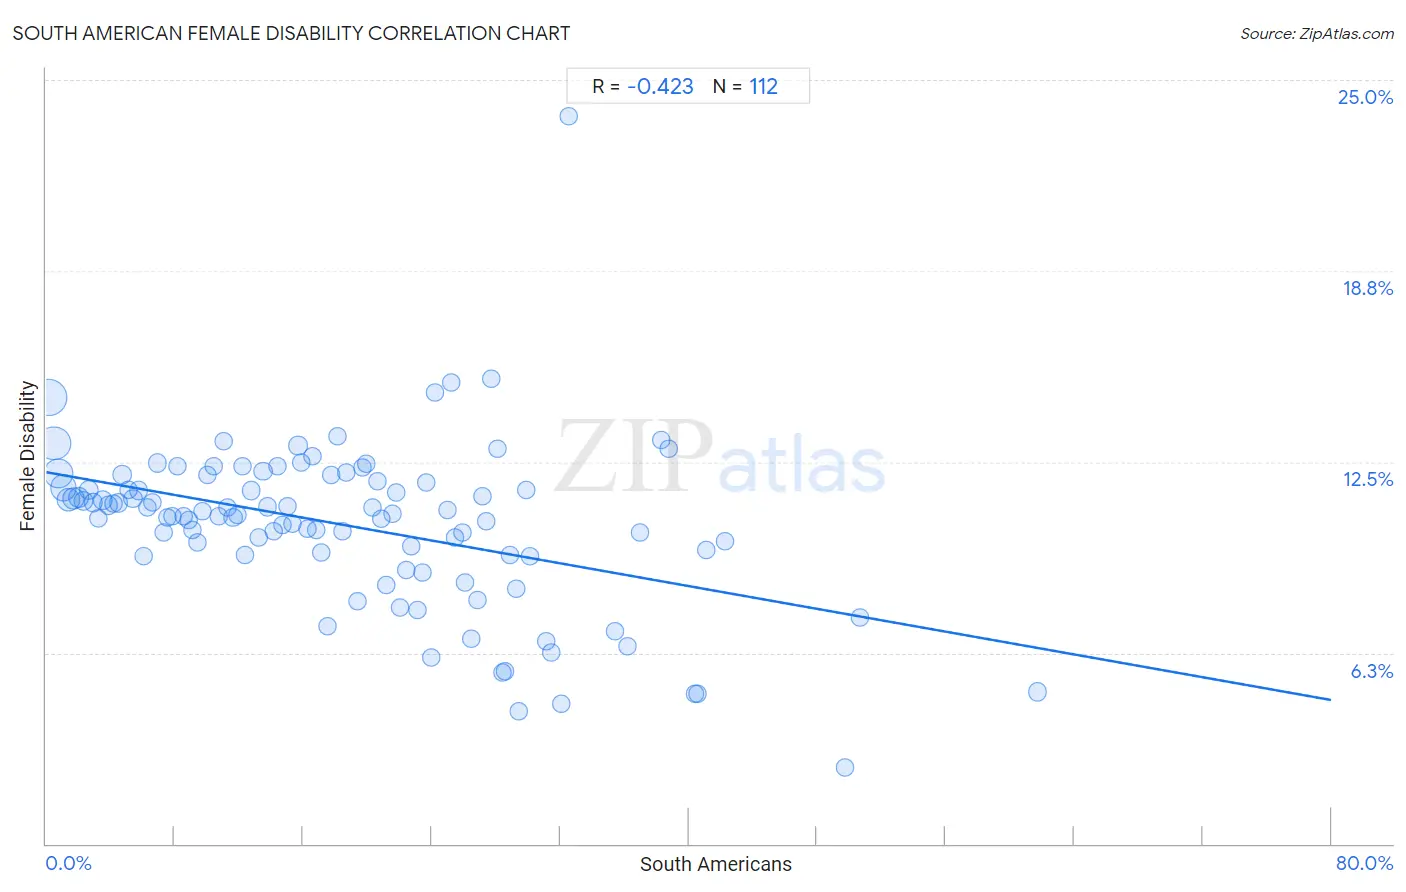
It is essential to understand that the correlation between the percentage of South Americans and percentage of females with a disability does not imply a direct cause-and-effect relationship. It remains uncertain whether the presence of South Americans influences an upward or downward trend in the level of percentage of females with a disability within an area, or if South Americans simply ended up residing in those areas with higher or lower levels of percentage of females with a disability due to other factors.
Demographics Similar to South Americans by Female Disability
In terms of female disability, the demographic groups most similar to South Americans are Laotian (11.4%, a difference of 0.020%), Taiwanese (11.4%, a difference of 0.080%), Immigrants from Spain (11.4%, a difference of 0.15%), Immigrants from Bulgaria (11.4%, a difference of 0.27%), and Bulgarian (11.3%, a difference of 0.31%).
| Demographics | Rating | Rank | Female Disability |
| Inupiat | 100.0 /100 | #50 | Exceptional 11.3% |
| Immigrants from Belgium | 100.0 /100 | #51 | Exceptional 11.3% |
| Immigrants from Peru | 99.9 /100 | #52 | Exceptional 11.3% |
| Immigrants from Saudi Arabia | 99.9 /100 | #53 | Exceptional 11.3% |
| Peruvians | 99.9 /100 | #54 | Exceptional 11.3% |
| Bulgarians | 99.9 /100 | #55 | Exceptional 11.3% |
| Taiwanese | 99.9 /100 | #56 | Exceptional 11.4% |
| South Americans | 99.9 /100 | #57 | Exceptional 11.4% |
| Laotians | 99.9 /100 | #58 | Exceptional 11.4% |
| Immigrants from Spain | 99.9 /100 | #59 | Exceptional 11.4% |
| Immigrants from Bulgaria | 99.9 /100 | #60 | Exceptional 11.4% |
| Immigrants from France | 99.9 /100 | #61 | Exceptional 11.4% |
| Sri Lankans | 99.9 /100 | #62 | Exceptional 11.4% |
| Immigrants from Colombia | 99.9 /100 | #63 | Exceptional 11.4% |
| Immigrants from El Salvador | 99.9 /100 | #64 | Exceptional 11.4% |
South American Female Disability Correlation Summary
| Measurement | South American Data | Female Disability Data |
| Minimum | 0.16% | 2.5% |
| Maximum | 61.7% | 23.8% |
| Range | 61.6% | 21.3% |
| Mean | 18.6% | 10.4% |
| Median | 17.3% | 10.8% |
| Interquartile 25% (IQ1) | 8.7% | 9.5% |
| Interquartile 75% (IQ3) | 26.7% | 11.9% |
| Interquartile Range (IQR) | 18.0% | 2.4% |
| Standard Deviation (Sample) | 12.4% | 2.7% |
| Standard Deviation (Population) | 12.3% | 2.7% |
Correlation Details
| South American Percentile | Sample Size | Female Disability |
[ 0.0% - 0.5% ] 0.16% | 114,438,778 | 14.6% |
[ 0.0% - 0.5% ] 0.46% | 97,261,523 | 13.1% |
[ 0.5% - 1.0% ] 0.76% | 72,391,905 | 12.1% |
[ 1.0% - 1.5% ] 1.08% | 49,645,394 | 11.7% |
[ 1.0% - 1.5% ] 1.39% | 34,158,480 | 11.3% |
[ 1.5% - 2.0% ] 1.70% | 26,224,158 | 11.3% |
[ 2.0% - 2.5% ] 2.01% | 16,247,270 | 11.3% |
[ 2.0% - 2.5% ] 2.30% | 11,532,884 | 11.2% |
[ 2.5% - 3.0% ] 2.62% | 7,298,331 | 11.6% |
[ 2.5% - 3.0% ] 2.94% | 6,047,361 | 11.2% |
[ 3.0% - 3.5% ] 3.24% | 4,682,893 | 10.7% |
[ 3.5% - 4.0% ] 3.54% | 5,187,746 | 11.3% |
[ 3.5% - 4.0% ] 3.87% | 3,831,334 | 11.1% |
[ 4.0% - 4.5% ] 4.18% | 2,956,588 | 11.1% |
[ 4.0% - 4.5% ] 4.49% | 2,494,130 | 11.2% |
[ 4.5% - 5.0% ] 4.75% | 11,230,437 | 12.1% |
[ 5.0% - 5.5% ] 5.12% | 2,536,148 | 11.6% |
[ 5.0% - 5.5% ] 5.39% | 1,735,878 | 11.3% |
[ 5.5% - 6.0% ] 5.72% | 1,895,498 | 11.6% |
[ 6.0% - 6.5% ] 6.03% | 1,519,406 | 9.4% |
[ 6.0% - 6.5% ] 6.32% | 1,142,128 | 11.0% |
[ 6.5% - 7.0% ] 6.63% | 906,398 | 11.2% |
[ 6.5% - 7.0% ] 6.93% | 1,424,055 | 12.5% |
[ 7.0% - 7.5% ] 7.29% | 716,763 | 10.2% |
[ 7.5% - 8.0% ] 7.56% | 852,568 | 10.7% |
[ 7.5% - 8.0% ] 7.87% | 609,820 | 10.7% |
[ 8.0% - 8.5% ] 8.17% | 729,873 | 12.4% |
[ 8.5% - 9.0% ] 8.53% | 773,485 | 10.7% |
[ 8.5% - 9.0% ] 8.85% | 460,827 | 10.6% |
[ 9.0% - 9.5% ] 9.12% | 549,236 | 10.3% |
[ 9.0% - 9.5% ] 9.43% | 765,467 | 9.9% |
[ 9.5% - 10.0% ] 9.71% | 333,411 | 10.9% |
[ 10.0% - 10.5% ] 10.03% | 521,565 | 12.1% |
[ 10.0% - 10.5% ] 10.40% | 323,377 | 12.4% |
[ 10.5% - 11.0% ] 10.71% | 353,881 | 10.7% |
[ 11.0% - 11.5% ] 11.07% | 750,665 | 13.2% |
[ 11.0% - 11.5% ] 11.29% | 201,930 | 11.0% |
[ 11.5% - 12.0% ] 11.63% | 349,117 | 10.7% |
[ 11.5% - 12.0% ] 11.89% | 690,878 | 10.8% |
[ 12.0% - 12.5% ] 12.19% | 156,662 | 12.3% |
[ 12.0% - 12.5% ] 12.41% | 280,842 | 9.4% |
[ 12.5% - 13.0% ] 12.76% | 806,796 | 11.6% |
[ 13.0% - 13.5% ] 13.20% | 406,875 | 10.0% |
[ 13.5% - 14.0% ] 13.50% | 191,017 | 12.2% |
[ 13.5% - 14.0% ] 13.76% | 441,449 | 11.0% |
[ 14.0% - 14.5% ] 14.14% | 325,844 | 10.2% |
[ 14.0% - 14.5% ] 14.42% | 221,791 | 12.4% |
[ 14.5% - 15.0% ] 14.69% | 204,687 | 10.4% |
[ 14.5% - 15.0% ] 14.99% | 234,613 | 11.0% |
[ 15.0% - 15.5% ] 15.33% | 406,294 | 10.5% |
[ 15.5% - 16.0% ] 15.68% | 266,981 | 13.0% |
[ 15.5% - 16.0% ] 15.89% | 187,486 | 12.5% |
[ 16.0% - 16.5% ] 16.26% | 312,081 | 10.3% |
[ 16.5% - 17.0% ] 16.54% | 242,654 | 12.7% |
[ 16.5% - 17.0% ] 16.83% | 150,168 | 10.3% |
[ 17.0% - 17.5% ] 17.14% | 89,321 | 9.5% |
[ 17.5% - 18.0% ] 17.51% | 20,378 | 7.1% |
[ 17.5% - 18.0% ] 17.77% | 240,694 | 12.1% |
[ 18.0% - 18.5% ] 18.10% | 85,976 | 13.3% |
[ 18.0% - 18.5% ] 18.44% | 87,879 | 10.2% |
[ 18.5% - 19.0% ] 18.69% | 40,999 | 12.1% |
[ 19.0% - 19.5% ] 19.39% | 111,443 | 7.9% |
[ 19.5% - 20.0% ] 19.70% | 85,790 | 12.3% |
[ 19.5% - 20.0% ] 19.96% | 147,206 | 12.4% |
[ 20.0% - 20.5% ] 20.33% | 22,724 | 11.0% |
[ 20.5% - 21.0% ] 20.60% | 71,060 | 11.9% |
[ 20.5% - 21.0% ] 20.84% | 158,259 | 10.6% |
[ 21.0% - 21.5% ] 21.17% | 109,891 | 8.5% |
[ 21.5% - 22.0% ] 21.54% | 31,140 | 10.8% |
[ 21.5% - 22.0% ] 21.81% | 240,443 | 11.5% |
[ 22.0% - 22.5% ] 22.04% | 57,533 | 7.7% |
[ 22.0% - 22.5% ] 22.41% | 104,960 | 9.0% |
[ 22.5% - 23.0% ] 22.72% | 10,396 | 9.7% |
[ 23.0% - 23.5% ] 23.10% | 64,260 | 7.7% |
[ 23.0% - 23.5% ] 23.39% | 174,733 | 8.9% |
[ 23.5% - 24.0% ] 23.68% | 231,078 | 11.8% |
[ 23.5% - 24.0% ] 23.96% | 59,843 | 6.1% |
[ 24.0% - 24.5% ] 24.18% | 8,718 | 14.8% |
[ 24.5% - 25.0% ] 24.95% | 20,760 | 10.9% |
[ 25.0% - 25.5% ] 25.23% | 5,164 | 15.1% |
[ 25.0% - 25.5% ] 25.42% | 101,739 | 10.0% |
[ 25.5% - 26.0% ] 25.90% | 35,967 | 10.2% |
[ 26.0% - 26.5% ] 26.05% | 56,757 | 8.6% |
[ 26.0% - 26.5% ] 26.50% | 21,935 | 6.7% |
[ 26.5% - 27.0% ] 26.89% | 89,647 | 8.0% |
[ 27.0% - 27.5% ] 27.16% | 42,956 | 11.4% |
[ 27.0% - 27.5% ] 27.42% | 44,878 | 10.6% |
[ 27.5% - 28.0% ] 27.69% | 89,577 | 15.2% |
[ 28.0% - 28.5% ] 28.08% | 67,090 | 12.9% |
[ 28.0% - 28.5% ] 28.38% | 458 | 5.6% |
[ 28.5% - 29.0% ] 28.57% | 20,971 | 5.6% |
[ 28.5% - 29.0% ] 28.90% | 80,522 | 9.5% |
[ 29.0% - 29.5% ] 29.27% | 26,364 | 8.4% |
[ 29.0% - 29.5% ] 29.41% | 22,540 | 4.3% |
[ 29.5% - 30.0% ] 29.84% | 112,750 | 11.6% |
[ 30.0% - 30.5% ] 30.10% | 23,734 | 9.4% |
[ 31.0% - 31.5% ] 31.13% | 11,069 | 6.6% |
[ 31.0% - 31.5% ] 31.40% | 15,732 | 6.3% |
[ 32.0% - 32.5% ] 32.05% | 2,811 | 4.6% |
[ 32.5% - 33.0% ] 32.56% | 43 | 23.8% |
[ 35.0% - 35.5% ] 35.42% | 68,029 | 7.0% |
[ 36.0% - 36.5% ] 36.16% | 31,514 | 6.5% |
[ 36.5% - 37.0% ] 36.95% | 249 | 10.2% |
[ 38.0% - 38.5% ] 38.27% | 4,656 | 13.2% |
[ 38.5% - 39.0% ] 38.73% | 1,761 | 12.9% |
[ 40.0% - 40.5% ] 40.36% | 14,639 | 4.9% |
[ 40.5% - 41.0% ] 40.54% | 14,572 | 4.9% |
[ 41.0% - 41.5% ] 41.13% | 5,843 | 9.6% |
[ 42.0% - 42.5% ] 42.26% | 6,186 | 9.9% |
[ 49.5% - 50.0% ] 49.76% | 1,873 | 2.5% |
[ 50.5% - 51.0% ] 50.63% | 2,718 | 7.4% |
[ 61.5% - 62.0% ] 61.73% | 139,642 | 5.0% |