Ottawa 2 or more Vehicles in Household

COMPARE

Ottawa
Race
Ancestry
AfghanAfricanAlaska NativeAlaskan AthabascanAlbanianAleutAlsatianAmericanApacheArabArapahoArgentineanArmenianAssyrian/Chaldean/SyriacAustralianAustrianBahamianBangladeshiBarbadianBasqueBelgianBelizeanBermudanBhutaneseBlackfeetBolivianBrazilianBritishBritish West IndianBulgarianBurmeseCajunCambodianCanadianCape VerdeanCarpatho RusynCelticCentral AmericanCentral American IndianCherokeeCheyenneChickasawChileanChineseChippewaChoctawColombianColvilleComancheCosta RicanCreeCreekCroatianCrowCubanCypriotCzechCzechoslovakianDanishDelawareDominicanDutchDutch West IndianEastern EuropeanEcuadorianEgyptianEnglishEstonianEthiopianEuropeanFijianFilipinoFinnishFrenchFrench American IndianFrench CanadianGermanGerman RussianGhanaianGreekGuamanian/ChamorroGuatemalanGuyaneseHaitianHmongHonduranHopiHoumaHungarianIcelanderIndian (Asian)IndonesianInupiatIranianIraqiIrishIroquoisIsraeliItalianJamaicanJapaneseJordanianKenyanKiowaKoreanLaotianLatvianLebaneseLiberianLithuanianLumbeeLuxembourgerMacedonianMalaysianMalteseMarshalleseMenomineeMexicanMexican American IndianMongolianMoroccanNative HawaiianNavajoNepaleseNew ZealanderNicaraguanNigerianNorthern EuropeanNorwegianOkinawanOsageOttawaPaiutePakistaniPalestinianPanamanianParaguayanPennsylvania GermanPeruvianPimaPolishPortuguesePotawatomiPuebloPuerto RicanPuget Sound SalishRomanianRussianSalvadoranSamoanScandinavianScotch-IrishScottishSeminoleSenegaleseSerbianShoshoneSierra LeoneanSiouxSlavicSlovakSloveneSomaliSouth AfricanSouth AmericanSouth American IndianSoviet UnionSpaniardSpanishSpanish AmericanSpanish American IndianSri LankanSubsaharan AfricanSudaneseSwedishSwissSyrianTaiwaneseThaiTlingit-HaidaTohono O'OdhamTonganTrinidadian and TobagonianTsimshianTurkishU.S. Virgin IslanderUgandanUkrainianUruguayanUteVenezuelanVietnameseWelshWest IndianYakamaYaquiYugoslavianYumanYup'ikZimbabwean
Immigration
NonimmigrantsImmigrantsAfghanistanAfricaAlbaniaArgentinaArmeniaAsiaAustraliaAustriaBahamasBangladeshBarbadosBelarusBelgiumBelizeBoliviaBosnia and HerzegovinaBrazilBulgariaBurma/MyanmarCabo VerdeCambodiaCameroonCanadaCaribbeanCentral AmericaChileChinaColombiaCongoCosta RicaCroatiaCubaCzechoslovakiaDenmarkDominicaDominican RepublicEastern AfricaEastern AsiaEastern EuropeEcuadorEgyptEl SalvadorEnglandEritreaEthiopiaEuropeFijiFranceGermanyGhanaGreeceGrenadaGuatemalaGuyanaHaitiHondurasHong KongHungaryIndiaIndonesiaIranIraqIrelandIsraelItalyJamaicaJapanJordanKazakhstanKenyaKoreaKuwaitLaosLatin AmericaLatviaLebanonLiberiaLithuaniaMalaysiaMexicoMicronesiaMiddle AfricaMoldovaMoroccoNepalNetherlandsNicaraguaNigeriaNorth AmericaNorth MacedoniaNorthern AfricaNorthern EuropeNorwayOceaniaPakistanPanamaPeruPhilippinesPolandPortugalRomaniaRussiaSaudi ArabiaScotlandSenegalSerbiaSierra LeoneSingaporeSomaliaSouth AfricaSouth AmericaSouth Central AsiaSouth Eastern AsiaSouthern EuropeSpainSri LankaSt. Vincent and the GrenadinesSudanSwedenSwitzerlandSyriaTaiwanThailandTrinidad and TobagoTurkeyUgandaUkraineUruguayUzbekistanVenezuelaVietnamWest IndiesWestern AfricaWestern AsiaWestern EuropeYemenZaireZimbabweAzores
Select to Compare
Race
Ancestry
AfghanAfricanAlaska NativeAlaskan AthabascanAlbanianAleutAlsatianAmericanApacheArabArapahoArgentineanArmenianAssyrian/Chaldean/SyriacAustralianAustrianBahamianBangladeshiBarbadianBasqueBelgianBelizeanBermudanBhutaneseBlackfeetBolivianBrazilianBritishBritish West IndianBulgarianBurmeseCajunCambodianCanadianCape VerdeanCarpatho RusynCelticCentral AmericanCentral American IndianCherokeeCheyenneChickasawChileanChineseChippewaChoctawColombianColvilleComancheCosta RicanCreeCreekCroatianCrowCubanCypriotCzechCzechoslovakianDanishDelawareDominicanDutchDutch West IndianEastern EuropeanEcuadorianEgyptianEnglishEstonianEthiopianEuropeanFijianFilipinoFinnishFrenchFrench American IndianFrench CanadianGermanGerman RussianGhanaianGreekGuamanian/ChamorroGuatemalanGuyaneseHaitianHmongHonduranHopiHoumaHungarianIcelanderIndian (Asian)IndonesianInupiatIranianIraqiIrishIroquoisIsraeliItalianJamaicanJapaneseJordanianKenyanKiowaKoreanLaotianLatvianLebaneseLiberianLithuanianLumbeeLuxembourgerMacedonianMalaysianMalteseMarshalleseMenomineeMexicanMexican American IndianMongolianMoroccanNative HawaiianNavajoNepaleseNew ZealanderNicaraguanNigerianNorthern EuropeanNorwegianOkinawanOsagePaiutePakistaniPalestinianPanamanianParaguayanPennsylvania GermanPeruvianPimaPolishPortuguesePotawatomiPuebloPuerto RicanPuget Sound SalishRomanianRussianSalvadoranSamoanScandinavianScotch-IrishScottishSeminoleSenegaleseSerbianShoshoneSierra LeoneanSiouxSlavicSlovakSloveneSomaliSouth AfricanSouth AmericanSouth American IndianSoviet UnionSpaniardSpanishSpanish AmericanSpanish American IndianSri LankanSubsaharan AfricanSudaneseSwedishSwissSyrianTaiwaneseThaiTlingit-HaidaTohono O'OdhamTonganTrinidadian and TobagonianTsimshianTurkishU.S. Virgin IslanderUgandanUkrainianUruguayanUteVenezuelanVietnameseWelshWest IndianYakamaYaquiYugoslavianYumanYup'ikZimbabwean
Immigration
NonimmigrantsImmigrantsAfghanistanAfricaAlbaniaArgentinaArmeniaAsiaAustraliaAustriaBahamasBangladeshBarbadosBelarusBelgiumBelizeBoliviaBosnia and HerzegovinaBrazilBulgariaBurma/MyanmarCabo VerdeCambodiaCameroonCanadaCaribbeanCentral AmericaChileChinaColombiaCongoCosta RicaCroatiaCubaCzechoslovakiaDenmarkDominicaDominican RepublicEastern AfricaEastern AsiaEastern EuropeEcuadorEgyptEl SalvadorEnglandEritreaEthiopiaEuropeFijiFranceGermanyGhanaGreeceGrenadaGuatemalaGuyanaHaitiHondurasHong KongHungaryIndiaIndonesiaIranIraqIrelandIsraelItalyJamaicaJapanJordanKazakhstanKenyaKoreaKuwaitLaosLatin AmericaLatviaLebanonLiberiaLithuaniaMalaysiaMexicoMicronesiaMiddle AfricaMoldovaMoroccoNepalNetherlandsNicaraguaNigeriaNorth AmericaNorth MacedoniaNorthern AfricaNorthern EuropeNorwayOceaniaPakistanPanamaPeruPhilippinesPolandPortugalRomaniaRussiaSaudi ArabiaScotlandSenegalSerbiaSierra LeoneSingaporeSomaliaSouth AfricaSouth AmericaSouth Central AsiaSouth Eastern AsiaSouthern EuropeSpainSri LankaSt. Vincent and the GrenadinesSudanSwedenSwitzerlandSyriaTaiwanThailandTrinidad and TobagoTurkeyUgandaUkraineUruguayUzbekistanVenezuelaVietnamWest IndiesWestern AfricaWestern AsiaWestern EuropeYemenZaireZimbabweAzores
2 or more Vehicles in Household
Income
Poverty
Unemployment
Labor Participation
Family Structure
Vehicle Availability
Education Level
Disability

Ottawa 2 or more Vehicles in Household
Exceptional

57.9%
2+ VEHICLES AVAILABLE
99.0/ 100
METRIC RATING
93rd/ 347
METRIC RANK

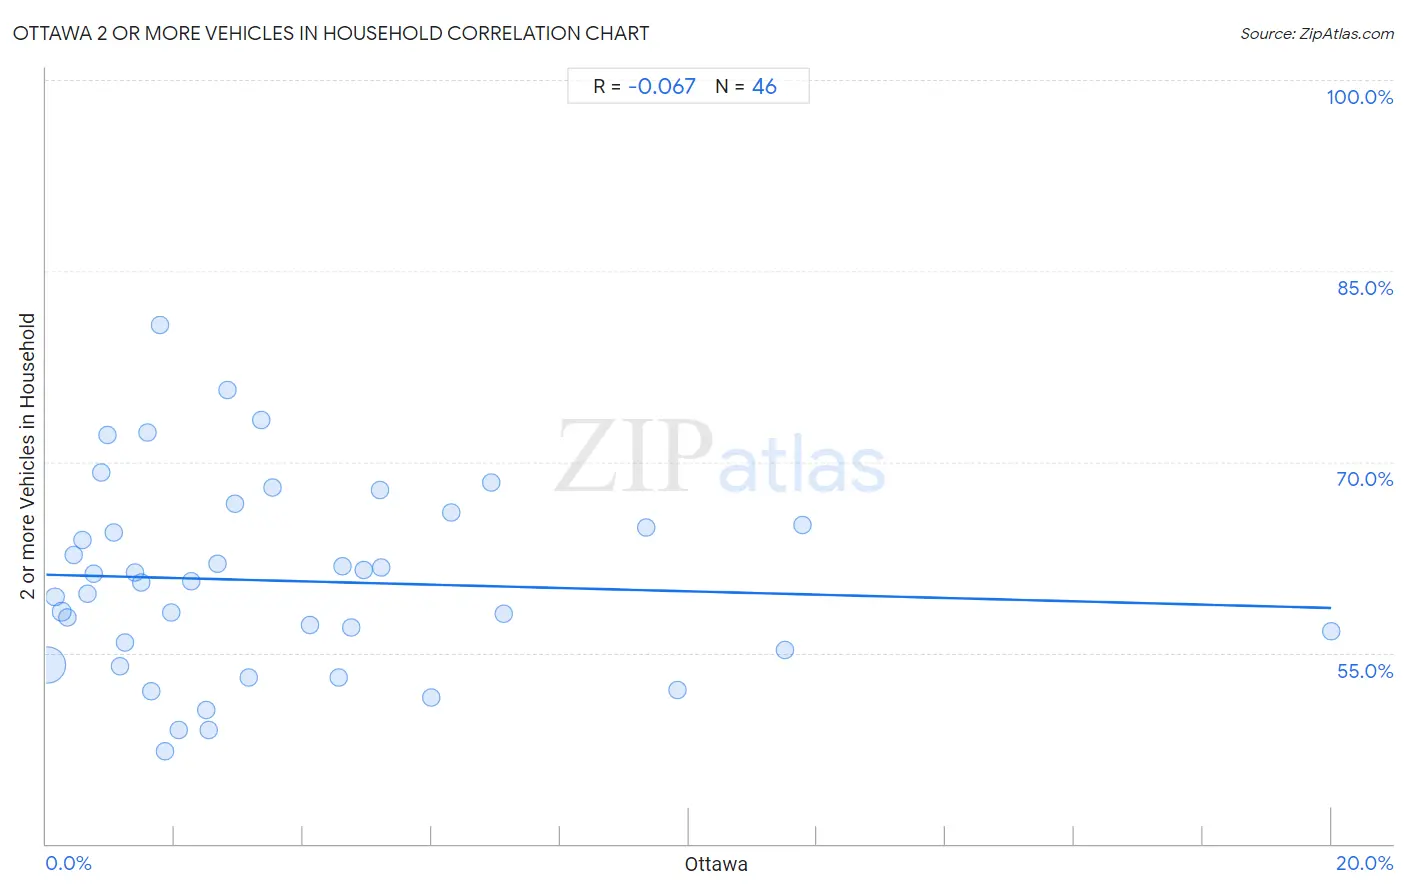
Ottawa 2 or more Vehicles in Household Correlation Chart

The statistical analysis conducted on geographies consisting of 49,944,336 people shows a slight negative correlation between the proportion of Ottawa and percentage of households with 2 or more vehicles available in the United States with a correlation coefficient (R) of -0.067 and weighted average of 57.9%. On average, for every 1% (one percent) increase in Ottawa within a typical geography, there is a decrease of 0.13% in percentage of households with 2 or more vehicles available.
Ottawa 2 or more Vehicles in Household
It is essential to understand that the correlation between the percentage of Ottawa and percentage of households with 2 or more vehicles available does not imply a direct cause-and-effect relationship. It remains uncertain whether the presence of Ottawa influences an upward or downward trend in the level of percentage of households with 2 or more vehicles available within an area, or if Ottawa simply ended up residing in those areas with higher or lower levels of percentage of households with 2 or more vehicles available due to other factors.

Demographics Similar to Ottawa by 2 or more Vehicles in Household

In terms of 2 or more vehicles in household, the demographic groups most similar to Ottawa are Shoshone (57.9%, a difference of 0.0%), Pakistani (57.9%, a difference of 0.030%), Immigrants from Germany (57.9%, a difference of 0.060%), Hispanic or Latino (57.9%, a difference of 0.060%), and Filipino (57.8%, a difference of 0.060%).
DemographicsRating | Rank2 or more Vehicles in Household
Potawatomi
99.1
/100
|
#86
Exceptional
58.0%
Thais
99.1
/100
|
#87
Exceptional
57.9%
Immigrants from Iran
99.1
/100
|
#88
Exceptional
57.9%
Immigrants from Germany
99.0
/100
|
#89
Exceptional
57.9%
Hispanics or Latinos
99.0
/100
|
#90
Exceptional
57.9%
Pakistanis
99.0
/100
|
#91
Exceptional
57.9%
Shoshone
99.0
/100
|
#92
Exceptional
57.9%
Ottawa
99.0
/100
|
#93
Exceptional
57.9%
Filipinos
98.9
/100
|
#94
Exceptional
57.8%
Hmong
98.9
/100
|
#95
Exceptional
57.8%
Burmese
98.8
/100
|
#96
Exceptional
57.8%
Slavs
98.8
/100
|
#97
Exceptional
57.8%
Palestinians
98.6
/100
|
#98
Exceptional
57.7%
Cajuns
98.5
/100
|
#99
Exceptional
57.7%
Fijians
98.4
/100
|
#100
Exceptional
57.6%

Ottawa 2 or more Vehicles in Household Correlation Summary

MeasurementOttawa Data2 or more Vehicles in Household Data
Minimum0.015%47.2%
Maximum20.0%80.8%
Range20.0%33.5%
Mean3.7%60.7%
Median2.5%60.6%
Interquartile 25% (IQ1)1.1%55.3%
Interquartile 75% (IQ3)5.0%65.0%
Interquartile Range (IQR)3.8%9.7%
Standard Deviation (Sample)3.9%7.5%
Standard Deviation (Population)3.8%7.4%

Correlation Details

Ottawa PercentileSample Size2 or more Vehicles in Household
[
0.0%
-
0.5%
]
0.015%
45,132,32154.0%
[
0.0%
-
0.5%
]
0.14%
2,782,50459.4%
[
0.0%
-
0.5%
]
0.24%
897,36958.2%
[
0.0%
-
0.5%
]
0.34%
466,85857.8%
[
0.0%
-
0.5%
]
0.43%
161,46762.7%
[
0.5%
-
1.0%
]
0.57%
64,87663.8%
[
0.5%
-
1.0%
]
0.64%
95,46359.7%
[
0.5%
-
1.0%
]
0.74%
113,05261.2%
[
0.5%
-
1.0%
]
0.85%
32,97469.2%
[
0.5%
-
1.0%
]
0.96%
7,92772.1%
[
1.0%
-
1.5%
]
1.06%
14,29864.4%
[
1.0%
-
1.5%
]
1.15%
40,27054.0%
[
1.0%
-
1.5%
]
1.22%
4,43055.8%
[
1.0%
-
1.5%
]
1.37%
28,62161.3%
[
1.0%
-
1.5%
]
1.47%
7,80060.5%
[
1.5%
-
2.0%
]
1.58%
17,15872.3%
[
1.5%
-
2.0%
]
1.63%
4,66352.0%
[
1.5%
-
2.0%
]
1.77%
11380.8%
[
1.5%
-
2.0%
]
1.84%
7,81447.2%
[
1.5%
-
2.0%
]
1.94%
16,07258.2%
[
2.0%
-
2.5%
]
2.05%
1,94849.0%
[
2.0%
-
2.5%
]
2.27%
11,20960.7%
[
2.0%
-
2.5%
]
2.50%
6,24850.5%
[
2.5%
-
3.0%
]
2.53%
47448.9%
[
2.5%
-
3.0%
]
2.67%
1,27462.0%
[
2.5%
-
3.0%
]
2.83%
63675.6%
[
2.5%
-
3.0%
]
2.93%
5,14866.7%
[
3.0%
-
3.5%
]
3.15%
6,89453.1%
[
3.0%
-
3.5%
]
3.35%
1,10573.3%
[
3.5%
-
4.0%
]
3.52%
1,99168.0%
[
4.0%
-
4.5%
]
4.10%
39057.1%
[
4.5%
-
5.0%
]
4.56%
35153.1%
[
4.5%
-
5.0%
]
4.62%
36861.8%
[
4.5%
-
5.0%
]
4.76%
4,85757.0%
[
4.5%
-
5.0%
]
4.95%
20261.5%
[
5.0%
-
5.5%
]
5.20%
25067.8%
[
5.0%
-
5.5%
]
5.22%
86261.7%
[
5.5%
-
6.0%
]
5.99%
26751.5%
[
6.0%
-
6.5%
]
6.30%
1,03166.0%
[
6.5%
-
7.0%
]
6.93%
1,41568.4%
[
7.0%
-
7.5%
]
7.11%
75958.0%
[
9.0%
-
9.5%
]
9.33%
7564.9%
[
9.5%
-
10.0%
]
9.83%
35652.1%
[
11.0%
-
11.5%
]
11.49%
8755.3%
[
11.5%
-
12.0%
]
11.76%
3465.0%
[
20.0%
-
20.5%
]
20.00%
5556.7%