Ottawa Female Disability
COMPARE
Ottawa
Select to Compare
Female Disability
Ottawa Female Disability
14.2%
DISABILITY | FEMALES
0.0/ 100
METRIC RATING
327th/ 347
METRIC RANK
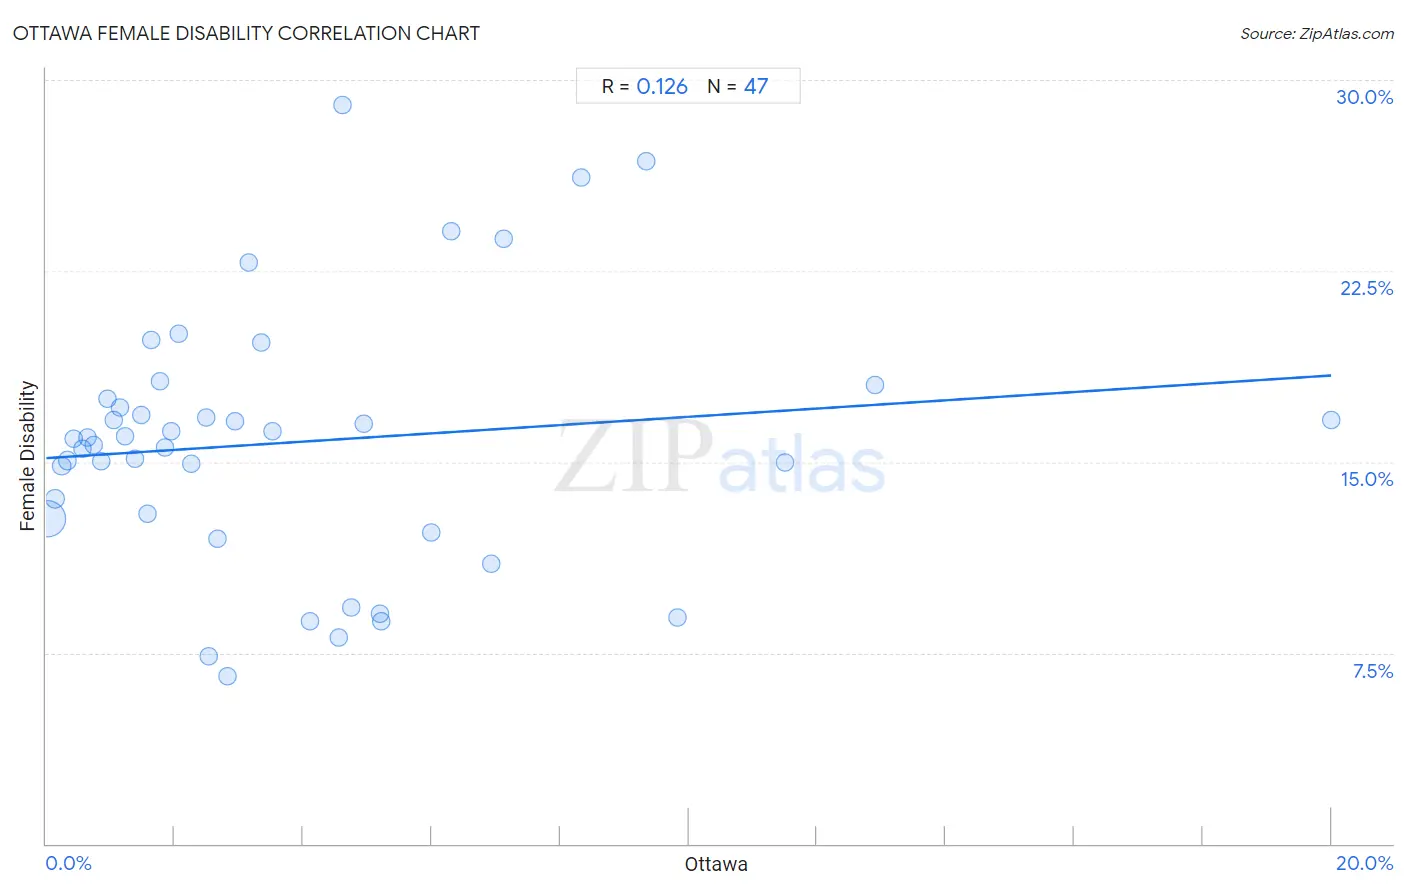
Ottawa Female Disability Correlation Chart
The statistical analysis conducted on geographies consisting of 49,954,639 people shows a poor positive correlation between the proportion of Ottawa and percentage of females with a disability in the United States with a correlation coefficient (R) of 0.126 and weighted average of 14.2%. On average, for every 1% (one percent) increase in Ottawa within a typical geography, there is an increase of 0.16% in percentage of females with a disability.
It is essential to understand that the correlation between the percentage of Ottawa and percentage of females with a disability does not imply a direct cause-and-effect relationship. It remains uncertain whether the presence of Ottawa influences an upward or downward trend in the level of percentage of females with a disability within an area, or if Ottawa simply ended up residing in those areas with higher or lower levels of percentage of females with a disability due to other factors.
Demographics Similar to Ottawa by Female Disability
In terms of female disability, the demographic groups most similar to Ottawa are Cape Verdean (14.2%, a difference of 0.0%), Osage (14.3%, a difference of 0.43%), Comanche (14.2%, a difference of 0.44%), Navajo (14.2%, a difference of 0.55%), and Native/Alaskan (14.1%, a difference of 0.69%).
| Demographics | Rating | Rank | Female Disability |
| Americans | 0.0 /100 | #320 | Tragic 14.1% |
| Potawatomi | 0.0 /100 | #321 | Tragic 14.1% |
| Pueblo | 0.0 /100 | #322 | Tragic 14.1% |
| Blacks/African Americans | 0.0 /100 | #323 | Tragic 14.1% |
| Natives/Alaskans | 0.0 /100 | #324 | Tragic 14.1% |
| Navajo | 0.0 /100 | #325 | Tragic 14.2% |
| Comanche | 0.0 /100 | #326 | Tragic 14.2% |
| Ottawa | 0.0 /100 | #327 | Tragic 14.2% |
| Cape Verdeans | 0.0 /100 | #328 | Tragic 14.2% |
| Osage | 0.0 /100 | #329 | Tragic 14.3% |
| Yuman | 0.0 /100 | #330 | Tragic 14.5% |
| Immigrants from Cabo Verde | 0.0 /100 | #331 | Tragic 14.6% |
| Pima | 0.0 /100 | #332 | Tragic 14.8% |
| Immigrants from the Azores | 0.0 /100 | #333 | Tragic 14.9% |
| Cherokee | 0.0 /100 | #334 | Tragic 14.9% |
Ottawa Female Disability Correlation Summary
| Measurement | Ottawa Data | Female Disability Data |
| Minimum | 0.015% | 6.6% |
| Maximum | 20.0% | 29.0% |
| Range | 20.0% | 22.4% |
| Mean | 3.8% | 15.8% |
| Median | 2.5% | 15.9% |
| Interquartile 25% (IQ1) | 1.1% | 12.8% |
| Interquartile 75% (IQ3) | 5.2% | 17.5% |
| Interquartile Range (IQR) | 4.1% | 4.7% |
| Standard Deviation (Sample) | 3.9% | 5.1% |
| Standard Deviation (Population) | 3.9% | 5.0% |
Correlation Details
| Ottawa Percentile | Sample Size | Female Disability |
[ 0.0% - 0.5% ] 0.015% | 45,132,321 | 12.8% |
[ 0.0% - 0.5% ] 0.14% | 2,793,359 | 13.5% |
[ 0.0% - 0.5% ] 0.24% | 896,939 | 14.8% |
[ 0.0% - 0.5% ] 0.34% | 466,858 | 15.1% |
[ 0.0% - 0.5% ] 0.43% | 161,467 | 15.9% |
[ 0.5% - 1.0% ] 0.57% | 64,876 | 15.5% |
[ 0.5% - 1.0% ] 0.64% | 95,463 | 16.0% |
[ 0.5% - 1.0% ] 0.74% | 113,052 | 15.6% |
[ 0.5% - 1.0% ] 0.85% | 32,974 | 15.0% |
[ 0.5% - 1.0% ] 0.96% | 7,927 | 17.5% |
[ 1.0% - 1.5% ] 1.06% | 14,002 | 16.7% |
[ 1.0% - 1.5% ] 1.15% | 40,270 | 17.1% |
[ 1.0% - 1.5% ] 1.22% | 4,430 | 16.0% |
[ 1.0% - 1.5% ] 1.37% | 28,621 | 15.1% |
[ 1.0% - 1.5% ] 1.47% | 7,800 | 16.9% |
[ 1.5% - 2.0% ] 1.58% | 17,158 | 13.0% |
[ 1.5% - 2.0% ] 1.63% | 4,663 | 19.8% |
[ 1.5% - 2.0% ] 1.77% | 113 | 18.2% |
[ 1.5% - 2.0% ] 1.84% | 7,814 | 15.6% |
[ 1.5% - 2.0% ] 1.94% | 16,072 | 16.2% |
[ 2.0% - 2.5% ] 2.05% | 1,948 | 20.1% |
[ 2.0% - 2.5% ] 2.27% | 11,209 | 14.9% |
[ 2.0% - 2.5% ] 2.50% | 6,248 | 16.7% |
[ 2.5% - 3.0% ] 2.53% | 474 | 7.4% |
[ 2.5% - 3.0% ] 2.67% | 1,274 | 12.0% |
[ 2.5% - 3.0% ] 2.83% | 636 | 6.6% |
[ 2.5% - 3.0% ] 2.93% | 5,148 | 16.6% |
[ 3.0% - 3.5% ] 3.15% | 6,894 | 22.8% |
[ 3.0% - 3.5% ] 3.35% | 1,105 | 19.7% |
[ 3.5% - 4.0% ] 3.52% | 1,991 | 16.2% |
[ 4.0% - 4.5% ] 4.10% | 390 | 8.7% |
[ 4.5% - 5.0% ] 4.56% | 351 | 8.1% |
[ 4.5% - 5.0% ] 4.62% | 368 | 29.0% |
[ 4.5% - 5.0% ] 4.76% | 4,857 | 9.3% |
[ 4.5% - 5.0% ] 4.95% | 202 | 16.5% |
[ 5.0% - 5.5% ] 5.20% | 250 | 9.0% |
[ 5.0% - 5.5% ] 5.22% | 862 | 8.7% |
[ 5.5% - 6.0% ] 5.99% | 267 | 12.2% |
[ 6.0% - 6.5% ] 6.30% | 1,031 | 24.0% |
[ 6.5% - 7.0% ] 6.93% | 1,415 | 11.0% |
[ 7.0% - 7.5% ] 7.11% | 759 | 23.8% |
[ 8.0% - 8.5% ] 8.33% | 84 | 26.2% |
[ 9.0% - 9.5% ] 9.33% | 75 | 26.8% |
[ 9.5% - 10.0% ] 9.83% | 356 | 8.9% |
[ 11.0% - 11.5% ] 11.49% | 87 | 15.0% |
[ 12.5% - 13.0% ] 12.90% | 124 | 18.0% |
[ 20.0% - 20.5% ] 20.00% | 55 | 16.7% |