Malaysian Unemployment Among Women with Children Ages 6 to 17 years

COMPARE

Malaysian
Race
Ancestry
AfghanAfricanAlaska NativeAlaskan AthabascanAlbanianAleutAlsatianAmericanApacheArabArapahoArgentineanArmenianAssyrian/Chaldean/SyriacAustralianAustrianBahamianBangladeshiBarbadianBasqueBelgianBelizeanBermudanBhutaneseBlackfeetBolivianBrazilianBritishBritish West IndianBulgarianBurmeseCajunCambodianCanadianCape VerdeanCarpatho RusynCelticCentral AmericanCentral American IndianCherokeeCheyenneChickasawChileanChineseChippewaChoctawColombianColvilleComancheCosta RicanCreeCreekCroatianCrowCubanCypriotCzechCzechoslovakianDanishDelawareDominicanDutchDutch West IndianEastern EuropeanEcuadorianEgyptianEnglishEstonianEthiopianEuropeanFijianFilipinoFinnishFrenchFrench American IndianFrench CanadianGermanGerman RussianGhanaianGreekGuamanian/ChamorroGuatemalanGuyaneseHaitianHmongHonduranHopiHoumaHungarianIcelanderIndian (Asian)IndonesianInupiatIranianIraqiIrishIroquoisIsraeliItalianJamaicanJapaneseJordanianKenyanKiowaKoreanLaotianLatvianLebaneseLiberianLithuanianLumbeeLuxembourgerMacedonianMalaysianMalteseMarshalleseMenomineeMexicanMexican American IndianMongolianMoroccanNative HawaiianNavajoNepaleseNew ZealanderNicaraguanNigerianNorthern EuropeanNorwegianOkinawanOsageOttawaPaiutePakistaniPalestinianPanamanianParaguayanPennsylvania GermanPeruvianPimaPolishPortuguesePotawatomiPuebloPuerto RicanPuget Sound SalishRomanianRussianSalvadoranSamoanScandinavianScotch-IrishScottishSeminoleSenegaleseSerbianShoshoneSierra LeoneanSiouxSlavicSlovakSloveneSomaliSouth AfricanSouth AmericanSouth American IndianSoviet UnionSpaniardSpanishSpanish AmericanSpanish American IndianSri LankanSubsaharan AfricanSudaneseSwedishSwissSyrianTaiwaneseThaiTlingit-HaidaTohono O'OdhamTonganTrinidadian and TobagonianTsimshianTurkishU.S. Virgin IslanderUgandanUkrainianUruguayanUteVenezuelanVietnameseWelshWest IndianYakamaYaquiYugoslavianYumanYup'ikZimbabwean
Immigration
NonimmigrantsImmigrantsAfghanistanAfricaAlbaniaArgentinaArmeniaAsiaAustraliaAustriaBahamasBangladeshBarbadosBelarusBelgiumBelizeBoliviaBosnia and HerzegovinaBrazilBulgariaBurma/MyanmarCabo VerdeCambodiaCameroonCanadaCaribbeanCentral AmericaChileChinaColombiaCongoCosta RicaCroatiaCubaCzechoslovakiaDenmarkDominicaDominican RepublicEastern AfricaEastern AsiaEastern EuropeEcuadorEgyptEl SalvadorEnglandEritreaEthiopiaEuropeFijiFranceGermanyGhanaGreeceGrenadaGuatemalaGuyanaHaitiHondurasHong KongHungaryIndiaIndonesiaIranIraqIrelandIsraelItalyJamaicaJapanJordanKazakhstanKenyaKoreaKuwaitLaosLatin AmericaLatviaLebanonLiberiaLithuaniaMalaysiaMexicoMicronesiaMiddle AfricaMoldovaMoroccoNepalNetherlandsNicaraguaNigeriaNorth AmericaNorth MacedoniaNorthern AfricaNorthern EuropeNorwayOceaniaPakistanPanamaPeruPhilippinesPolandPortugalRomaniaRussiaSaudi ArabiaScotlandSenegalSerbiaSierra LeoneSingaporeSomaliaSouth AfricaSouth AmericaSouth Central AsiaSouth Eastern AsiaSouthern EuropeSpainSri LankaSt. Vincent and the GrenadinesSudanSwedenSwitzerlandSyriaTaiwanThailandTrinidad and TobagoTurkeyUgandaUkraineUruguayUzbekistanVenezuelaVietnamWest IndiesWestern AfricaWestern AsiaWestern EuropeYemenZaireZimbabweAzores
Select to Compare
Race
Ancestry
AfghanAfricanAlaska NativeAlaskan AthabascanAlbanianAleutAlsatianAmericanApacheArabArapahoArgentineanArmenianAssyrian/Chaldean/SyriacAustralianAustrianBahamianBangladeshiBarbadianBasqueBelgianBelizeanBermudanBhutaneseBlackfeetBolivianBrazilianBritishBritish West IndianBulgarianBurmeseCajunCambodianCanadianCape VerdeanCarpatho RusynCelticCentral AmericanCentral American IndianCherokeeCheyenneChickasawChileanChineseChippewaChoctawColombianColvilleComancheCosta RicanCreeCreekCroatianCrowCubanCypriotCzechCzechoslovakianDanishDelawareDominicanDutchDutch West IndianEastern EuropeanEcuadorianEgyptianEnglishEstonianEthiopianEuropeanFijianFilipinoFinnishFrenchFrench American IndianFrench CanadianGermanGerman RussianGhanaianGreekGuamanian/ChamorroGuatemalanGuyaneseHaitianHmongHonduranHopiHoumaHungarianIcelanderIndian (Asian)IndonesianInupiatIranianIraqiIrishIroquoisIsraeliItalianJamaicanJapaneseJordanianKenyanKiowaKoreanLaotianLatvianLebaneseLiberianLithuanianLumbeeLuxembourgerMacedonianMalteseMarshalleseMenomineeMexicanMexican American IndianMongolianMoroccanNative HawaiianNavajoNepaleseNew ZealanderNicaraguanNigerianNorthern EuropeanNorwegianOkinawanOsageOttawaPaiutePakistaniPalestinianPanamanianParaguayanPennsylvania GermanPeruvianPimaPolishPortuguesePotawatomiPuebloPuerto RicanPuget Sound SalishRomanianRussianSalvadoranSamoanScandinavianScotch-IrishScottishSeminoleSenegaleseSerbianShoshoneSierra LeoneanSiouxSlavicSlovakSloveneSomaliSouth AfricanSouth AmericanSouth American IndianSoviet UnionSpaniardSpanishSpanish AmericanSpanish American IndianSri LankanSubsaharan AfricanSudaneseSwedishSwissSyrianTaiwaneseThaiTlingit-HaidaTohono O'OdhamTonganTrinidadian and TobagonianTsimshianTurkishU.S. Virgin IslanderUgandanUkrainianUruguayanUteVenezuelanVietnameseWelshWest IndianYakamaYaquiYugoslavianYumanYup'ikZimbabwean
Immigration
NonimmigrantsImmigrantsAfghanistanAfricaAlbaniaArgentinaArmeniaAsiaAustraliaAustriaBahamasBangladeshBarbadosBelarusBelgiumBelizeBoliviaBosnia and HerzegovinaBrazilBulgariaBurma/MyanmarCabo VerdeCambodiaCameroonCanadaCaribbeanCentral AmericaChileChinaColombiaCongoCosta RicaCroatiaCubaCzechoslovakiaDenmarkDominicaDominican RepublicEastern AfricaEastern AsiaEastern EuropeEcuadorEgyptEl SalvadorEnglandEritreaEthiopiaEuropeFijiFranceGermanyGhanaGreeceGrenadaGuatemalaGuyanaHaitiHondurasHong KongHungaryIndiaIndonesiaIranIraqIrelandIsraelItalyJamaicaJapanJordanKazakhstanKenyaKoreaKuwaitLaosLatin AmericaLatviaLebanonLiberiaLithuaniaMalaysiaMexicoMicronesiaMiddle AfricaMoldovaMoroccoNepalNetherlandsNicaraguaNigeriaNorth AmericaNorth MacedoniaNorthern AfricaNorthern EuropeNorwayOceaniaPakistanPanamaPeruPhilippinesPolandPortugalRomaniaRussiaSaudi ArabiaScotlandSenegalSerbiaSierra LeoneSingaporeSomaliaSouth AfricaSouth AmericaSouth Central AsiaSouth Eastern AsiaSouthern EuropeSpainSri LankaSt. Vincent and the GrenadinesSudanSwedenSwitzerlandSyriaTaiwanThailandTrinidad and TobagoTurkeyUgandaUkraineUruguayUzbekistanVenezuelaVietnamWest IndiesWestern AfricaWestern AsiaWestern EuropeYemenZaireZimbabweAzores
Unemployment Among Women with Children Ages 6 to 17 years
Income
Poverty
Unemployment
Labor Participation
Family Structure
Vehicle Availability
Education Level
Disability

Malaysian Unemployment Among Women with Children Ages 6 to 17 years
Exceptional

8.6%
UNEMPLOYMENT | WOMEN W/ CHILDREN 6 TO 17
98.5/ 100
METRIC RATING
98th/ 347
METRIC RANK

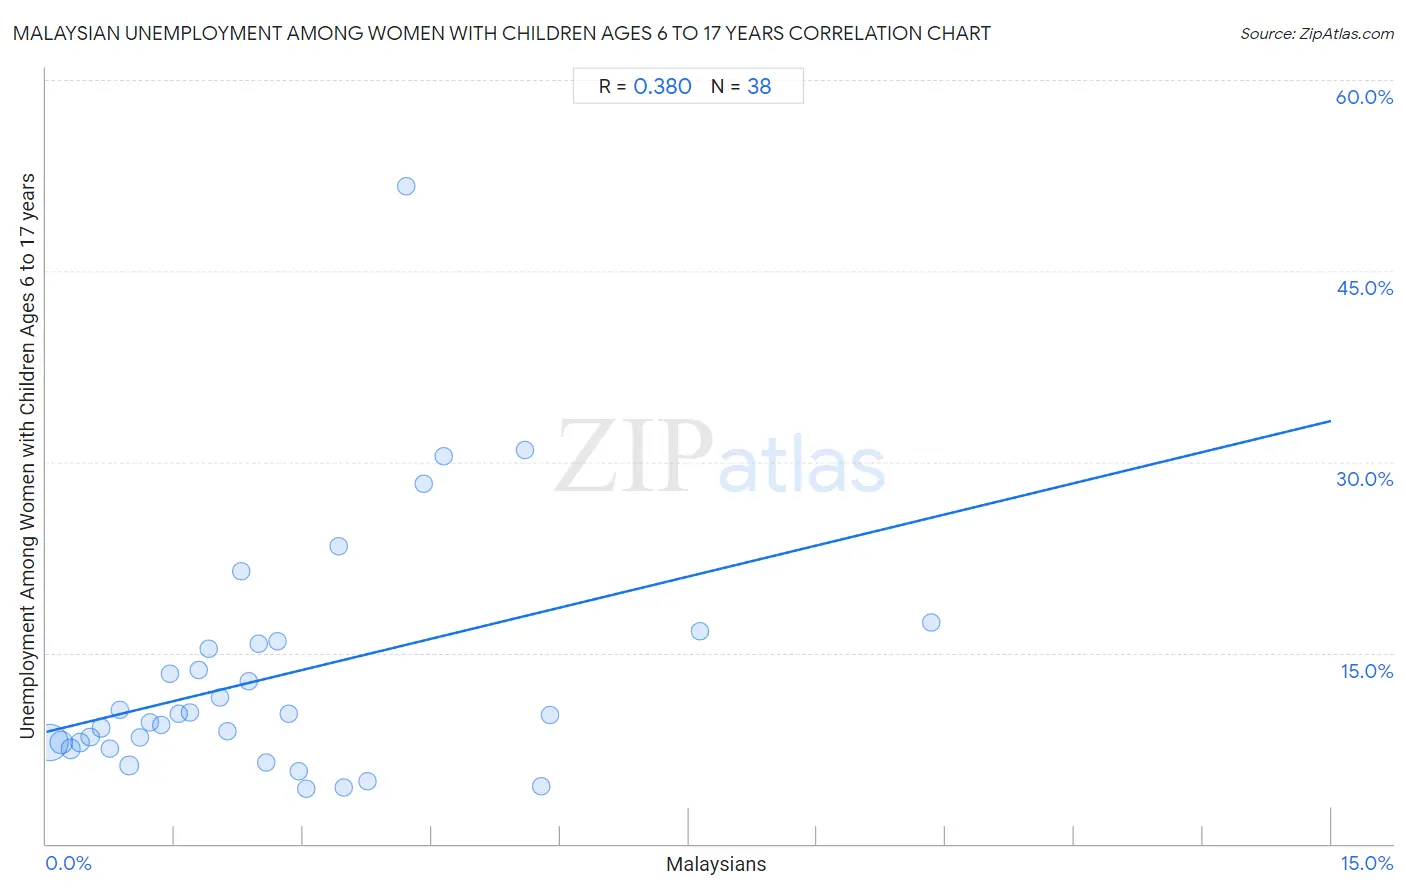
Malaysian Unemployment Among Women with Children Ages 6 to 17 years Correlation Chart

The statistical analysis conducted on geographies consisting of 183,276,998 people shows a mild positive correlation between the proportion of Malaysians and unemployment rate among women with children between the ages 6 and 17 in the United States with a correlation coefficient (R) of 0.380 and weighted average of 8.6%. On average, for every 1% (one percent) increase in Malaysians within a typical geography, there is an increase of 1.6% in unemployment rate among women with children between the ages 6 and 17.
Malaysian Unemployment Among Women with Children Ages 6 to 17 years
It is essential to understand that the correlation between the percentage of Malaysians and unemployment rate among women with children between the ages 6 and 17 does not imply a direct cause-and-effect relationship. It remains uncertain whether the presence of Malaysians influences an upward or downward trend in the level of unemployment rate among women with children between the ages 6 and 17 within an area, or if Malaysians simply ended up residing in those areas with higher or lower levels of unemployment rate among women with children between the ages 6 and 17 due to other factors.

Demographics Similar to Malaysians by Unemployment Among Women with Children Ages 6 to 17 years

In terms of unemployment among women with children ages 6 to 17 years, the demographic groups most similar to Malaysians are Bolivian (8.5%, a difference of 0.040%), Immigrants from Lithuania (8.6%, a difference of 0.080%), New Zealander (8.6%, a difference of 0.080%), Immigrants from Pakistan (8.6%, a difference of 0.080%), and Immigrants from South Africa (8.6%, a difference of 0.10%).
DemographicsRating | RankUnemployment Among Women with Children Ages 6 to 17 years
Immigrants from Eastern Europe
99.0
/100
|
#91
Exceptional
8.5%
Potawatomi
99.0
/100
|
#92
Exceptional
8.5%
Australians
98.9
/100
|
#93
Exceptional
8.5%
Immigrants from Barbados
98.8
/100
|
#94
Exceptional
8.5%
Sri Lankans
98.7
/100
|
#95
Exceptional
8.5%
German Russians
98.6
/100
|
#96
Exceptional
8.5%
Bolivians
98.5
/100
|
#97
Exceptional
8.5%
Malaysians
98.5
/100
|
#98
Exceptional
8.6%
Immigrants from Lithuania
98.4
/100
|
#99
Exceptional
8.6%
New Zealanders
98.4
/100
|
#100
Exceptional
8.6%
Immigrants from Pakistan
98.4
/100
|
#101
Exceptional
8.6%
Immigrants from South Africa
98.3
/100
|
#102
Exceptional
8.6%
Scandinavians
98.3
/100
|
#103
Exceptional
8.6%
Immigrants from France
98.0
/100
|
#104
Exceptional
8.6%
Immigrants from Norway
97.8
/100
|
#105
Exceptional
8.6%

Malaysian Unemployment Among Women with Children Ages 6 to 17 years Correlation Summary

MeasurementMalaysian DataUnemployment Among Women with Children Ages 6 to 17 years Data
Minimum0.043%4.4%
Maximum10.3%51.7%
Range10.3%47.3%
Mean2.7%13.1%
Median2.2%10.1%
Interquartile 25% (IQ1)1.1%7.9%
Interquartile 75% (IQ3)3.5%15.7%
Interquartile Range (IQR)2.4%7.8%
Standard Deviation (Sample)2.2%9.4%
Standard Deviation (Population)2.2%9.3%

Correlation Details

Malaysian PercentileSample SizeUnemployment Among Women with Children Ages 6 to 17 years
[
0.0%
-
0.5%
]
0.043%
113,699,5417.9%
[
0.0%
-
0.5%
]
0.17%
30,242,3738.0%
[
0.0%
-
0.5%
]
0.28%
14,706,5447.5%
[
0.0%
-
0.5%
]
0.39%
6,675,2988.0%
[
0.5%
-
1.0%
]
0.52%
5,325,4788.4%
[
0.5%
-
1.0%
]
0.64%
2,693,4589.1%
[
0.5%
-
1.0%
]
0.74%
1,752,7597.5%
[
0.5%
-
1.0%
]
0.86%
1,291,92610.5%
[
0.5%
-
1.0%
]
0.97%
2,010,4576.1%
[
1.0%
-
1.5%
]
1.09%
505,6138.3%
[
1.0%
-
1.5%
]
1.21%
1,282,5789.5%
[
1.0%
-
1.5%
]
1.34%
498,7649.4%
[
1.0%
-
1.5%
]
1.45%
249,94313.3%
[
1.5%
-
2.0%
]
1.54%
290,28110.2%
[
1.5%
-
2.0%
]
1.67%
586,12810.3%
[
1.5%
-
2.0%
]
1.78%
100,96313.6%
[
1.5%
-
2.0%
]
1.89%
182,38315.4%
[
2.0%
-
2.5%
]
2.03%
87,26011.5%
[
2.0%
-
2.5%
]
2.11%
163,8448.9%
[
2.0%
-
2.5%
]
2.28%
31,49621.4%
[
2.0%
-
2.5%
]
2.36%
125,09912.8%
[
2.0%
-
2.5%
]
2.48%
181,26015.7%
[
2.5%
-
3.0%
]
2.57%
86,1926.4%
[
2.5%
-
3.0%
]
2.70%
19,71715.9%
[
2.5%
-
3.0%
]
2.83%
138,95510.3%
[
2.5%
-
3.0%
]
2.94%
183,5065.7%
[
3.0%
-
3.5%
]
3.03%
71,2444.4%
[
3.0%
-
3.5%
]
3.42%
2,48923.4%
[
3.0%
-
3.5%
]
3.47%
25,7634.5%
[
3.5%
-
4.0%
]
3.75%
27,5034.9%
[
4.0%
-
4.5%
]
4.20%
1,85751.7%
[
4.0%
-
4.5%
]
4.41%
3,92728.3%
[
4.5%
-
5.0%
]
4.64%
2,84530.4%
[
5.5%
-
6.0%
]
5.59%
1,57430.9%
[
5.5%
-
6.0%
]
5.78%
1,3164.5%
[
5.5%
-
6.0%
]
5.88%
3,26410.1%
[
7.5%
-
8.0%
]
7.63%
22,53916.7%
[
10.0%
-
10.5%
]
10.34%
86117.4%