Malaysian College, Under 1 year
COMPARE
Malaysian
Select to Compare
College, Under 1 year
Malaysian College, Under 1 year
62.2%
COLLEGE, UNDER 1 YEAR
1.1/ 100
METRIC RATING
242nd/ 347
METRIC RANK
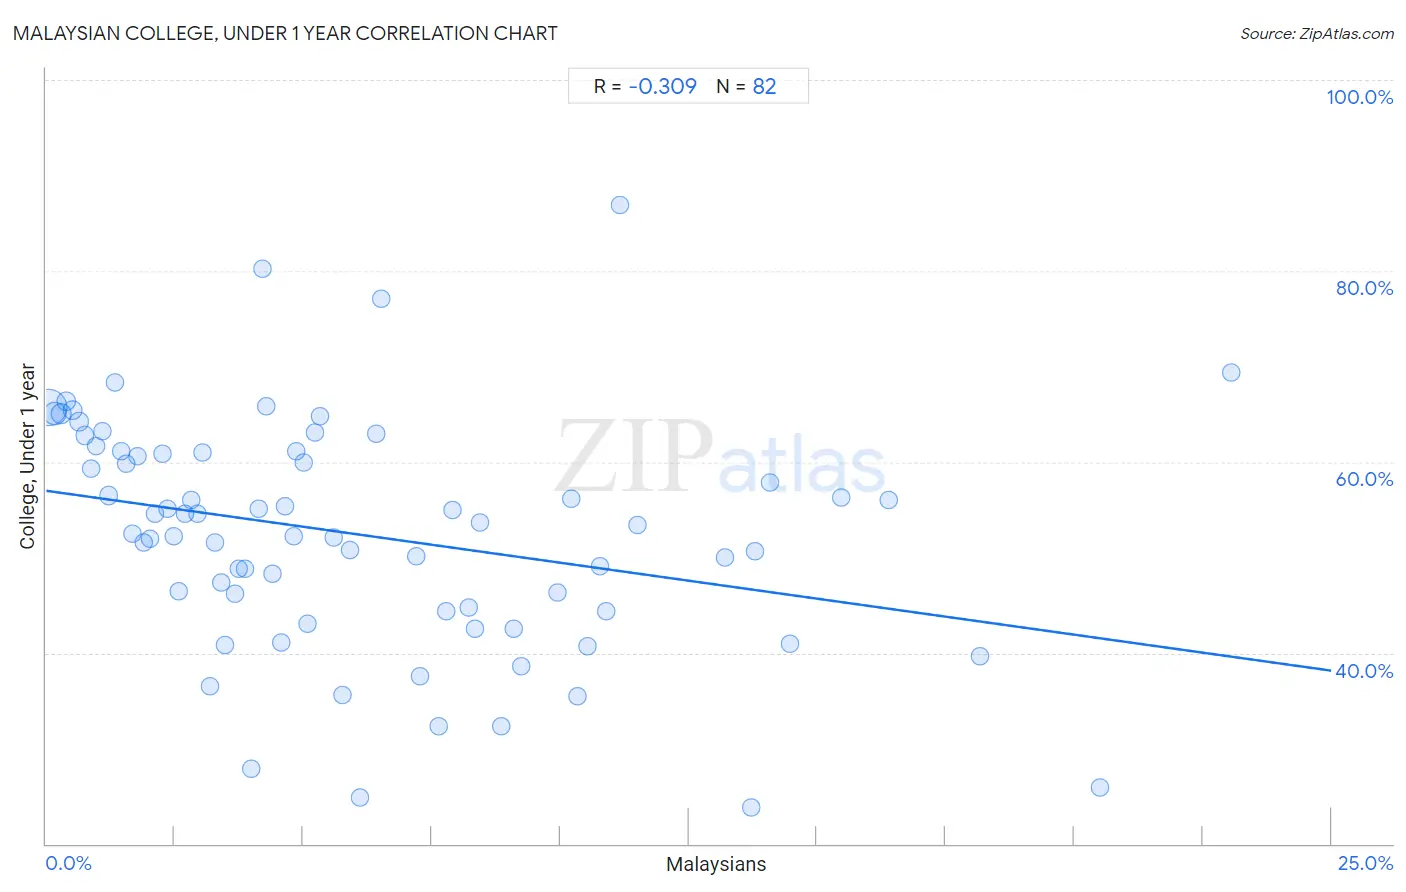
Malaysian College, Under 1 year Correlation Chart
The statistical analysis conducted on geographies consisting of 226,109,118 people shows a mild negative correlation between the proportion of Malaysians and percentage of population with at least college, under 1 year education in the United States with a correlation coefficient (R) of -0.309 and weighted average of 62.2%. On average, for every 1% (one percent) increase in Malaysians within a typical geography, there is a decrease of 0.75% in percentage of population with at least college, under 1 year education.
It is essential to understand that the correlation between the percentage of Malaysians and percentage of population with at least college, under 1 year education does not imply a direct cause-and-effect relationship. It remains uncertain whether the presence of Malaysians influences an upward or downward trend in the level of percentage of population with at least college, under 1 year education within an area, or if Malaysians simply ended up residing in those areas with higher or lower levels of percentage of population with at least college, under 1 year education due to other factors.
Demographics Similar to Malaysians by College, Under 1 year
In terms of college, under 1 year, the demographic groups most similar to Malaysians are Hawaiian (62.1%, a difference of 0.030%), Ottawa (62.2%, a difference of 0.050%), Nepalese (62.2%, a difference of 0.060%), Aleut (62.2%, a difference of 0.060%), and Colville (62.1%, a difference of 0.12%).
| Demographics | Rating | Rank | College, Under 1 year |
| Spanish Americans | 1.9 /100 | #235 | Tragic 62.6% |
| Immigrants | 1.7 /100 | #236 | Tragic 62.5% |
| Immigrants from Burma/Myanmar | 1.6 /100 | #237 | Tragic 62.5% |
| French American Indians | 1.5 /100 | #238 | Tragic 62.4% |
| Nepalese | 1.1 /100 | #239 | Tragic 62.2% |
| Aleuts | 1.1 /100 | #240 | Tragic 62.2% |
| Ottawa | 1.1 /100 | #241 | Tragic 62.2% |
| Malaysians | 1.1 /100 | #242 | Tragic 62.2% |
| Hawaiians | 1.1 /100 | #243 | Tragic 62.1% |
| Colville | 1.0 /100 | #244 | Tragic 62.1% |
| Delaware | 0.9 /100 | #245 | Tragic 62.1% |
| Marshallese | 0.8 /100 | #246 | Tragic 61.9% |
| Immigrants from Liberia | 0.8 /100 | #247 | Tragic 61.9% |
| Potawatomi | 0.6 /100 | #248 | Tragic 61.8% |
| Vietnamese | 0.5 /100 | #249 | Tragic 61.7% |
Malaysian College, Under 1 year Correlation Summary
| Measurement | Malaysian Data | College, Under 1 year Data |
| Minimum | 0.044% | 23.8% |
| Maximum | 23.0% | 86.9% |
| Range | 23.0% | 63.2% |
| Mean | 6.1% | 52.4% |
| Median | 4.7% | 53.0% |
| Interquartile 25% (IQ1) | 2.4% | 44.4% |
| Interquartile 75% (IQ3) | 8.9% | 60.9% |
| Interquartile Range (IQR) | 6.5% | 16.6% |
| Standard Deviation (Sample) | 5.0% | 12.1% |
| Standard Deviation (Population) | 5.0% | 12.1% |
Correlation Details
| Malaysian Percentile | Sample Size | College, Under 1 year |
[ 0.0% - 0.5% ] 0.044% | 134,167,359 | 65.6% |
[ 0.0% - 0.5% ] 0.17% | 38,988,285 | 65.1% |
[ 0.0% - 0.5% ] 0.28% | 19,162,273 | 65.1% |
[ 0.0% - 0.5% ] 0.39% | 9,269,885 | 66.4% |
[ 0.5% - 1.0% ] 0.52% | 6,700,605 | 65.4% |
[ 0.5% - 1.0% ] 0.64% | 3,614,637 | 64.2% |
[ 0.5% - 1.0% ] 0.74% | 2,416,248 | 62.8% |
[ 0.5% - 1.0% ] 0.87% | 1,944,615 | 59.3% |
[ 0.5% - 1.0% ] 0.97% | 2,172,635 | 61.7% |
[ 1.0% - 1.5% ] 1.09% | 884,487 | 63.2% |
[ 1.0% - 1.5% ] 1.21% | 1,578,390 | 56.5% |
[ 1.0% - 1.5% ] 1.34% | 872,983 | 68.3% |
[ 1.0% - 1.5% ] 1.45% | 464,748 | 61.1% |
[ 1.5% - 2.0% ] 1.55% | 612,695 | 59.8% |
[ 1.5% - 2.0% ] 1.67% | 755,233 | 52.5% |
[ 1.5% - 2.0% ] 1.77% | 301,681 | 60.6% |
[ 1.5% - 2.0% ] 1.89% | 272,589 | 51.5% |
[ 2.0% - 2.5% ] 2.02% | 202,170 | 52.0% |
[ 2.0% - 2.5% ] 2.11% | 273,549 | 54.6% |
[ 2.0% - 2.5% ] 2.26% | 94,545 | 60.8% |
[ 2.0% - 2.5% ] 2.36% | 188,385 | 55.1% |
[ 2.0% - 2.5% ] 2.48% | 210,482 | 52.2% |
[ 2.5% - 3.0% ] 2.58% | 112,120 | 46.4% |
[ 2.5% - 3.0% ] 2.71% | 42,764 | 54.6% |
[ 2.5% - 3.0% ] 2.83% | 163,649 | 56.1% |
[ 2.5% - 3.0% ] 2.94% | 195,376 | 54.6% |
[ 3.0% - 3.5% ] 3.03% | 102,188 | 60.9% |
[ 3.0% - 3.5% ] 3.20% | 27,756 | 36.5% |
[ 3.0% - 3.5% ] 3.28% | 43,282 | 51.6% |
[ 3.0% - 3.5% ] 3.41% | 4,012 | 47.4% |
[ 3.0% - 3.5% ] 3.47% | 27,020 | 40.8% |
[ 3.5% - 4.0% ] 3.66% | 18,104 | 46.1% |
[ 3.5% - 4.0% ] 3.75% | 33,043 | 48.8% |
[ 3.5% - 4.0% ] 3.86% | 19,242 | 48.8% |
[ 3.5% - 4.0% ] 3.99% | 1,706 | 27.9% |
[ 4.0% - 4.5% ] 4.14% | 1,955 | 55.0% |
[ 4.0% - 4.5% ] 4.20% | 1,857 | 80.2% |
[ 4.0% - 4.5% ] 4.28% | 11,587 | 65.8% |
[ 4.0% - 4.5% ] 4.41% | 3,927 | 48.2% |
[ 4.5% - 5.0% ] 4.58% | 19,389 | 41.0% |
[ 4.5% - 5.0% ] 4.64% | 2,845 | 55.3% |
[ 4.5% - 5.0% ] 4.82% | 2,262 | 52.2% |
[ 4.5% - 5.0% ] 4.87% | 6,511 | 61.1% |
[ 5.0% - 5.5% ] 5.02% | 7,674 | 60.0% |
[ 5.0% - 5.5% ] 5.09% | 2,063 | 43.1% |
[ 5.0% - 5.5% ] 5.22% | 10,527 | 63.1% |
[ 5.0% - 5.5% ] 5.33% | 3,993 | 64.8% |
[ 5.5% - 6.0% ] 5.59% | 1,826 | 52.1% |
[ 5.5% - 6.0% ] 5.78% | 1,316 | 35.5% |
[ 5.5% - 6.0% ] 5.91% | 8,788 | 50.8% |
[ 6.0% - 6.5% ] 6.10% | 541 | 24.9% |
[ 6.0% - 6.5% ] 6.42% | 4,001 | 62.9% |
[ 6.5% - 7.0% ] 6.52% | 3,005 | 77.1% |
[ 7.0% - 7.5% ] 7.19% | 1,460 | 50.1% |
[ 7.0% - 7.5% ] 7.27% | 55 | 37.5% |
[ 7.5% - 8.0% ] 7.63% | 22,539 | 32.3% |
[ 7.5% - 8.0% ] 7.79% | 578 | 44.4% |
[ 7.5% - 8.0% ] 7.91% | 278 | 55.0% |
[ 8.0% - 8.5% ] 8.21% | 15,355 | 44.8% |
[ 8.0% - 8.5% ] 8.33% | 216 | 42.5% |
[ 8.0% - 8.5% ] 8.44% | 2,819 | 53.6% |
[ 8.5% - 9.0% ] 8.85% | 610 | 32.3% |
[ 9.0% - 9.5% ] 9.10% | 13,838 | 42.5% |
[ 9.0% - 9.5% ] 9.24% | 1,407 | 38.6% |
[ 9.5% - 10.0% ] 9.95% | 191 | 46.4% |
[ 10.0% - 10.5% ] 10.21% | 2,595 | 56.1% |
[ 10.0% - 10.5% ] 10.34% | 861 | 35.4% |
[ 10.5% - 11.0% ] 10.54% | 389 | 40.7% |
[ 10.5% - 11.0% ] 10.78% | 2,207 | 49.1% |
[ 10.5% - 11.0% ] 10.90% | 991 | 44.4% |
[ 11.0% - 11.5% ] 11.17% | 197 | 86.9% |
[ 11.0% - 11.5% ] 11.49% | 87 | 53.4% |
[ 13.0% - 13.5% ] 13.21% | 106 | 50.0% |
[ 13.5% - 14.0% ] 13.71% | 2,984 | 23.8% |
[ 13.5% - 14.0% ] 13.79% | 1,900 | 50.6% |
[ 14.0% - 14.5% ] 14.08% | 71 | 57.9% |
[ 14.0% - 14.5% ] 14.47% | 1,693 | 41.0% |
[ 15.0% - 15.5% ] 15.46% | 679 | 56.3% |
[ 16.0% - 16.5% ] 16.39% | 61 | 56.0% |
[ 18.0% - 18.5% ] 18.16% | 1,052 | 39.6% |
[ 20.0% - 20.5% ] 20.49% | 527 | 25.9% |
[ 23.0% - 23.5% ] 23.05% | 564 | 69.4% |