Immigrants from Russia 1 or more Vehicles in Household
COMPARE
Immigrants from Russia
Select to Compare
1 or more Vehicles in Household
Immigrants from Russia 1 or more Vehicles in Household
85.4%
1+ VEHICLES AVAILABLE
0.0/ 100
METRIC RATING
300th/ 347
METRIC RANK
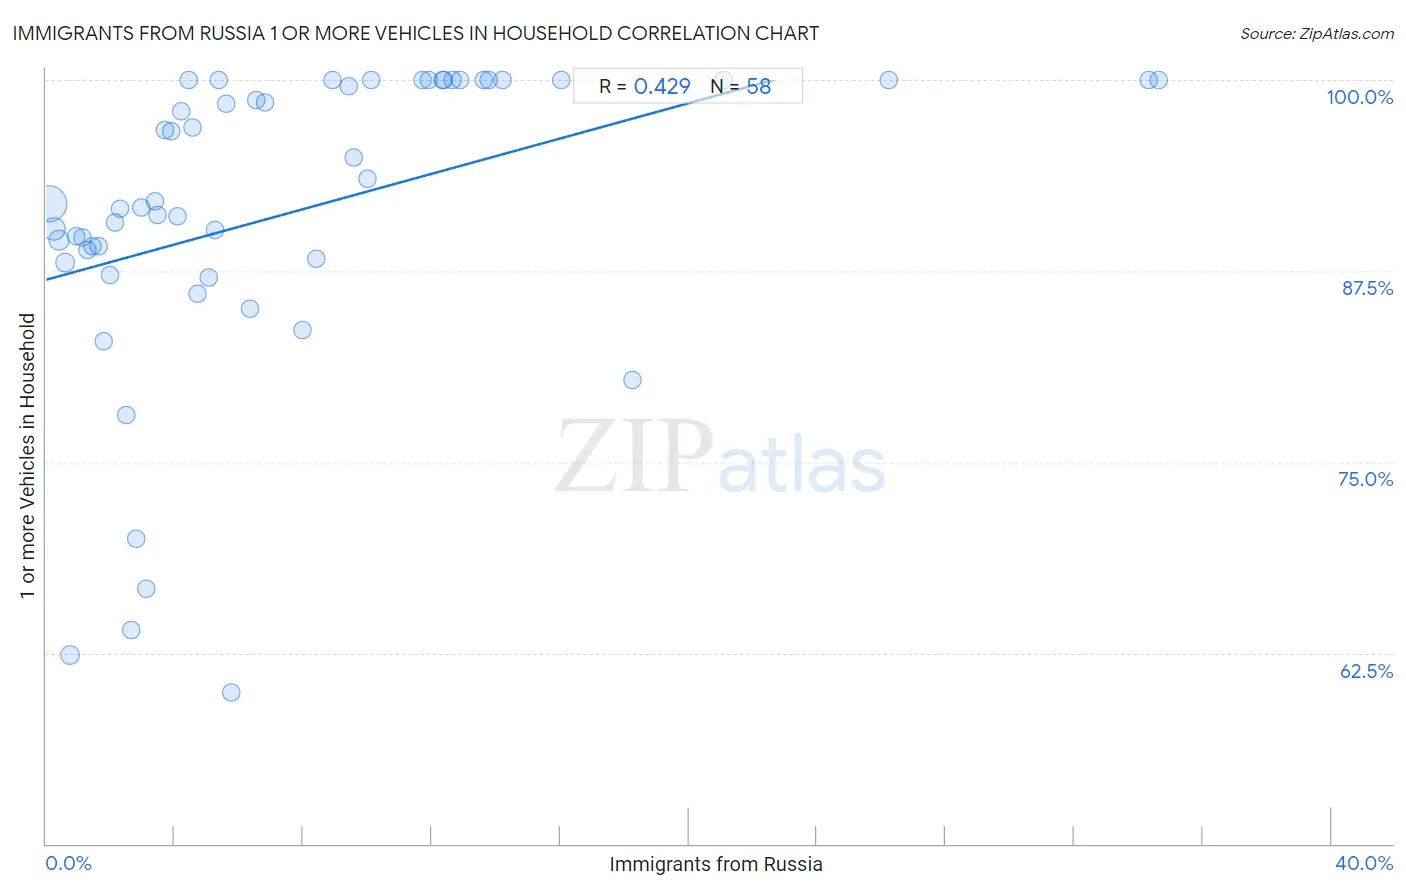
Immigrants from Russia 1 or more Vehicles in Household Correlation Chart
The statistical analysis conducted on geographies consisting of 347,625,185 people shows a moderate positive correlation between the proportion of Immigrants from Russia and percentage of households with 1 or more vehicles available in the United States with a correlation coefficient (R) of 0.429 and weighted average of 85.4%. On average, for every 1% (one percent) increase in Immigrants from Russia within a typical geography, there is an increase of 0.58% in percentage of households with 1 or more vehicles available.
It is essential to understand that the correlation between the percentage of Immigrants from Russia and percentage of households with 1 or more vehicles available does not imply a direct cause-and-effect relationship. It remains uncertain whether the presence of Immigrants from Russia influences an upward or downward trend in the level of percentage of households with 1 or more vehicles available within an area, or if Immigrants from Russia simply ended up residing in those areas with higher or lower levels of percentage of households with 1 or more vehicles available due to other factors.
Demographics Similar to Immigrants from Russia by 1 or more Vehicles in Household
In terms of 1 or more vehicles in household, the demographic groups most similar to Immigrants from Russia are Yuman (85.5%, a difference of 0.0%), Immigrants from Panama (85.4%, a difference of 0.040%), Moroccan (85.4%, a difference of 0.060%), Immigrants from Greece (85.4%, a difference of 0.090%), and Belizean (85.7%, a difference of 0.25%).
| Demographics | Rating | Rank | 1 or more Vehicles in Household |
| Indians (Asian) | 0.0 /100 | #293 | Tragic 86.0% |
| Alaskan Athabascans | 0.0 /100 | #294 | Tragic 86.0% |
| Immigrants from Jamaica | 0.0 /100 | #295 | Tragic 85.8% |
| Immigrants from Spain | 0.0 /100 | #296 | Tragic 85.8% |
| Paraguayans | 0.0 /100 | #297 | Tragic 85.7% |
| Belizeans | 0.0 /100 | #298 | Tragic 85.7% |
| Yuman | 0.0 /100 | #299 | Tragic 85.5% |
| Immigrants from Russia | 0.0 /100 | #300 | Tragic 85.4% |
| Immigrants from Panama | 0.0 /100 | #301 | Tragic 85.4% |
| Moroccans | 0.0 /100 | #302 | Tragic 85.4% |
| Immigrants from Greece | 0.0 /100 | #303 | Tragic 85.4% |
| Immigrants from Ukraine | 0.0 /100 | #304 | Tragic 85.2% |
| Immigrants from China | 0.0 /100 | #305 | Tragic 84.9% |
| Immigrants from Western Africa | 0.0 /100 | #306 | Tragic 84.9% |
| Tohono O'odham | 0.0 /100 | #307 | Tragic 84.7% |
Immigrants from Russia 1 or more Vehicles in Household Correlation Summary
| Measurement | Immigrants from Russia Data | 1 or more Vehicles in Household Data |
| Minimum | 0.071% | 59.9% |
| Maximum | 34.6% | 100.0% |
| Range | 34.5% | 40.1% |
| Mean | 7.7% | 91.3% |
| Median | 5.2% | 92.0% |
| Interquartile 25% (IQ1) | 2.5% | 88.3% |
| Interquartile 75% (IQ3) | 11.7% | 100.0% |
| Interquartile Range (IQR) | 9.2% | 11.7% |
| Standard Deviation (Sample) | 7.6% | 10.2% |
| Standard Deviation (Population) | 7.5% | 10.1% |
Correlation Details
| Immigrants from Russia Percentile | Sample Size | 1 or more Vehicles in Household |
[ 0.0% - 0.5% ] 0.071% | 227,484,585 | 91.9% |
[ 0.0% - 0.5% ] 0.24% | 56,827,314 | 90.3% |
[ 0.0% - 0.5% ] 0.40% | 25,632,729 | 89.5% |
[ 0.5% - 1.0% ] 0.60% | 12,703,095 | 88.0% |
[ 0.5% - 1.0% ] 0.73% | 14,348,151 | 62.4% |
[ 0.5% - 1.0% ] 0.94% | 3,304,702 | 89.8% |
[ 1.0% - 1.5% ] 1.12% | 1,873,118 | 89.7% |
[ 1.0% - 1.5% ] 1.28% | 1,532,313 | 88.9% |
[ 1.0% - 1.5% ] 1.45% | 1,150,650 | 89.1% |
[ 1.5% - 2.0% ] 1.62% | 725,648 | 89.2% |
[ 1.5% - 2.0% ] 1.78% | 289,708 | 82.9% |
[ 1.5% - 2.0% ] 1.99% | 232,677 | 87.2% |
[ 2.0% - 2.5% ] 2.13% | 274,460 | 90.7% |
[ 2.0% - 2.5% ] 2.30% | 150,263 | 91.5% |
[ 2.0% - 2.5% ] 2.49% | 120,260 | 78.1% |
[ 2.5% - 3.0% ] 2.66% | 182,256 | 64.0% |
[ 2.5% - 3.0% ] 2.81% | 263,100 | 69.9% |
[ 2.5% - 3.0% ] 2.97% | 133,358 | 91.7% |
[ 3.0% - 3.5% ] 3.12% | 128,379 | 66.7% |
[ 3.0% - 3.5% ] 3.38% | 11,700 | 92.0% |
[ 3.0% - 3.5% ] 3.46% | 52,850 | 91.2% |
[ 3.5% - 4.0% ] 3.68% | 9,462 | 96.7% |
[ 3.5% - 4.0% ] 3.89% | 5,292 | 96.7% |
[ 4.0% - 4.5% ] 4.07% | 23,266 | 91.1% |
[ 4.0% - 4.5% ] 4.19% | 22,161 | 98.0% |
[ 4.0% - 4.5% ] 4.44% | 2,768 | 100.0% |
[ 4.5% - 5.0% ] 4.54% | 1,321 | 96.9% |
[ 4.5% - 5.0% ] 4.70% | 4,064 | 86.0% |
[ 5.0% - 5.5% ] 5.06% | 9,047 | 87.1% |
[ 5.0% - 5.5% ] 5.25% | 22,848 | 90.2% |
[ 5.0% - 5.5% ] 5.36% | 261 | 100.0% |
[ 5.5% - 6.0% ] 5.58% | 2,704 | 98.4% |
[ 5.5% - 6.0% ] 5.77% | 81,109 | 59.9% |
[ 6.0% - 6.5% ] 6.35% | 63 | 85.0% |
[ 6.5% - 7.0% ] 6.53% | 1,990 | 98.7% |
[ 6.5% - 7.0% ] 6.83% | 1,318 | 98.5% |
[ 7.5% - 8.0% ] 7.97% | 790 | 83.6% |
[ 8.0% - 8.5% ] 8.39% | 155 | 88.3% |
[ 8.5% - 9.0% ] 8.89% | 2,564 | 100.0% |
[ 9.0% - 9.5% ] 9.41% | 574 | 99.6% |
[ 9.5% - 10.0% ] 9.59% | 1,523 | 94.9% |
[ 10.0% - 10.5% ] 10.00% | 80 | 93.5% |
[ 10.0% - 10.5% ] 10.13% | 3,338 | 100.0% |
[ 11.5% - 12.0% ] 11.73% | 341 | 100.0% |
[ 11.5% - 12.0% ] 11.90% | 462 | 100.0% |
[ 12.0% - 12.5% ] 12.34% | 154 | 100.0% |
[ 12.0% - 12.5% ] 12.36% | 437 | 100.0% |
[ 12.5% - 13.0% ] 12.64% | 1,543 | 100.0% |
[ 12.5% - 13.0% ] 12.88% | 427 | 100.0% |
[ 13.5% - 14.0% ] 13.61% | 1,102 | 100.0% |
[ 13.5% - 14.0% ] 13.77% | 138 | 100.0% |
[ 14.0% - 14.5% ] 14.19% | 867 | 100.0% |
[ 16.0% - 16.5% ] 16.02% | 181 | 100.0% |
[ 18.0% - 18.5% ] 18.25% | 126 | 80.4% |
[ 21.0% - 21.5% ] 21.10% | 891 | 100.0% |
[ 26.0% - 26.5% ] 26.24% | 202 | 100.0% |
[ 34.0% - 34.5% ] 34.31% | 274 | 100.0% |
[ 34.5% - 35.0% ] 34.62% | 26 | 100.0% |