Immigrants from Russia 3 or more Vehicles in Household
COMPARE
Immigrants from Russia
Select to Compare
3 or more Vehicles in Household
Immigrants from Russia 3 or more Vehicles in Household
16.9%
3+ VEHICLES AVAILABLE
0.1/ 100
METRIC RATING
295th/ 347
METRIC RANK
Immigrants from Russia 3 or more Vehicles in Household Correlation Chart
The statistical analysis conducted on geographies consisting of 347,621,563 people shows a moderate positive correlation between the proportion of Immigrants from Russia and percentage of households with 3 or more vehicles available in the United States with a correlation coefficient (R) of 0.482 and weighted average of 16.9%. On average, for every 1% (one percent) increase in Immigrants from Russia within a typical geography, there is an increase of 0.91% in percentage of households with 3 or more vehicles available.
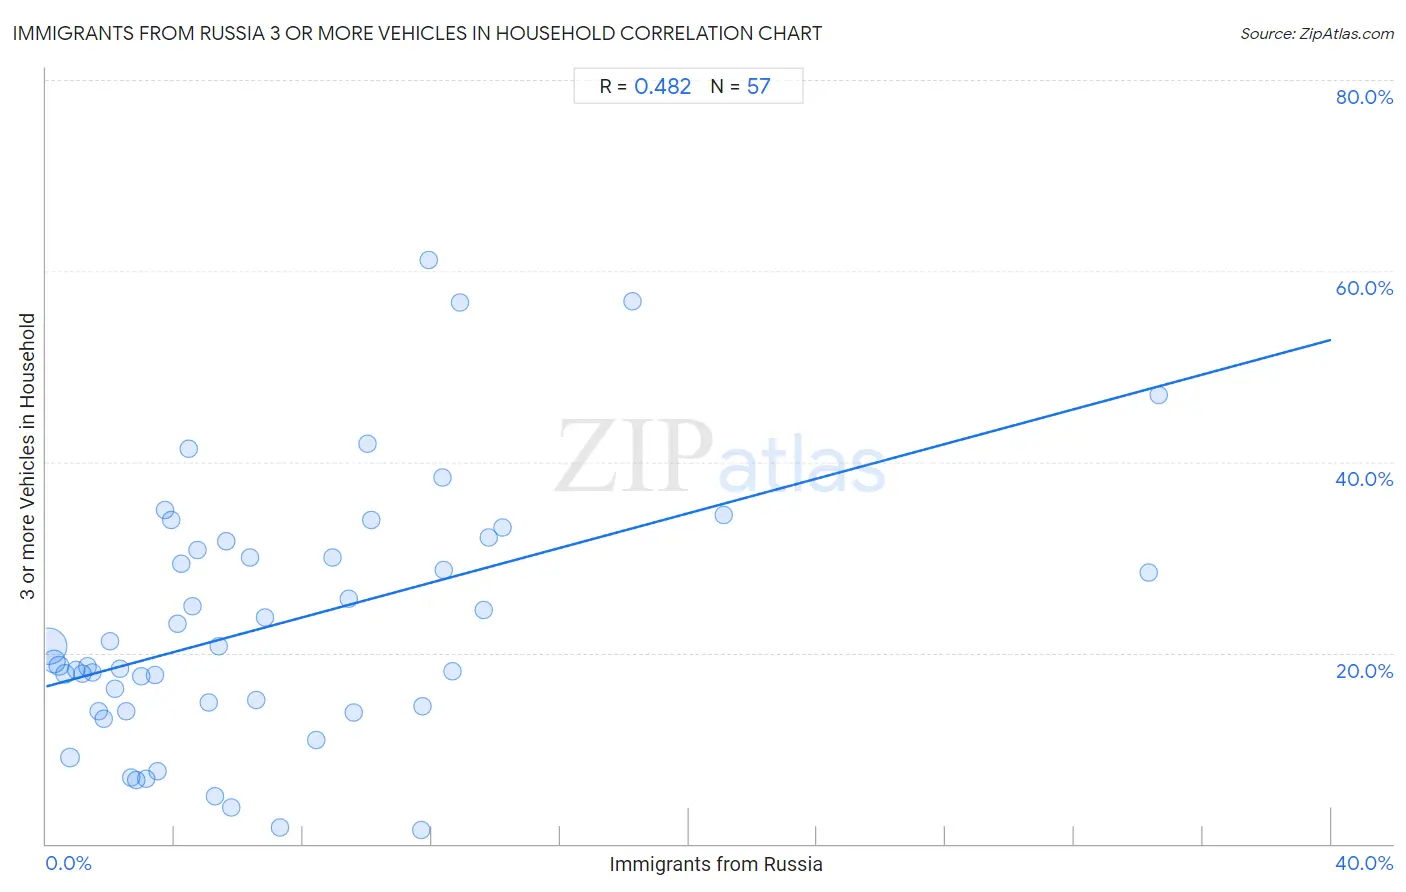
It is essential to understand that the correlation between the percentage of Immigrants from Russia and percentage of households with 3 or more vehicles available does not imply a direct cause-and-effect relationship. It remains uncertain whether the presence of Immigrants from Russia influences an upward or downward trend in the level of percentage of households with 3 or more vehicles available within an area, or if Immigrants from Russia simply ended up residing in those areas with higher or lower levels of percentage of households with 3 or more vehicles available due to other factors.
Demographics Similar to Immigrants from Russia by 3 or more Vehicles in Household
In terms of 3 or more vehicles in household, the demographic groups most similar to Immigrants from Russia are Immigrants from Western Africa (16.9%, a difference of 0.050%), Bahamian (16.9%, a difference of 0.16%), Immigrants from Spain (17.0%, a difference of 0.25%), Immigrants from Congo (17.0%, a difference of 0.36%), and Inupiat (16.9%, a difference of 0.36%).
| Demographics | Rating | Rank | 3 or more Vehicles in Household |
| Immigrants from Uruguay | 0.2 /100 | #288 | Tragic 17.1% |
| Immigrants from Liberia | 0.1 /100 | #289 | Tragic 17.1% |
| Liberians | 0.1 /100 | #290 | Tragic 17.0% |
| Immigrants from Congo | 0.1 /100 | #291 | Tragic 17.0% |
| Immigrants from Spain | 0.1 /100 | #292 | Tragic 17.0% |
| Bahamians | 0.1 /100 | #293 | Tragic 16.9% |
| Immigrants from Western Africa | 0.1 /100 | #294 | Tragic 16.9% |
| Immigrants from Russia | 0.1 /100 | #295 | Tragic 16.9% |
| Inupiat | 0.1 /100 | #296 | Tragic 16.9% |
| Israelis | 0.1 /100 | #297 | Tragic 16.8% |
| Immigrants from Zaire | 0.1 /100 | #298 | Tragic 16.7% |
| Immigrants from South America | 0.1 /100 | #299 | Tragic 16.7% |
| Cypriots | 0.0 /100 | #300 | Tragic 16.6% |
| Paraguayans | 0.0 /100 | #301 | Tragic 16.6% |
| Immigrants from Greece | 0.0 /100 | #302 | Tragic 16.5% |
Immigrants from Russia 3 or more Vehicles in Household Correlation Summary
| Measurement | Immigrants from Russia Data | 3 or more Vehicles in Household Data |
| Minimum | 0.071% | 1.4% |
| Maximum | 34.6% | 61.1% |
| Range | 34.5% | 59.7% |
| Mean | 7.2% | 23.0% |
| Median | 5.1% | 19.1% |
| Interquartile 25% (IQ1) | 2.4% | 14.1% |
| Interquartile 75% (IQ3) | 10.9% | 31.2% |
| Interquartile Range (IQR) | 8.5% | 17.1% |
| Standard Deviation (Sample) | 7.1% | 13.5% |
| Standard Deviation (Population) | 7.1% | 13.3% |
Correlation Details
| Immigrants from Russia Percentile | Sample Size | 3 or more Vehicles in Household |
[ 0.0% - 0.5% ] 0.071% | 227,456,224 | 20.7% |
[ 0.0% - 0.5% ] 0.24% | 56,804,185 | 19.1% |
[ 0.0% - 0.5% ] 0.40% | 25,615,221 | 18.6% |
[ 0.5% - 1.0% ] 0.60% | 12,682,498 | 17.8% |
[ 0.5% - 1.0% ] 0.73% | 14,341,749 | 9.0% |
[ 0.5% - 1.0% ] 0.94% | 3,285,511 | 18.2% |
[ 1.0% - 1.5% ] 1.12% | 1,871,861 | 17.8% |
[ 1.0% - 1.5% ] 1.28% | 1,528,553 | 18.5% |
[ 1.0% - 1.5% ] 1.45% | 1,147,137 | 18.0% |
[ 1.5% - 2.0% ] 1.62% | 720,995 | 13.9% |
[ 1.5% - 2.0% ] 1.78% | 289,708 | 13.1% |
[ 1.5% - 2.0% ] 1.99% | 232,677 | 21.3% |
[ 2.0% - 2.5% ] 2.13% | 274,460 | 16.2% |
[ 2.0% - 2.5% ] 2.30% | 150,263 | 18.3% |
[ 2.0% - 2.5% ] 2.49% | 118,948 | 13.8% |
[ 2.5% - 3.0% ] 2.66% | 182,256 | 6.9% |
[ 2.5% - 3.0% ] 2.81% | 261,860 | 6.6% |
[ 2.5% - 3.0% ] 2.97% | 133,358 | 17.6% |
[ 3.0% - 3.5% ] 3.12% | 128,379 | 6.8% |
[ 3.0% - 3.5% ] 3.38% | 11,700 | 17.7% |
[ 3.0% - 3.5% ] 3.46% | 52,191 | 7.6% |
[ 3.5% - 4.0% ] 3.68% | 9,462 | 34.9% |
[ 3.5% - 4.0% ] 3.89% | 5,292 | 34.0% |
[ 4.0% - 4.5% ] 4.07% | 23,266 | 23.1% |
[ 4.0% - 4.5% ] 4.19% | 22,161 | 29.3% |
[ 4.0% - 4.5% ] 4.44% | 2,768 | 41.3% |
[ 4.5% - 5.0% ] 4.54% | 1,321 | 24.9% |
[ 4.5% - 5.0% ] 4.70% | 4,064 | 30.7% |
[ 5.0% - 5.5% ] 5.08% | 7,389 | 14.8% |
[ 5.0% - 5.5% ] 5.25% | 22,677 | 5.0% |
[ 5.0% - 5.5% ] 5.36% | 261 | 20.6% |
[ 5.5% - 6.0% ] 5.58% | 2,704 | 31.7% |
[ 5.5% - 6.0% ] 5.77% | 81,109 | 3.8% |
[ 6.0% - 6.5% ] 6.35% | 63 | 30.0% |
[ 6.5% - 7.0% ] 6.53% | 1,990 | 15.1% |
[ 6.5% - 7.0% ] 6.83% | 1,318 | 23.7% |
[ 7.0% - 7.5% ] 7.28% | 47,893 | 1.8% |
[ 8.0% - 8.5% ] 8.39% | 155 | 10.8% |
[ 8.5% - 9.0% ] 8.89% | 2,564 | 30.0% |
[ 9.0% - 9.5% ] 9.41% | 574 | 25.6% |
[ 9.5% - 10.0% ] 9.59% | 1,523 | 13.8% |
[ 10.0% - 10.5% ] 10.00% | 80 | 41.9% |
[ 10.0% - 10.5% ] 10.13% | 3,338 | 34.0% |
[ 11.5% - 12.0% ] 11.66% | 83,069 | 1.4% |
[ 11.5% - 12.0% ] 11.73% | 341 | 14.4% |
[ 11.5% - 12.0% ] 11.90% | 462 | 61.1% |
[ 12.0% - 12.5% ] 12.34% | 154 | 38.4% |
[ 12.0% - 12.5% ] 12.36% | 437 | 28.7% |
[ 12.5% - 13.0% ] 12.64% | 1,543 | 18.1% |
[ 12.5% - 13.0% ] 12.88% | 427 | 56.7% |
[ 13.5% - 14.0% ] 13.61% | 1,102 | 24.4% |
[ 13.5% - 14.0% ] 13.77% | 138 | 32.1% |
[ 14.0% - 14.5% ] 14.19% | 867 | 33.1% |
[ 18.0% - 18.5% ] 18.25% | 126 | 56.9% |
[ 21.0% - 21.5% ] 21.10% | 891 | 34.5% |
[ 34.0% - 34.5% ] 34.31% | 274 | 28.4% |
[ 34.5% - 35.0% ] 34.62% | 26 | 47.1% |