Panamanian Receiving Food Stamps

COMPARE

Panamanian
Race
Ancestry
AfghanAfricanAlaska NativeAlaskan AthabascanAlbanianAleutAlsatianAmericanApacheArabArapahoArgentineanArmenianAssyrian/Chaldean/SyriacAustralianAustrianBahamianBangladeshiBarbadianBasqueBelgianBelizeanBermudanBhutaneseBlackfeetBolivianBrazilianBritishBritish West IndianBulgarianBurmeseCajunCambodianCanadianCape VerdeanCarpatho RusynCelticCentral AmericanCentral American IndianCherokeeCheyenneChickasawChileanChineseChippewaChoctawColombianColvilleComancheCosta RicanCreeCreekCroatianCrowCubanCypriotCzechCzechoslovakianDanishDelawareDominicanDutchDutch West IndianEastern EuropeanEcuadorianEgyptianEnglishEstonianEthiopianEuropeanFijianFilipinoFinnishFrenchFrench American IndianFrench CanadianGermanGerman RussianGhanaianGreekGuamanian/ChamorroGuatemalanGuyaneseHaitianHmongHonduranHopiHoumaHungarianIcelanderIndian (Asian)IndonesianInupiatIranianIraqiIrishIroquoisIsraeliItalianJamaicanJapaneseJordanianKenyanKiowaKoreanLaotianLatvianLebaneseLiberianLithuanianLumbeeLuxembourgerMacedonianMalaysianMalteseMarshalleseMenomineeMexicanMexican American IndianMongolianMoroccanNative HawaiianNavajoNepaleseNew ZealanderNicaraguanNigerianNorthern EuropeanNorwegianOkinawanOsageOttawaPaiutePakistaniPalestinianPanamanianParaguayanPennsylvania GermanPeruvianPimaPolishPortuguesePotawatomiPuebloPuerto RicanPuget Sound SalishRomanianRussianSalvadoranSamoanScandinavianScotch-IrishScottishSeminoleSenegaleseSerbianShoshoneSierra LeoneanSiouxSlavicSlovakSloveneSomaliSouth AfricanSouth AmericanSouth American IndianSoviet UnionSpaniardSpanishSpanish AmericanSpanish American IndianSri LankanSubsaharan AfricanSudaneseSwedishSwissSyrianTaiwaneseThaiTlingit-HaidaTohono O'OdhamTonganTrinidadian and TobagonianTsimshianTurkishU.S. Virgin IslanderUgandanUkrainianUruguayanUteVenezuelanVietnameseWelshWest IndianYakamaYaquiYugoslavianYumanYup'ikZimbabwean
Immigration
NonimmigrantsImmigrantsAfghanistanAfricaAlbaniaArgentinaArmeniaAsiaAustraliaAustriaBahamasBangladeshBarbadosBelarusBelgiumBelizeBoliviaBosnia and HerzegovinaBrazilBulgariaBurma/MyanmarCabo VerdeCambodiaCameroonCanadaCaribbeanCentral AmericaChileChinaColombiaCongoCosta RicaCroatiaCubaCzechoslovakiaDenmarkDominicaDominican RepublicEastern AfricaEastern AsiaEastern EuropeEcuadorEgyptEl SalvadorEnglandEritreaEthiopiaEuropeFijiFranceGermanyGhanaGreeceGrenadaGuatemalaGuyanaHaitiHondurasHong KongHungaryIndiaIndonesiaIranIraqIrelandIsraelItalyJamaicaJapanJordanKazakhstanKenyaKoreaKuwaitLaosLatin AmericaLatviaLebanonLiberiaLithuaniaMalaysiaMexicoMicronesiaMiddle AfricaMoldovaMoroccoNepalNetherlandsNicaraguaNigeriaNorth AmericaNorth MacedoniaNorthern AfricaNorthern EuropeNorwayOceaniaPakistanPanamaPeruPhilippinesPolandPortugalRomaniaRussiaSaudi ArabiaScotlandSenegalSerbiaSierra LeoneSingaporeSomaliaSouth AfricaSouth AmericaSouth Central AsiaSouth Eastern AsiaSouthern EuropeSpainSri LankaSt. Vincent and the GrenadinesSudanSwedenSwitzerlandSyriaTaiwanThailandTrinidad and TobagoTurkeyUgandaUkraineUruguayUzbekistanVenezuelaVietnamWest IndiesWestern AfricaWestern AsiaWestern EuropeYemenZaireZimbabweAzores
Select to Compare
Race
Ancestry
AfghanAfricanAlaska NativeAlaskan AthabascanAlbanianAleutAlsatianAmericanApacheArabArapahoArgentineanArmenianAssyrian/Chaldean/SyriacAustralianAustrianBahamianBangladeshiBarbadianBasqueBelgianBelizeanBermudanBhutaneseBlackfeetBolivianBrazilianBritishBritish West IndianBulgarianBurmeseCajunCambodianCanadianCape VerdeanCarpatho RusynCelticCentral AmericanCentral American IndianCherokeeCheyenneChickasawChileanChineseChippewaChoctawColombianColvilleComancheCosta RicanCreeCreekCroatianCrowCubanCypriotCzechCzechoslovakianDanishDelawareDominicanDutchDutch West IndianEastern EuropeanEcuadorianEgyptianEnglishEstonianEthiopianEuropeanFijianFilipinoFinnishFrenchFrench American IndianFrench CanadianGermanGerman RussianGhanaianGreekGuamanian/ChamorroGuatemalanGuyaneseHaitianHmongHonduranHopiHoumaHungarianIcelanderIndian (Asian)IndonesianInupiatIranianIraqiIrishIroquoisIsraeliItalianJamaicanJapaneseJordanianKenyanKiowaKoreanLaotianLatvianLebaneseLiberianLithuanianLumbeeLuxembourgerMacedonianMalaysianMalteseMarshalleseMenomineeMexicanMexican American IndianMongolianMoroccanNative HawaiianNavajoNepaleseNew ZealanderNicaraguanNigerianNorthern EuropeanNorwegianOkinawanOsageOttawaPaiutePakistaniPalestinianParaguayanPennsylvania GermanPeruvianPimaPolishPortuguesePotawatomiPuebloPuerto RicanPuget Sound SalishRomanianRussianSalvadoranSamoanScandinavianScotch-IrishScottishSeminoleSenegaleseSerbianShoshoneSierra LeoneanSiouxSlavicSlovakSloveneSomaliSouth AfricanSouth AmericanSouth American IndianSoviet UnionSpaniardSpanishSpanish AmericanSpanish American IndianSri LankanSubsaharan AfricanSudaneseSwedishSwissSyrianTaiwaneseThaiTlingit-HaidaTohono O'OdhamTonganTrinidadian and TobagonianTsimshianTurkishU.S. Virgin IslanderUgandanUkrainianUruguayanUteVenezuelanVietnameseWelshWest IndianYakamaYaquiYugoslavianYumanYup'ikZimbabwean
Immigration
NonimmigrantsImmigrantsAfghanistanAfricaAlbaniaArgentinaArmeniaAsiaAustraliaAustriaBahamasBangladeshBarbadosBelarusBelgiumBelizeBoliviaBosnia and HerzegovinaBrazilBulgariaBurma/MyanmarCabo VerdeCambodiaCameroonCanadaCaribbeanCentral AmericaChileChinaColombiaCongoCosta RicaCroatiaCubaCzechoslovakiaDenmarkDominicaDominican RepublicEastern AfricaEastern AsiaEastern EuropeEcuadorEgyptEl SalvadorEnglandEritreaEthiopiaEuropeFijiFranceGermanyGhanaGreeceGrenadaGuatemalaGuyanaHaitiHondurasHong KongHungaryIndiaIndonesiaIranIraqIrelandIsraelItalyJamaicaJapanJordanKazakhstanKenyaKoreaKuwaitLaosLatin AmericaLatviaLebanonLiberiaLithuaniaMalaysiaMexicoMicronesiaMiddle AfricaMoldovaMoroccoNepalNetherlandsNicaraguaNigeriaNorth AmericaNorth MacedoniaNorthern AfricaNorthern EuropeNorwayOceaniaPakistanPanamaPeruPhilippinesPolandPortugalRomaniaRussiaSaudi ArabiaScotlandSenegalSerbiaSierra LeoneSingaporeSomaliaSouth AfricaSouth AmericaSouth Central AsiaSouth Eastern AsiaSouthern EuropeSpainSri LankaSt. Vincent and the GrenadinesSudanSwedenSwitzerlandSyriaTaiwanThailandTrinidad and TobagoTurkeyUgandaUkraineUruguayUzbekistanVenezuelaVietnamWest IndiesWestern AfricaWestern AsiaWestern EuropeYemenZaireZimbabweAzores
Receiving Food Stamps
Income
Poverty
Unemployment
Labor Participation
Family Structure
Vehicle Availability
Education Level
Disability

Panamanian Receiving Food Stamps
Tragic

13.1%
PUBLIC INCOME | FOOD STAMPS
3.5/ 100
METRIC RATING
228th/ 347
METRIC RANK

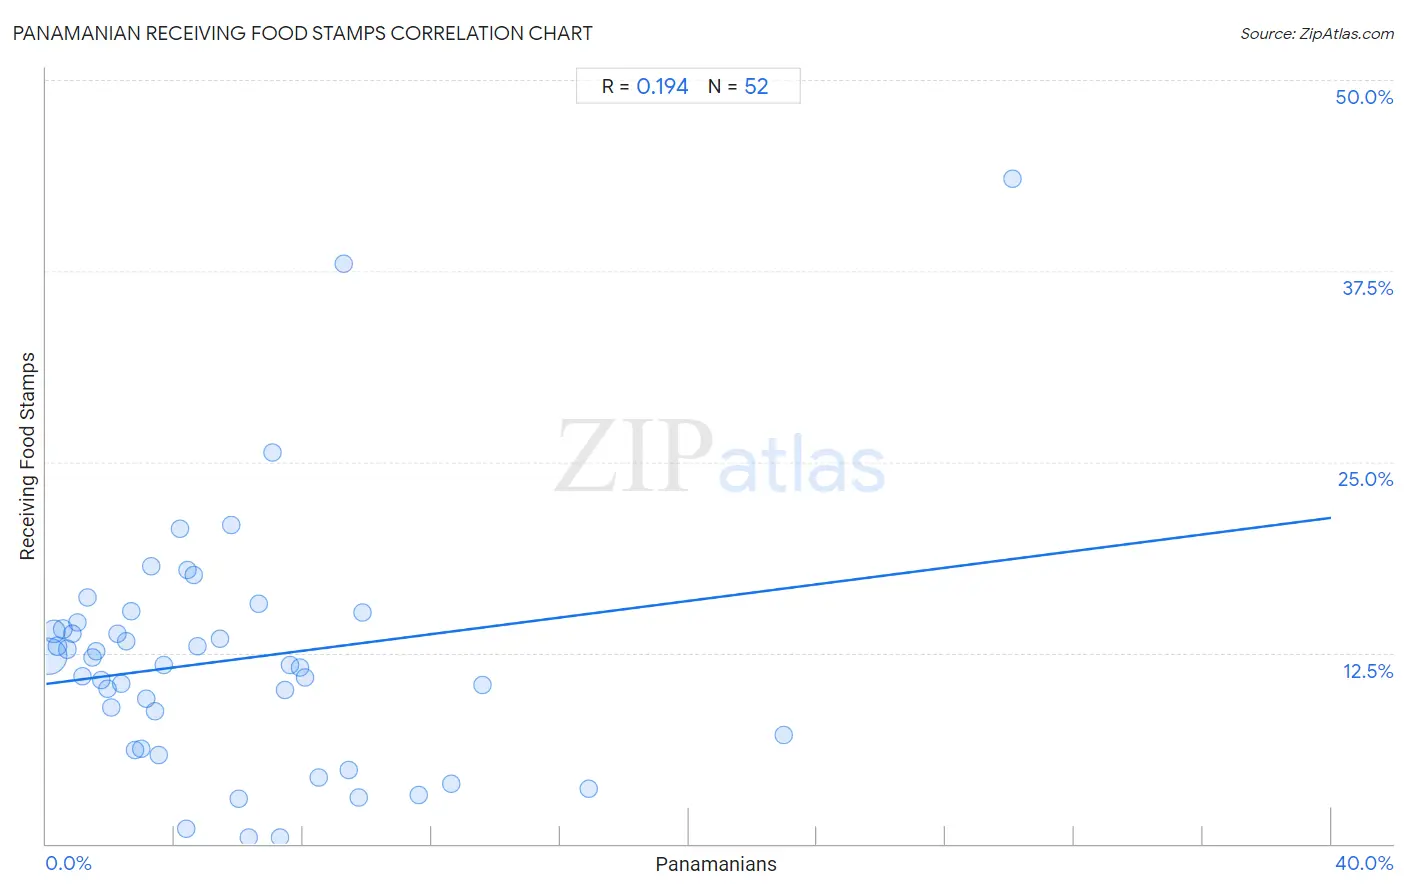
Panamanian Receiving Food Stamps Correlation Chart

The statistical analysis conducted on geographies consisting of 280,789,065 people shows a poor positive correlation between the proportion of Panamanians and percentage of population receiving government assistance and/or food stamps in the United States with a correlation coefficient (R) of 0.194 and weighted average of 13.1%. On average, for every 1% (one percent) increase in Panamanians within a typical geography, there is an increase of 0.27% in percentage of population receiving government assistance and/or food stamps.
Panamanian Receiving Food Stamps
It is essential to understand that the correlation between the percentage of Panamanians and percentage of population receiving government assistance and/or food stamps does not imply a direct cause-and-effect relationship. It remains uncertain whether the presence of Panamanians influences an upward or downward trend in the level of percentage of population receiving government assistance and/or food stamps within an area, or if Panamanians simply ended up residing in those areas with higher or lower levels of percentage of population receiving government assistance and/or food stamps due to other factors.

Demographics Similar to Panamanians by Receiving Food Stamps

In terms of receiving food stamps, the demographic groups most similar to Panamanians are Nigerian (13.1%, a difference of 0.010%), Ottawa (13.1%, a difference of 0.010%), Chickasaw (13.1%, a difference of 0.050%), Puget Sound Salish (13.1%, a difference of 0.060%), and Immigrants from Nigeria (13.1%, a difference of 0.10%).
DemographicsRating | RankReceiving Food Stamps
Bermudans
4.8
/100
|
#221
Tragic
13.0%
Immigrants
4.4
/100
|
#222
Tragic
13.0%
Immigrants from Albania
4.4
/100
|
#223
Tragic
13.0%
Immigrants from Armenia
4.3
/100
|
#224
Tragic
13.0%
Fijians
4.3
/100
|
#225
Tragic
13.0%
Chickasaw
3.6
/100
|
#226
Tragic
13.1%
Nigerians
3.5
/100
|
#227
Tragic
13.1%
Panamanians
3.5
/100
|
#228
Tragic
13.1%
Ottawa
3.5
/100
|
#229
Tragic
13.1%
Puget Sound Salish
3.4
/100
|
#230
Tragic
13.1%
Immigrants from Nigeria
3.4
/100
|
#231
Tragic
13.1%
Salvadorans
2.7
/100
|
#232
Tragic
13.2%
Cherokee
2.5
/100
|
#233
Tragic
13.2%
Comanche
2.4
/100
|
#234
Tragic
13.3%
Immigrants from Zaire
1.9
/100
|
#235
Tragic
13.4%

Panamanian Receiving Food Stamps Correlation Summary

MeasurementPanamanian DataReceiving Food Stamps Data
Minimum0.062%0.40%
Maximum30.1%43.5%
Range30.0%43.1%
Mean5.7%12.0%
Median4.3%11.7%
Interquartile 25% (IQ1)2.0%6.6%
Interquartile 75% (IQ3)7.7%14.3%
Interquartile Range (IQR)5.8%7.6%
Standard Deviation (Sample)5.7%8.0%
Standard Deviation (Population)5.6%7.9%

Correlation Details

Panamanian PercentileSample SizeReceiving Food Stamps
[
0.0%
-
0.5%
]
0.062%
200,052,92412.3%
[
0.0%
-
0.5%
]
0.22%
51,330,58213.9%
[
0.0%
-
0.5%
]
0.36%
14,215,91113.0%
[
0.5%
-
1.0%
]
0.52%
6,327,39014.1%
[
0.5%
-
1.0%
]
0.67%
3,191,97112.7%
[
0.5%
-
1.0%
]
0.83%
1,892,98913.8%
[
0.5%
-
1.0%
]
0.97%
1,407,47614.5%
[
1.0%
-
1.5%
]
1.12%
607,24211.0%
[
1.0%
-
1.5%
]
1.26%
545,69116.1%
[
1.0%
-
1.5%
]
1.43%
348,23312.2%
[
1.5%
-
2.0%
]
1.55%
430,61212.6%
[
1.5%
-
2.0%
]
1.70%
123,17110.8%
[
1.5%
-
2.0%
]
1.92%
39,13510.1%
[
2.0%
-
2.5%
]
2.03%
51,3749.0%
[
2.0%
-
2.5%
]
2.24%
17,79213.7%
[
2.0%
-
2.5%
]
2.33%
38,71910.5%
[
2.5%
-
3.0%
]
2.50%
9,54213.2%
[
2.5%
-
3.0%
]
2.65%
15,38115.2%
[
2.5%
-
3.0%
]
2.78%
36,1756.1%
[
2.5%
-
3.0%
]
2.95%
9,0586.2%
[
3.0%
-
3.5%
]
3.11%
30,2679.5%
[
3.0%
-
3.5%
]
3.27%
8,55918.1%
[
3.0%
-
3.5%
]
3.37%
13,7988.7%
[
3.5%
-
4.0%
]
3.52%
6545.8%
[
3.5%
-
4.0%
]
3.66%
1,25811.7%
[
4.0%
-
4.5%
]
4.15%
4,55020.7%
[
4.0%
-
4.5%
]
4.36%
4821.0%
[
4.0%
-
4.5%
]
4.41%
5,00917.9%
[
4.5%
-
5.0%
]
4.60%
63117.6%
[
4.5%
-
5.0%
]
4.71%
4,03312.9%
[
5.0%
-
5.5%
]
5.39%
7,04413.4%
[
5.5%
-
6.0%
]
5.75%
99120.9%
[
5.5%
-
6.0%
]
5.99%
7,7793.0%
[
6.0%
-
6.5%
]
6.29%
8740.40%
[
6.5%
-
7.0%
]
6.60%
1,43915.7%
[
7.0%
-
7.5%
]
7.06%
1,47325.6%
[
7.0%
-
7.5%
]
7.28%
1,0720.40%
[
7.0%
-
7.5%
]
7.44%
24210.1%
[
7.5%
-
8.0%
]
7.58%
39611.7%
[
7.5%
-
8.0%
]
7.89%
2,72411.5%
[
8.0%
-
8.5%
]
8.05%
23610.9%
[
8.0%
-
8.5%
]
8.49%
3184.4%
[
9.0%
-
9.5%
]
9.24%
35738.0%
[
9.0%
-
9.5%
]
9.41%
2024.8%
[
9.5%
-
10.0%
]
9.73%
5143.0%
[
9.5%
-
10.0%
]
9.84%
18315.1%
[
11.5%
-
12.0%
]
11.58%
1,0023.2%
[
12.5%
-
13.0%
]
12.59%
1353.9%
[
13.5%
-
14.0%
]
13.58%
97210.4%
[
16.5%
-
17.0%
]
16.89%
2963.6%
[
22.5%
-
23.0%
]
22.97%
747.1%
[
30.0%
-
30.5%
]
30.08%
13343.5%