Panamanian 3 or more Vehicles in Household
COMPARE
Panamanian
Select to Compare
3 or more Vehicles in Household
Panamanian 3 or more Vehicles in Household
18.8%
3+ VEHICLES AVAILABLE
11.6/ 100
METRIC RATING
212th/ 347
METRIC RANK
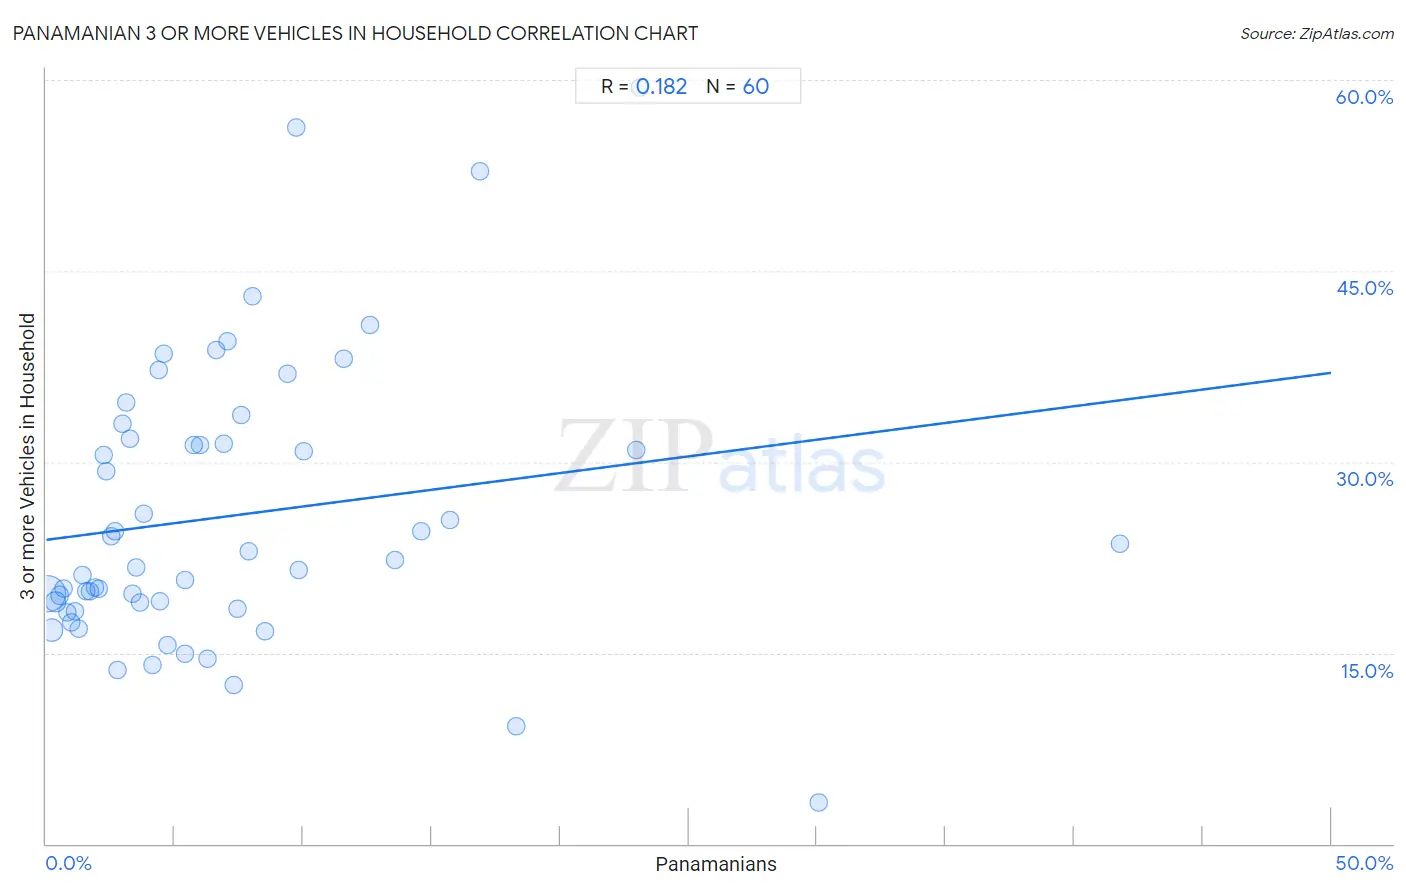
Panamanian 3 or more Vehicles in Household Correlation Chart
The statistical analysis conducted on geographies consisting of 281,018,762 people shows a poor positive correlation between the proportion of Panamanians and percentage of households with 3 or more vehicles available in the United States with a correlation coefficient (R) of 0.182 and weighted average of 18.8%. On average, for every 1% (one percent) increase in Panamanians within a typical geography, there is an increase of 0.26% in percentage of households with 3 or more vehicles available.
It is essential to understand that the correlation between the percentage of Panamanians and percentage of households with 3 or more vehicles available does not imply a direct cause-and-effect relationship. It remains uncertain whether the presence of Panamanians influences an upward or downward trend in the level of percentage of households with 3 or more vehicles available within an area, or if Panamanians simply ended up residing in those areas with higher or lower levels of percentage of households with 3 or more vehicles available due to other factors.
Demographics Similar to Panamanians by 3 or more Vehicles in Household
In terms of 3 or more vehicles in household, the demographic groups most similar to Panamanians are Immigrants from Cuba (18.8%, a difference of 0.010%), Immigrants from Kenya (18.8%, a difference of 0.14%), Immigrants from Sierra Leone (18.7%, a difference of 0.16%), Eastern European (18.7%, a difference of 0.21%), and Bulgarian (18.8%, a difference of 0.26%).
| Demographics | Rating | Rank | 3 or more Vehicles in Household |
| Russians | 14.2 /100 | #205 | Poor 18.8% |
| Immigrants from Eastern Asia | 14.1 /100 | #206 | Poor 18.8% |
| Immigrants from Chile | 13.6 /100 | #207 | Poor 18.8% |
| Immigrants from Burma/Myanmar | 13.6 /100 | #208 | Poor 18.8% |
| Immigrants from Egypt | 13.5 /100 | #209 | Poor 18.8% |
| Bulgarians | 13.1 /100 | #210 | Poor 18.8% |
| Immigrants from Kenya | 12.4 /100 | #211 | Poor 18.8% |
| Panamanians | 11.6 /100 | #212 | Poor 18.8% |
| Immigrants from Cuba | 11.6 /100 | #213 | Poor 18.8% |
| Immigrants from Sierra Leone | 10.8 /100 | #214 | Poor 18.7% |
| Eastern Europeans | 10.6 /100 | #215 | Poor 18.7% |
| Immigrants from Nigeria | 10.3 /100 | #216 | Poor 18.7% |
| Immigrants from Italy | 10.2 /100 | #217 | Poor 18.7% |
| Immigrants from Portugal | 8.9 /100 | #218 | Tragic 18.6% |
| Immigrants from Armenia | 8.6 /100 | #219 | Tragic 18.6% |
Panamanian 3 or more Vehicles in Household Correlation Summary
| Measurement | Panamanian Data | 3 or more Vehicles in Household Data |
| Minimum | 0.062% | 3.2% |
| Maximum | 41.8% | 59.4% |
| Range | 41.7% | 56.1% |
| Mean | 7.2% | 25.7% |
| Median | 4.7% | 22.0% |
| Interquartile 25% (IQ1) | 2.3% | 18.7% |
| Interquartile 75% (IQ3) | 8.9% | 31.6% |
| Interquartile Range (IQR) | 6.7% | 12.9% |
| Standard Deviation (Sample) | 7.7% | 11.1% |
| Standard Deviation (Population) | 7.6% | 11.0% |
Correlation Details
| Panamanian Percentile | Sample Size | 3 or more Vehicles in Household |
[ 0.0% - 0.5% ] 0.062% | 200,128,177 | 19.7% |
[ 0.0% - 0.5% ] 0.22% | 51,356,250 | 16.8% |
[ 0.0% - 0.5% ] 0.36% | 14,269,138 | 19.0% |
[ 0.5% - 1.0% ] 0.52% | 6,335,680 | 19.5% |
[ 0.5% - 1.0% ] 0.67% | 3,204,358 | 20.0% |
[ 0.5% - 1.0% ] 0.83% | 1,903,703 | 18.2% |
[ 0.5% - 1.0% ] 0.97% | 1,412,066 | 17.4% |
[ 1.0% - 1.5% ] 1.12% | 611,551 | 18.3% |
[ 1.0% - 1.5% ] 1.27% | 554,477 | 16.9% |
[ 1.0% - 1.5% ] 1.43% | 350,072 | 21.2% |
[ 1.5% - 2.0% ] 1.55% | 430,612 | 19.8% |
[ 1.5% - 2.0% ] 1.70% | 128,561 | 19.9% |
[ 1.5% - 2.0% ] 1.91% | 44,469 | 20.1% |
[ 2.0% - 2.5% ] 2.03% | 53,753 | 20.1% |
[ 2.0% - 2.5% ] 2.23% | 19,518 | 30.5% |
[ 2.0% - 2.5% ] 2.33% | 41,619 | 29.3% |
[ 2.5% - 3.0% ] 2.50% | 9,621 | 24.2% |
[ 2.5% - 3.0% ] 2.65% | 15,381 | 24.6% |
[ 2.5% - 3.0% ] 2.78% | 36,175 | 13.6% |
[ 2.5% - 3.0% ] 2.95% | 9,502 | 33.0% |
[ 3.0% - 3.5% ] 3.11% | 30,267 | 34.6% |
[ 3.0% - 3.5% ] 3.27% | 8,559 | 31.8% |
[ 3.0% - 3.5% ] 3.37% | 13,798 | 19.6% |
[ 3.5% - 4.0% ] 3.52% | 654 | 21.7% |
[ 3.5% - 4.0% ] 3.66% | 1,258 | 19.0% |
[ 3.5% - 4.0% ] 3.81% | 1,759 | 26.0% |
[ 4.0% - 4.5% ] 4.15% | 4,550 | 14.1% |
[ 4.0% - 4.5% ] 4.36% | 482 | 37.3% |
[ 4.0% - 4.5% ] 4.41% | 5,009 | 19.1% |
[ 4.5% - 5.0% ] 4.60% | 631 | 38.5% |
[ 4.5% - 5.0% ] 4.71% | 4,033 | 15.6% |
[ 5.0% - 5.5% ] 5.39% | 7,901 | 20.8% |
[ 5.0% - 5.5% ] 5.42% | 166 | 14.9% |
[ 5.5% - 6.0% ] 5.75% | 991 | 31.3% |
[ 5.5% - 6.0% ] 5.99% | 7,779 | 31.3% |
[ 6.0% - 6.5% ] 6.29% | 874 | 14.6% |
[ 6.5% - 7.0% ] 6.60% | 1,439 | 38.8% |
[ 6.5% - 7.0% ] 6.90% | 507 | 31.5% |
[ 7.0% - 7.5% ] 7.06% | 1,841 | 39.5% |
[ 7.0% - 7.5% ] 7.28% | 1,072 | 12.5% |
[ 7.0% - 7.5% ] 7.43% | 323 | 18.5% |
[ 7.5% - 8.0% ] 7.58% | 396 | 33.7% |
[ 7.5% - 8.0% ] 7.89% | 2,724 | 23.0% |
[ 8.0% - 8.5% ] 8.02% | 1,047 | 43.0% |
[ 8.0% - 8.5% ] 8.49% | 318 | 16.7% |
[ 9.0% - 9.5% ] 9.41% | 202 | 36.9% |
[ 9.5% - 10.0% ] 9.73% | 514 | 56.2% |
[ 9.5% - 10.0% ] 9.84% | 183 | 21.5% |
[ 10.0% - 10.5% ] 10.00% | 740 | 30.9% |
[ 11.5% - 12.0% ] 11.58% | 1,002 | 38.1% |
[ 12.5% - 13.0% ] 12.59% | 135 | 40.8% |
[ 13.5% - 14.0% ] 13.58% | 972 | 22.2% |
[ 14.5% - 15.0% ] 14.61% | 219 | 24.6% |
[ 15.5% - 16.0% ] 15.70% | 414 | 25.4% |
[ 16.5% - 17.0% ] 16.89% | 296 | 52.8% |
[ 18.0% - 18.5% ] 18.29% | 175 | 9.3% |
[ 22.5% - 23.0% ] 22.97% | 74 | 31.0% |
[ 23.0% - 23.5% ] 23.10% | 381 | 59.4% |
[ 30.0% - 30.5% ] 30.08% | 133 | 3.2% |
[ 41.5% - 42.0% ] 41.76% | 261 | 23.5% |