Panamanian Male Disability
COMPARE
Panamanian
Select to Compare
Male Disability
Panamanian Male Disability
11.7%
DISABILITY | MALES
3.8/ 100
METRIC RATING
219th/ 347
METRIC RANK
Panamanian Male Disability Correlation Chart
The statistical analysis conducted on geographies consisting of 281,191,975 people shows a mild positive correlation between the proportion of Panamanians and percentage of males with a disability in the United States with a correlation coefficient (R) of 0.385 and weighted average of 11.7%. On average, for every 1% (one percent) increase in Panamanians within a typical geography, there is an increase of 0.59% in percentage of males with a disability.
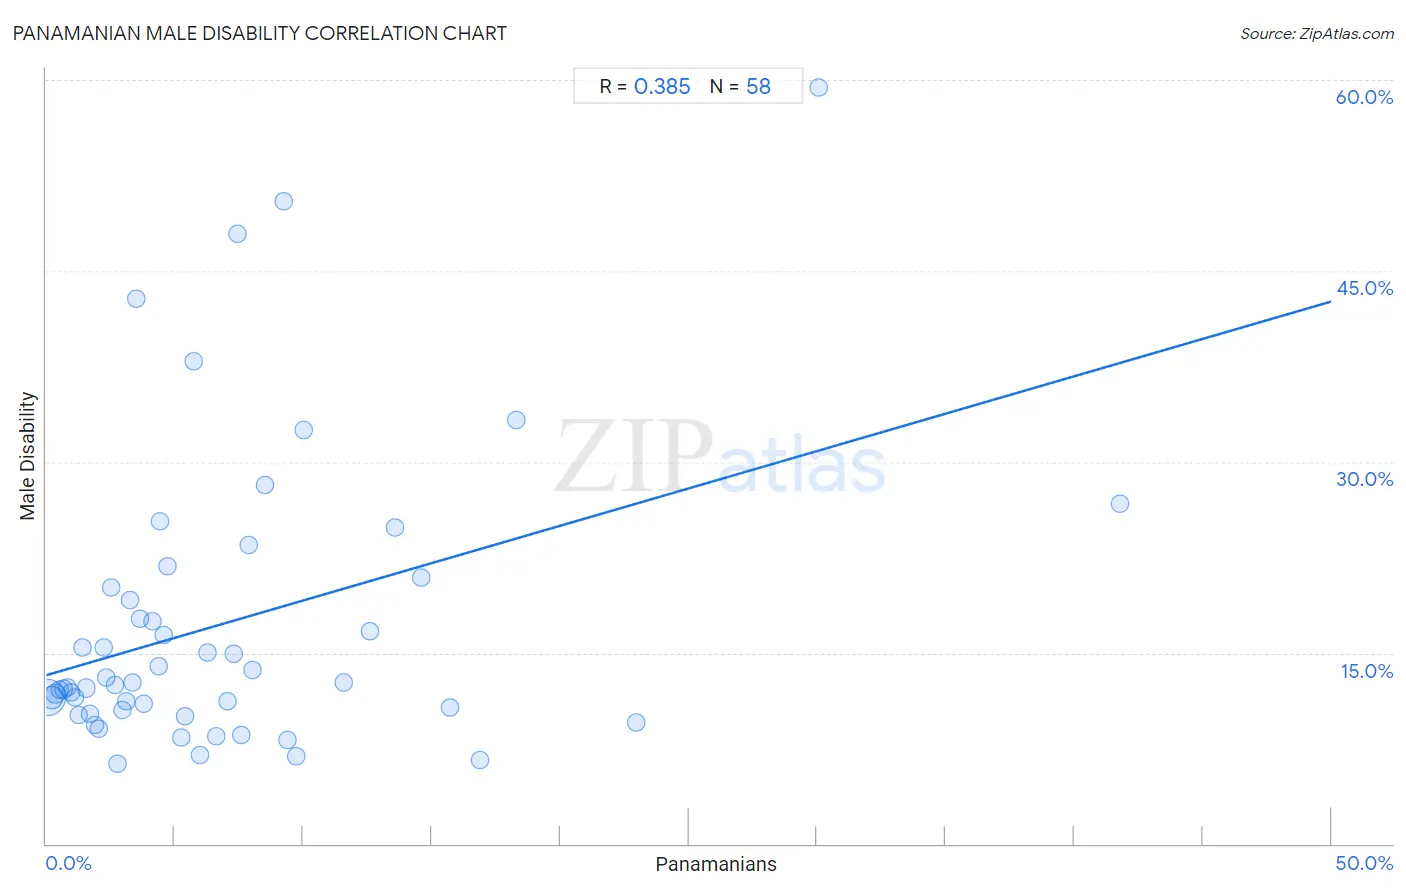
It is essential to understand that the correlation between the percentage of Panamanians and percentage of males with a disability does not imply a direct cause-and-effect relationship. It remains uncertain whether the presence of Panamanians influences an upward or downward trend in the level of percentage of males with a disability within an area, or if Panamanians simply ended up residing in those areas with higher or lower levels of percentage of males with a disability due to other factors.
Demographics Similar to Panamanians by Male Disability
In terms of male disability, the demographic groups most similar to Panamanians are Immigrants from Western Europe (11.7%, a difference of 0.010%), Immigrants from Congo (11.7%, a difference of 0.020%), Immigrants from England (11.7%, a difference of 0.060%), Alsatian (11.7%, a difference of 0.17%), and Immigrants from Bahamas (11.7%, a difference of 0.26%).
| Demographics | Rating | Rank | Male Disability |
| Immigrants from Scotland | 8.2 /100 | #212 | Tragic 11.6% |
| Mexican American Indians | 7.8 /100 | #213 | Tragic 11.6% |
| Lithuanians | 6.6 /100 | #214 | Tragic 11.6% |
| Indonesians | 5.9 /100 | #215 | Tragic 11.6% |
| Immigrants from Dominican Republic | 4.9 /100 | #216 | Tragic 11.7% |
| Immigrants from Dominica | 4.6 /100 | #217 | Tragic 11.7% |
| Immigrants from England | 4.0 /100 | #218 | Tragic 11.7% |
| Panamanians | 3.8 /100 | #219 | Tragic 11.7% |
| Immigrants from Western Europe | 3.8 /100 | #220 | Tragic 11.7% |
| Immigrants from Congo | 3.7 /100 | #221 | Tragic 11.7% |
| Alsatians | 3.3 /100 | #222 | Tragic 11.7% |
| Immigrants from Bahamas | 3.2 /100 | #223 | Tragic 11.7% |
| Japanese | 3.1 /100 | #224 | Tragic 11.7% |
| Liberians | 3.1 /100 | #225 | Tragic 11.8% |
| Sub-Saharan Africans | 2.8 /100 | #226 | Tragic 11.8% |
Panamanian Male Disability Correlation Summary
| Measurement | Panamanian Data | Male Disability Data |
| Minimum | 0.062% | 6.3% |
| Maximum | 41.8% | 59.5% |
| Range | 41.7% | 53.2% |
| Mean | 6.9% | 17.3% |
| Median | 4.5% | 12.6% |
| Interquartile 25% (IQ1) | 2.2% | 10.5% |
| Interquartile 75% (IQ3) | 8.5% | 20.1% |
| Interquartile Range (IQR) | 6.3% | 9.6% |
| Standard Deviation (Sample) | 7.5% | 11.5% |
| Standard Deviation (Population) | 7.4% | 11.4% |
Correlation Details
| Panamanian Percentile | Sample Size | Male Disability |
[ 0.0% - 0.5% ] 0.062% | 200,165,515 | 11.5% |
[ 0.0% - 0.5% ] 0.22% | 51,412,830 | 11.4% |
[ 0.0% - 0.5% ] 0.36% | 14,317,845 | 11.8% |
[ 0.5% - 1.0% ] 0.52% | 6,351,032 | 12.1% |
[ 0.5% - 1.0% ] 0.67% | 3,217,123 | 12.1% |
[ 0.5% - 1.0% ] 0.83% | 1,903,703 | 12.3% |
[ 0.5% - 1.0% ] 0.97% | 1,412,981 | 11.8% |
[ 1.0% - 1.5% ] 1.12% | 613,930 | 11.5% |
[ 1.0% - 1.5% ] 1.27% | 556,852 | 10.1% |
[ 1.0% - 1.5% ] 1.43% | 349,113 | 15.4% |
[ 1.5% - 2.0% ] 1.55% | 428,694 | 12.2% |
[ 1.5% - 2.0% ] 1.70% | 128,561 | 10.2% |
[ 1.5% - 2.0% ] 1.91% | 44,469 | 9.4% |
[ 2.0% - 2.5% ] 2.03% | 53,162 | 9.0% |
[ 2.0% - 2.5% ] 2.23% | 19,518 | 15.4% |
[ 2.0% - 2.5% ] 2.33% | 42,195 | 13.1% |
[ 2.5% - 3.0% ] 2.50% | 9,621 | 20.1% |
[ 2.5% - 3.0% ] 2.65% | 15,381 | 12.5% |
[ 2.5% - 3.0% ] 2.78% | 36,578 | 6.3% |
[ 2.5% - 3.0% ] 2.95% | 9,502 | 10.5% |
[ 3.0% - 3.5% ] 3.11% | 30,267 | 11.2% |
[ 3.0% - 3.5% ] 3.27% | 8,559 | 19.1% |
[ 3.0% - 3.5% ] 3.37% | 13,798 | 12.7% |
[ 3.5% - 4.0% ] 3.52% | 654 | 42.8% |
[ 3.5% - 4.0% ] 3.66% | 1,258 | 17.7% |
[ 3.5% - 4.0% ] 3.81% | 1,759 | 11.0% |
[ 4.0% - 4.5% ] 4.15% | 4,550 | 17.4% |
[ 4.0% - 4.5% ] 4.36% | 482 | 13.9% |
[ 4.0% - 4.5% ] 4.41% | 5,009 | 25.4% |
[ 4.5% - 5.0% ] 4.60% | 631 | 16.4% |
[ 4.5% - 5.0% ] 4.71% | 4,033 | 21.8% |
[ 5.0% - 5.5% ] 5.26% | 171 | 8.3% |
[ 5.0% - 5.5% ] 5.39% | 7,901 | 10.1% |
[ 5.5% - 6.0% ] 5.75% | 991 | 37.9% |
[ 5.5% - 6.0% ] 5.99% | 7,779 | 7.0% |
[ 6.0% - 6.5% ] 6.29% | 874 | 15.0% |
[ 6.5% - 7.0% ] 6.60% | 1,439 | 8.4% |
[ 7.0% - 7.5% ] 7.06% | 1,841 | 11.2% |
[ 7.0% - 7.5% ] 7.28% | 1,072 | 15.0% |
[ 7.0% - 7.5% ] 7.43% | 323 | 47.9% |
[ 7.5% - 8.0% ] 7.58% | 396 | 8.5% |
[ 7.5% - 8.0% ] 7.89% | 2,724 | 23.5% |
[ 8.0% - 8.5% ] 8.02% | 1,047 | 13.7% |
[ 8.0% - 8.5% ] 8.49% | 318 | 28.2% |
[ 9.0% - 9.5% ] 9.24% | 357 | 50.4% |
[ 9.0% - 9.5% ] 9.41% | 202 | 8.1% |
[ 9.5% - 10.0% ] 9.73% | 514 | 6.9% |
[ 10.0% - 10.5% ] 10.00% | 740 | 32.5% |
[ 11.5% - 12.0% ] 11.58% | 1,002 | 12.7% |
[ 12.5% - 13.0% ] 12.59% | 135 | 16.7% |
[ 13.5% - 14.0% ] 13.58% | 972 | 24.8% |
[ 14.5% - 15.0% ] 14.61% | 219 | 20.9% |
[ 15.5% - 16.0% ] 15.70% | 414 | 10.7% |
[ 16.5% - 17.0% ] 16.89% | 296 | 6.5% |
[ 18.0% - 18.5% ] 18.29% | 175 | 33.3% |
[ 22.5% - 23.0% ] 22.97% | 74 | 9.5% |
[ 30.0% - 30.5% ] 30.08% | 133 | 59.5% |
[ 41.5% - 42.0% ] 41.76% | 261 | 26.7% |