Immigrants from Dominica vs Immigrants from Western Africa GED/Equivalency

COMPARE

Immigrants from Dominica
Race
Ancestry
AfghanAfricanAlaska NativeAlaskan AthabascanAlbanianAleutAlsatianAmericanApacheArabArapahoArgentineanArmenianAssyrian/Chaldean/SyriacAustralianAustrianBahamianBangladeshiBarbadianBasqueBelgianBelizeanBermudanBhutaneseBlackfeetBolivianBrazilianBritishBritish West IndianBulgarianBurmeseCajunCambodianCanadianCape VerdeanCarpatho RusynCelticCentral AmericanCentral American IndianCherokeeCheyenneChickasawChileanChineseChippewaChoctawColombianColvilleComancheCosta RicanCreeCreekCroatianCrowCubanCypriotCzechCzechoslovakianDanishDelawareDominicanDutchDutch West IndianEastern EuropeanEcuadorianEgyptianEnglishEstonianEthiopianEuropeanFijianFilipinoFinnishFrenchFrench American IndianFrench CanadianGermanGerman RussianGhanaianGreekGuamanian/ChamorroGuatemalanGuyaneseHaitianHmongHonduranHopiHoumaHungarianIcelanderIndian (Asian)IndonesianInupiatIranianIraqiIrishIroquoisIsraeliItalianJamaicanJapaneseJordanianKenyanKiowaKoreanLaotianLatvianLebaneseLiberianLithuanianLumbeeLuxembourgerMacedonianMalaysianMalteseMarshalleseMenomineeMexicanMexican American IndianMongolianMoroccanNative HawaiianNavajoNepaleseNew ZealanderNicaraguanNigerianNorthern EuropeanNorwegianOkinawanOsageOttawaPaiutePakistaniPalestinianPanamanianParaguayanPennsylvania GermanPeruvianPimaPolishPortuguesePotawatomiPuebloPuerto RicanPuget Sound SalishRomanianRussianSalvadoranSamoanScandinavianScotch-IrishScottishSeminoleSenegaleseSerbianShoshoneSierra LeoneanSiouxSlavicSlovakSloveneSomaliSouth AfricanSouth AmericanSouth American IndianSoviet UnionSpaniardSpanishSpanish AmericanSpanish American IndianSri LankanSubsaharan AfricanSudaneseSwedishSwissSyrianTaiwaneseThaiTlingit-HaidaTohono O'OdhamTonganTrinidadian and TobagonianTsimshianTurkishU.S. Virgin IslanderUgandanUkrainianUruguayanUteVenezuelanVietnameseWelshWest IndianYakamaYaquiYugoslavianYumanYup'ikZimbabwean
Immigration
NonimmigrantsImmigrantsAfghanistanAfricaAlbaniaArgentinaArmeniaAsiaAustraliaAustriaBahamasBangladeshBarbadosBelarusBelgiumBelizeBoliviaBosnia and HerzegovinaBrazilBulgariaBurma/MyanmarCabo VerdeCambodiaCameroonCanadaCaribbeanCentral AmericaChileChinaColombiaCongoCosta RicaCroatiaCubaCzechoslovakiaDenmarkDominicaDominican RepublicEastern AfricaEastern AsiaEastern EuropeEcuadorEgyptEl SalvadorEnglandEritreaEthiopiaEuropeFijiFranceGermanyGhanaGreeceGrenadaGuatemalaGuyanaHaitiHondurasHong KongHungaryIndiaIndonesiaIranIraqIrelandIsraelItalyJamaicaJapanJordanKazakhstanKenyaKoreaKuwaitLaosLatin AmericaLatviaLebanonLiberiaLithuaniaMalaysiaMexicoMicronesiaMiddle AfricaMoldovaMoroccoNepalNetherlandsNicaraguaNigeriaNorth AmericaNorth MacedoniaNorthern AfricaNorthern EuropeNorwayOceaniaPakistanPanamaPeruPhilippinesPolandPortugalRomaniaRussiaSaudi ArabiaScotlandSenegalSerbiaSierra LeoneSingaporeSomaliaSouth AfricaSouth AmericaSouth Central AsiaSouth Eastern AsiaSouthern EuropeSpainSri LankaSt. Vincent and the GrenadinesSudanSwedenSwitzerlandSyriaTaiwanThailandTrinidad and TobagoTurkeyUgandaUkraineUruguayUzbekistanVenezuelaVietnamWest IndiesWestern AsiaWestern EuropeYemenZaireZimbabweAzores
Immigrants from Western Africa
Race
Ancestry
AfghanAfricanAlaska NativeAlaskan AthabascanAlbanianAleutAlsatianAmericanApacheArabArapahoArgentineanArmenianAssyrian/Chaldean/SyriacAustralianAustrianBahamianBangladeshiBarbadianBasqueBelgianBelizeanBermudanBhutaneseBlackfeetBolivianBrazilianBritishBritish West IndianBulgarianBurmeseCajunCambodianCanadianCape VerdeanCarpatho RusynCelticCentral AmericanCentral American IndianCherokeeCheyenneChickasawChileanChineseChippewaChoctawColombianColvilleComancheCosta RicanCreeCreekCroatianCrowCubanCypriotCzechCzechoslovakianDanishDelawareDominicanDutchDutch West IndianEastern EuropeanEcuadorianEgyptianEnglishEstonianEthiopianEuropeanFijianFilipinoFinnishFrenchFrench American IndianFrench CanadianGermanGerman RussianGhanaianGreekGuamanian/ChamorroGuatemalanGuyaneseHaitianHmongHonduranHopiHoumaHungarianIcelanderIndian (Asian)IndonesianInupiatIranianIraqiIrishIroquoisIsraeliItalianJamaicanJapaneseJordanianKenyanKiowaKoreanLaotianLatvianLebaneseLiberianLithuanianLumbeeLuxembourgerMacedonianMalaysianMalteseMarshalleseMenomineeMexicanMexican American IndianMongolianMoroccanNative HawaiianNavajoNepaleseNew ZealanderNicaraguanNigerianNorthern EuropeanNorwegianOkinawanOsageOttawaPaiutePakistaniPalestinianPanamanianParaguayanPennsylvania GermanPeruvianPimaPolishPortuguesePotawatomiPuebloPuerto RicanPuget Sound SalishRomanianRussianSalvadoranSamoanScandinavianScotch-IrishScottishSeminoleSenegaleseSerbianShoshoneSierra LeoneanSiouxSlavicSlovakSloveneSomaliSouth AfricanSouth AmericanSouth American IndianSoviet UnionSpaniardSpanishSpanish AmericanSpanish American IndianSri LankanSubsaharan AfricanSudaneseSwedishSwissSyrianTaiwaneseThaiTlingit-HaidaTohono O'OdhamTonganTrinidadian and TobagonianTsimshianTurkishU.S. Virgin IslanderUgandanUkrainianUruguayanUteVenezuelanVietnameseWelshWest IndianYakamaYaquiYugoslavianYumanYup'ikZimbabwean
Immigration
NonimmigrantsImmigrantsAfghanistanAfricaAlbaniaArgentinaArmeniaAsiaAustraliaAustriaBahamasBangladeshBarbadosBelarusBelgiumBelizeBoliviaBosnia and HerzegovinaBrazilBulgariaBurma/MyanmarCabo VerdeCambodiaCameroonCanadaCaribbeanCentral AmericaChileChinaColombiaCongoCosta RicaCroatiaCubaCzechoslovakiaDenmarkDominican RepublicEastern AfricaEastern AsiaEastern EuropeEcuadorEgyptEl SalvadorEnglandEritreaEthiopiaEuropeFijiFranceGermanyGhanaGreeceGrenadaGuatemalaGuyanaHaitiHondurasHong KongHungaryIndiaIndonesiaIranIraqIrelandIsraelItalyJamaicaJapanJordanKazakhstanKenyaKoreaKuwaitLaosLatin AmericaLatviaLebanonLiberiaLithuaniaMalaysiaMexicoMicronesiaMiddle AfricaMoldovaMoroccoNepalNetherlandsNicaraguaNigeriaNorth AmericaNorth MacedoniaNorthern AfricaNorthern EuropeNorwayOceaniaPakistanPanamaPeruPhilippinesPolandPortugalRomaniaRussiaSaudi ArabiaScotlandSenegalSerbiaSierra LeoneSingaporeSomaliaSouth AfricaSouth AmericaSouth Central AsiaSouth Eastern AsiaSouthern EuropeSpainSri LankaSt. Vincent and the GrenadinesSudanSwedenSwitzerlandSyriaTaiwanThailandTrinidad and TobagoTurkeyUgandaUkraineUruguayUzbekistanVenezuelaVietnamWest IndiesWestern AfricaWestern AsiaWestern EuropeYemenZaireZimbabweAzores
GED/Equivalency
Income
Poverty
Unemployment
Labor Participation
Family Structure
Vehicle Availability
Education Level
Disability

GED/Equivalency Comparison

Immigrants from Dominica

Immigrants from Western Africa

Tragic
Tragic
81.1%
GED/EQUIVALENCY
0.0/ 100
METRIC RATING
307th/ 347
METRIC RANK
83.8%
GED/EQUIVALENCY
1.1/ 100
METRIC RATING
247th/ 347
METRIC RANK

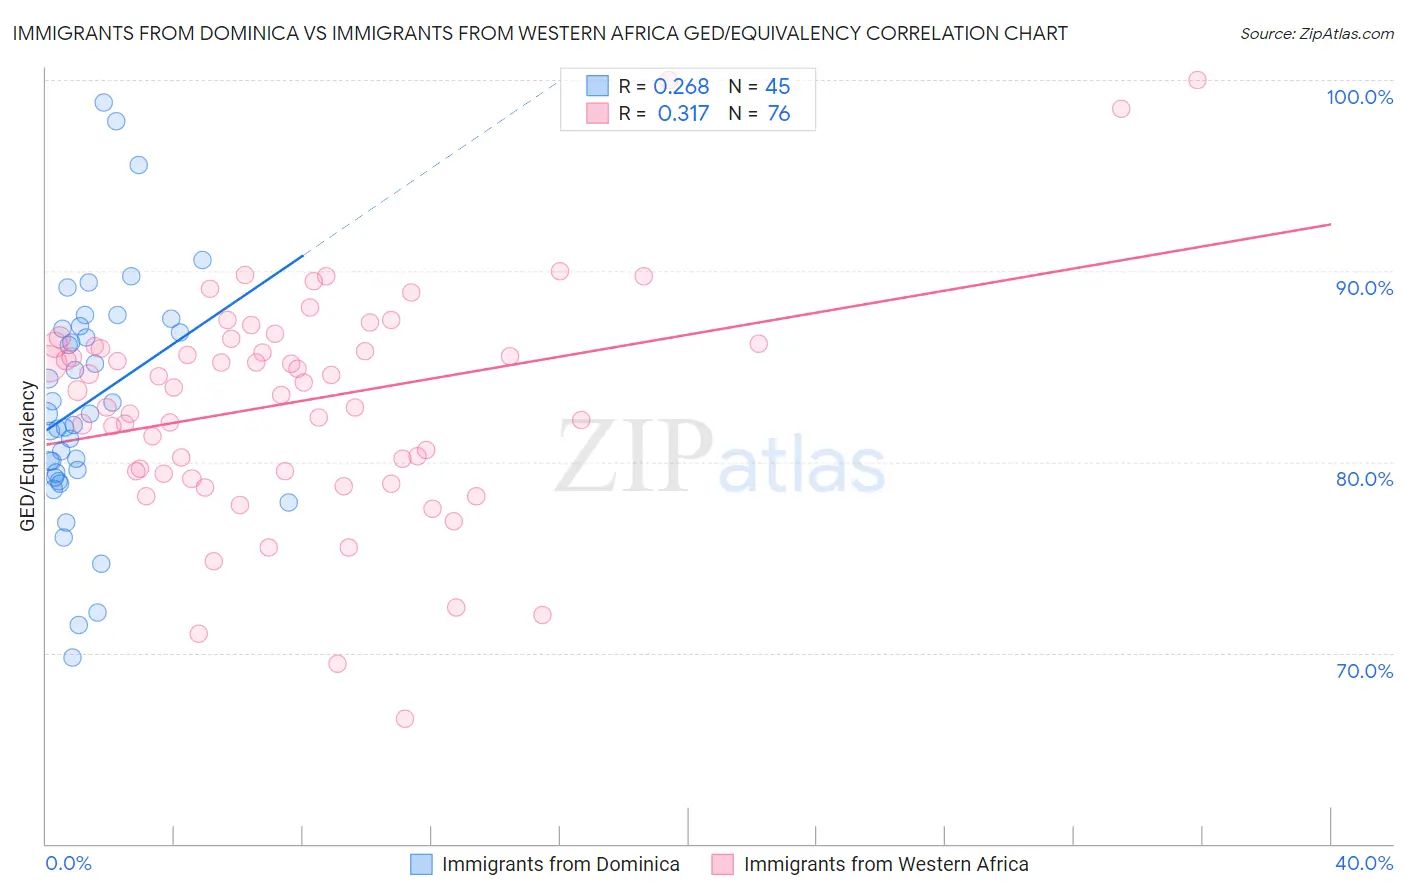
Immigrants from Dominica vs Immigrants from Western Africa GED/Equivalency Correlation Chart

The statistical analysis conducted on geographies consisting of 83,794,115 people shows a weak positive correlation between the proportion of Immigrants from Dominica and percentage of population with at least ged/equivalency education in the United States with a correlation coefficient (R) of 0.268 and weighted average of 81.1%. Similarly, the statistical analysis conducted on geographies consisting of 357,885,284 people shows a mild positive correlation between the proportion of Immigrants from Western Africa and percentage of population with at least ged/equivalency education in the United States with a correlation coefficient (R) of 0.317 and weighted average of 83.8%, a difference of 3.3%.
Immigrants from Dominica vs Immigrants from Western Africa GED/Equivalency

GED/Equivalency Correlation Summary

MeasurementImmigrants from DominicaImmigrants from Western Africa
Minimum69.7%66.5%
Maximum98.8%100.0%
Range29.1%33.5%
Mean83.1%83.2%
Median82.5%84.0%
Interquartile 25% (IQ1)79.3%79.5%
Interquartile 75% (IQ3)87.0%86.2%
Interquartile Range (IQR)7.8%6.7%
Standard Deviation (Sample)6.2%6.0%
Standard Deviation (Population)6.2%5.9%

Similar Demographics by GED/Equivalency

Demographics Similar to Immigrants from Dominica by GED/Equivalency

In terms of ged/equivalency, the demographic groups most similar to Immigrants from Dominica are Puerto Rican (81.1%, a difference of 0.10%), Guyanese (81.3%, a difference of 0.17%), Immigrants from Ecuador (81.0%, a difference of 0.18%), Immigrants from Grenada (81.3%, a difference of 0.19%), and Immigrants from Guyana (81.0%, a difference of 0.25%).
DemographicsRating | RankGED/Equivalency
Fijians
0.0
/100
|
#300
Tragic
81.6%
Dutch West Indians
0.0
/100
|
#301
Tragic
81.6%
Immigrants | Haiti
0.0
/100
|
#302
Tragic
81.6%
Immigrants | Portugal
0.0
/100
|
#303
Tragic
81.6%
Navajo
0.0
/100
|
#304
Tragic
81.5%
Immigrants | Grenada
0.0
/100
|
#305
Tragic
81.3%
Guyanese
0.0
/100
|
#306
Tragic
81.3%
Immigrants | Dominica
0.0
/100
|
#307
Tragic
81.1%
Puerto Ricans
0.0
/100
|
#308
Tragic
81.1%
Immigrants | Ecuador
0.0
/100
|
#309
Tragic
81.0%
Immigrants | Guyana
0.0
/100
|
#310
Tragic
81.0%
Natives/Alaskans
0.0
/100
|
#311
Tragic
80.9%
Nicaraguans
0.0
/100
|
#312
Tragic
80.9%
Cape Verdeans
0.0
/100
|
#313
Tragic
80.9%
Belizeans
0.0
/100
|
#314
Tragic
80.9%

Demographics Similar to Immigrants from Western Africa by GED/Equivalency

In terms of ged/equivalency, the demographic groups most similar to Immigrants from Western Africa are Blackfeet (83.8%, a difference of 0.020%), Crow (83.8%, a difference of 0.020%), Chickasaw (83.8%, a difference of 0.030%), Shoshone (83.7%, a difference of 0.040%), and Immigrants from Senegal (83.8%, a difference of 0.050%).
DemographicsRating | RankGED/Equivalency
Immigrants | South Eastern Asia
2.5
/100
|
#240
Tragic
84.1%
Senegalese
1.9
/100
|
#241
Tragic
84.0%
Sri Lankans
1.9
/100
|
#242
Tragic
84.0%
Cherokee
1.3
/100
|
#243
Tragic
83.9%
Immigrants | Ghana
1.3
/100
|
#244
Tragic
83.9%
Immigrants | Senegal
1.2
/100
|
#245
Tragic
83.8%
Chickasaw
1.2
/100
|
#246
Tragic
83.8%
Immigrants | Western Africa
1.1
/100
|
#247
Tragic
83.8%
Blackfeet
1.1
/100
|
#248
Tragic
83.8%
Crow
1.1
/100
|
#249
Tragic
83.8%
Shoshone
1.0
/100
|
#250
Tragic
83.7%
Spanish Americans
0.8
/100
|
#251
Tragic
83.6%
Bahamians
0.8
/100
|
#252
Tragic
83.6%
Comanche
0.7
/100
|
#253
Tragic
83.6%
Creek
0.7
/100
|
#254
Tragic
83.6%