Italian Unemployment Among Women with Children Ages 6 to 17 years
COMPARE
Italian
Select to Compare
Unemployment Among Women with Children Ages 6 to 17 years
Italian Unemployment Among Women with Children Ages 6 to 17 years
9.5%
UNEMPLOYMENT | WOMEN W/ CHILDREN 6 TO 17
0.6/ 100
METRIC RATING
260th/ 347
METRIC RANK
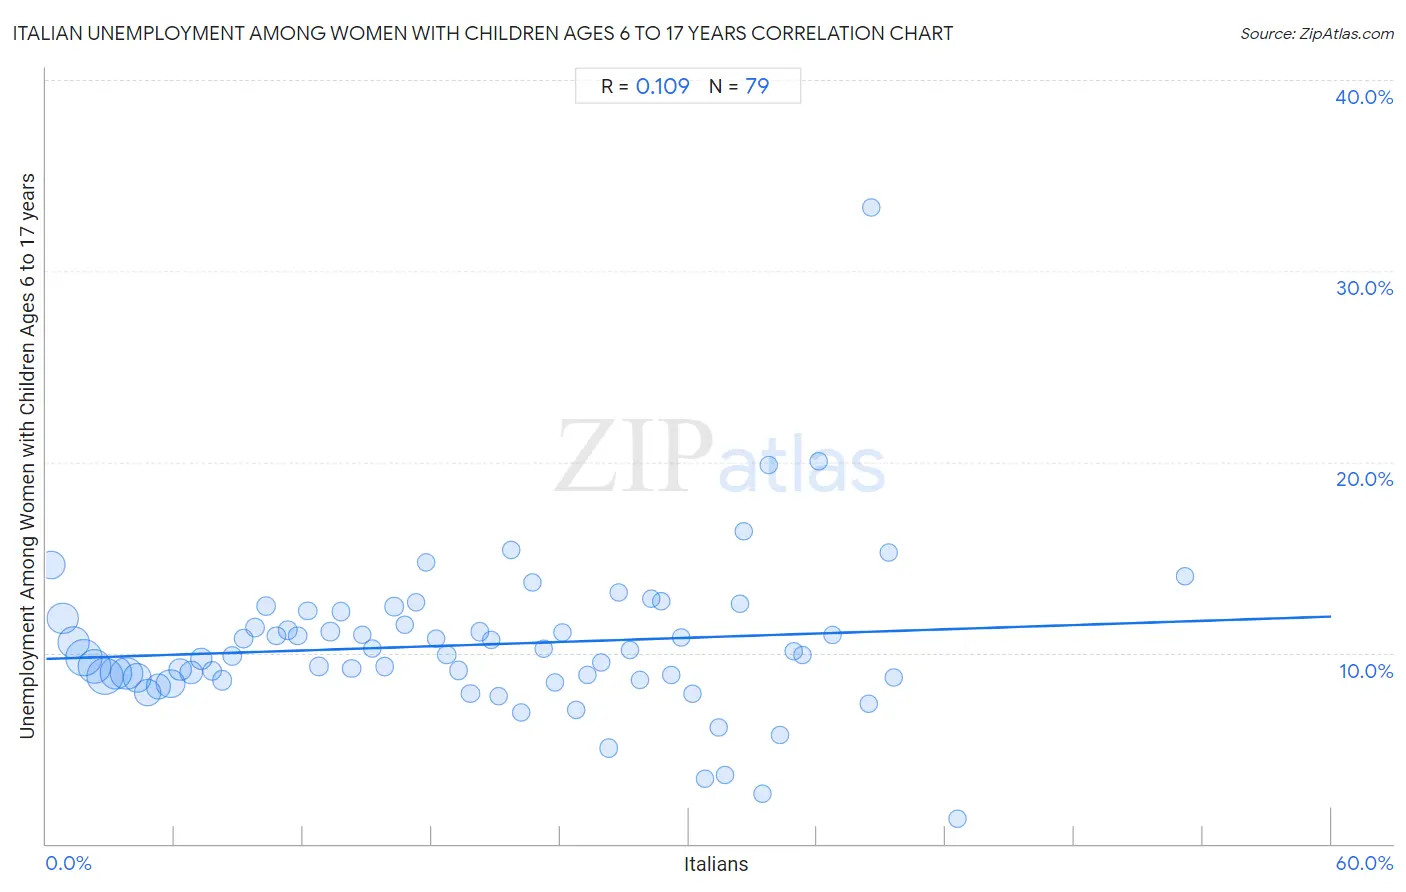
Italian Unemployment Among Women with Children Ages 6 to 17 years Correlation Chart
The statistical analysis conducted on geographies consisting of 359,413,908 people shows a poor positive correlation between the proportion of Italians and unemployment rate among women with children between the ages 6 and 17 in the United States with a correlation coefficient (R) of 0.109 and weighted average of 9.5%. On average, for every 1% (one percent) increase in Italians within a typical geography, there is an increase of 0.037% in unemployment rate among women with children between the ages 6 and 17.
It is essential to understand that the correlation between the percentage of Italians and unemployment rate among women with children between the ages 6 and 17 does not imply a direct cause-and-effect relationship. It remains uncertain whether the presence of Italians influences an upward or downward trend in the level of unemployment rate among women with children between the ages 6 and 17 within an area, or if Italians simply ended up residing in those areas with higher or lower levels of unemployment rate among women with children between the ages 6 and 17 due to other factors.
Demographics Similar to Italians by Unemployment Among Women with Children Ages 6 to 17 years
In terms of unemployment among women with children ages 6 to 17 years, the demographic groups most similar to Italians are South American (9.5%, a difference of 0.080%), Immigrants from Central America (9.5%, a difference of 0.11%), Senegalese (9.5%, a difference of 0.14%), Lebanese (9.5%, a difference of 0.18%), and Immigrants from Mexico (9.5%, a difference of 0.21%).
| Demographics | Rating | Rank | Unemployment Among Women with Children Ages 6 to 17 years |
| Portuguese | 1.1 /100 | #253 | Tragic 9.4% |
| Nicaraguans | 1.0 /100 | #254 | Tragic 9.4% |
| Lithuanians | 0.9 /100 | #255 | Tragic 9.4% |
| Canadians | 0.8 /100 | #256 | Tragic 9.4% |
| Celtics | 0.7 /100 | #257 | Tragic 9.5% |
| Immigrants from Mexico | 0.7 /100 | #258 | Tragic 9.5% |
| Immigrants from Central America | 0.6 /100 | #259 | Tragic 9.5% |
| Italians | 0.6 /100 | #260 | Tragic 9.5% |
| South Americans | 0.5 /100 | #261 | Tragic 9.5% |
| Senegalese | 0.5 /100 | #262 | Tragic 9.5% |
| Lebanese | 0.5 /100 | #263 | Tragic 9.5% |
| Immigrants from Ghana | 0.4 /100 | #264 | Tragic 9.5% |
| West Indians | 0.4 /100 | #265 | Tragic 9.5% |
| Immigrants from Jamaica | 0.3 /100 | #266 | Tragic 9.5% |
| Irish | 0.3 /100 | #267 | Tragic 9.5% |
Italian Unemployment Among Women with Children Ages 6 to 17 years Correlation Summary
| Measurement | Italian Data | Unemployment Among Women with Children Ages 6 to 17 years Data |
| Minimum | 0.26% | 1.3% |
| Maximum | 53.2% | 33.3% |
| Range | 52.9% | 32.0% |
| Mean | 20.1% | 10.4% |
| Median | 19.8% | 9.9% |
| Interquartile 25% (IQ1) | 9.8% | 8.7% |
| Interquartile 75% (IQ3) | 29.6% | 11.8% |
| Interquartile Range (IQR) | 19.9% | 3.1% |
| Standard Deviation (Sample) | 12.1% | 4.1% |
| Standard Deviation (Population) | 12.0% | 4.1% |
Correlation Details
| Italian Percentile | Sample Size | Unemployment Among Women with Children Ages 6 to 17 years |
[ 0.0% - 0.5% ] 0.26% | 18,668,826 | 14.6% |
[ 0.5% - 1.0% ] 0.78% | 24,804,209 | 11.8% |
[ 1.0% - 1.5% ] 1.27% | 26,186,697 | 10.5% |
[ 1.5% - 2.0% ] 1.74% | 34,525,080 | 9.7% |
[ 2.0% - 2.5% ] 2.25% | 30,017,810 | 9.3% |
[ 2.5% - 3.0% ] 2.74% | 35,105,343 | 8.8% |
[ 3.0% - 3.5% ] 3.26% | 26,994,988 | 9.0% |
[ 3.5% - 4.0% ] 3.76% | 26,966,651 | 8.9% |
[ 4.0% - 4.5% ] 4.25% | 19,722,759 | 8.7% |
[ 4.5% - 5.0% ] 4.73% | 16,020,196 | 7.9% |
[ 5.0% - 5.5% ] 5.24% | 13,049,115 | 8.2% |
[ 5.5% - 6.0% ] 5.81% | 19,031,897 | 8.4% |
[ 6.0% - 6.5% ] 6.24% | 8,734,849 | 9.1% |
[ 6.5% - 7.0% ] 6.75% | 9,406,690 | 9.0% |
[ 7.0% - 7.5% ] 7.23% | 6,744,556 | 9.7% |
[ 7.5% - 8.0% ] 7.74% | 3,690,279 | 9.1% |
[ 8.0% - 8.5% ] 8.22% | 3,678,145 | 8.6% |
[ 8.5% - 9.0% ] 8.70% | 3,196,015 | 9.8% |
[ 9.0% - 9.5% ] 9.22% | 2,977,824 | 10.8% |
[ 9.5% - 10.0% ] 9.75% | 2,223,117 | 11.3% |
[ 10.0% - 10.5% ] 10.26% | 2,895,652 | 12.5% |
[ 10.5% - 11.0% ] 10.77% | 1,699,565 | 10.9% |
[ 11.0% - 11.5% ] 11.28% | 1,509,079 | 11.2% |
[ 11.5% - 12.0% ] 11.74% | 1,730,534 | 10.9% |
[ 12.0% - 12.5% ] 12.20% | 1,421,960 | 12.2% |
[ 12.5% - 13.0% ] 12.75% | 1,645,099 | 9.3% |
[ 13.0% - 13.5% ] 13.25% | 1,135,585 | 11.1% |
[ 13.5% - 14.0% ] 13.77% | 1,045,862 | 12.2% |
[ 14.0% - 14.5% ] 14.25% | 976,082 | 9.2% |
[ 14.5% - 15.0% ] 14.74% | 808,464 | 10.9% |
[ 15.0% - 15.5% ] 15.21% | 832,553 | 10.2% |
[ 15.5% - 16.0% ] 15.80% | 1,220,468 | 9.3% |
[ 16.0% - 16.5% ] 16.24% | 908,873 | 12.4% |
[ 16.5% - 17.0% ] 16.73% | 932,025 | 11.5% |
[ 17.0% - 17.5% ] 17.26% | 660,195 | 12.7% |
[ 17.5% - 18.0% ] 17.76% | 490,012 | 14.7% |
[ 18.0% - 18.5% ] 18.22% | 449,602 | 10.7% |
[ 18.5% - 19.0% ] 18.70% | 449,303 | 9.9% |
[ 19.0% - 19.5% ] 19.24% | 802,826 | 9.1% |
[ 19.5% - 20.0% ] 19.81% | 671,808 | 7.8% |
[ 20.0% - 20.5% ] 20.23% | 661,801 | 11.1% |
[ 20.5% - 21.0% ] 20.78% | 204,740 | 10.7% |
[ 21.0% - 21.5% ] 21.12% | 339,633 | 7.7% |
[ 21.5% - 22.0% ] 21.71% | 212,777 | 15.4% |
[ 22.0% - 22.5% ] 22.19% | 230,104 | 6.9% |
[ 22.5% - 23.0% ] 22.70% | 231,199 | 13.7% |
[ 23.0% - 23.5% ] 23.22% | 274,182 | 10.2% |
[ 23.5% - 24.0% ] 23.77% | 288,180 | 8.4% |
[ 24.0% - 24.5% ] 24.12% | 224,914 | 11.0% |
[ 24.5% - 25.0% ] 24.74% | 371,830 | 7.0% |
[ 25.0% - 25.5% ] 25.26% | 314,476 | 8.9% |
[ 25.5% - 26.0% ] 25.89% | 135,559 | 9.5% |
[ 26.0% - 26.5% ] 26.28% | 242,059 | 5.0% |
[ 26.5% - 27.0% ] 26.71% | 193,424 | 13.2% |
[ 27.0% - 27.5% ] 27.26% | 106,651 | 10.2% |
[ 27.5% - 28.0% ] 27.74% | 259,001 | 8.6% |
[ 28.0% - 28.5% ] 28.22% | 97,042 | 12.8% |
[ 28.5% - 29.0% ] 28.70% | 109,333 | 12.7% |
[ 29.0% - 29.5% ] 29.17% | 78,440 | 8.8% |
[ 29.5% - 30.0% ] 29.62% | 125,496 | 10.8% |
[ 30.0% - 30.5% ] 30.20% | 56,164 | 7.9% |
[ 30.5% - 31.0% ] 30.75% | 102,954 | 3.4% |
[ 31.0% - 31.5% ] 31.42% | 131,865 | 6.1% |
[ 31.5% - 32.0% ] 31.69% | 31,969 | 3.6% |
[ 32.0% - 32.5% ] 32.40% | 47,822 | 12.6% |
[ 32.5% - 33.0% ] 32.59% | 15,113 | 16.4% |
[ 33.0% - 33.5% ] 33.44% | 47,825 | 2.6% |
[ 33.5% - 34.0% ] 33.76% | 13,334 | 19.8% |
[ 34.0% - 34.5% ] 34.24% | 26,580 | 5.7% |
[ 34.5% - 35.0% ] 34.93% | 23,392 | 10.1% |
[ 35.0% - 35.5% ] 35.32% | 18,845 | 9.9% |
[ 36.0% - 36.5% ] 36.06% | 45,341 | 20.0% |
[ 36.5% - 37.0% ] 36.72% | 60,318 | 10.9% |
[ 38.0% - 38.5% ] 38.38% | 11,444 | 7.3% |
[ 38.5% - 39.0% ] 38.52% | 1,729 | 33.3% |
[ 39.0% - 39.5% ] 39.36% | 5,963 | 15.3% |
[ 39.5% - 40.0% ] 39.55% | 4,018 | 8.7% |
[ 42.5% - 43.0% ] 42.53% | 30,075 | 1.3% |
[ 53.0% - 53.5% ] 53.17% | 7,723 | 14.0% |