Guyanese Unemployment Among Women with Children Ages 6 to 17 years
COMPARE
Guyanese
Select to Compare
Unemployment Among Women with Children Ages 6 to 17 years
Guyanese Unemployment Among Women with Children Ages 6 to 17 years
9.1%
UNEMPLOYMENT | WOMEN W/ CHILDREN 6 TO 17
21.8/ 100
METRIC RATING
198th/ 347
METRIC RANK
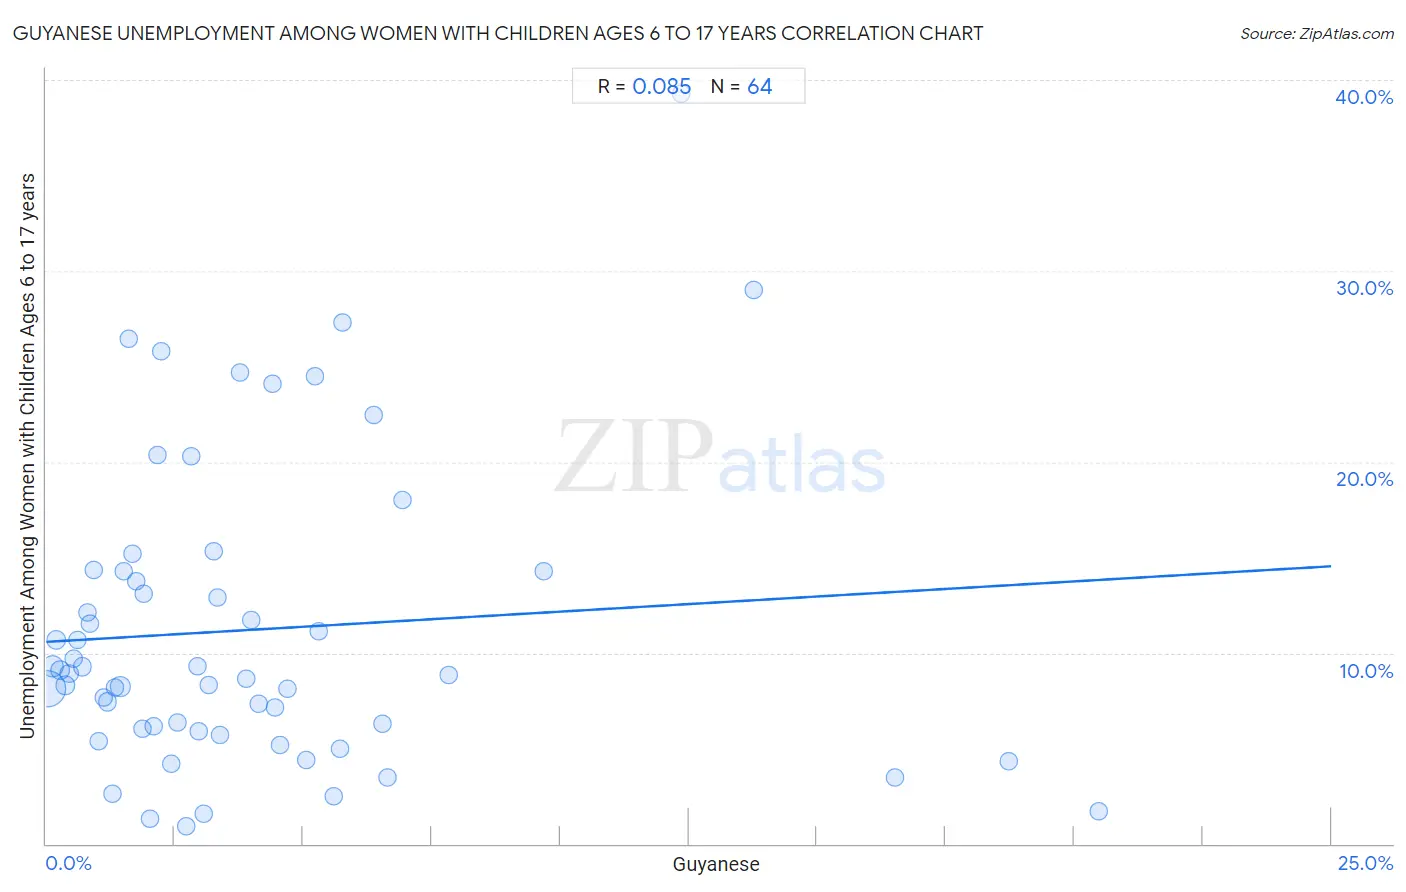
Guyanese Unemployment Among Women with Children Ages 6 to 17 years Correlation Chart
The statistical analysis conducted on geographies consisting of 145,239,239 people shows a slight positive correlation between the proportion of Guyanese and unemployment rate among women with children between the ages 6 and 17 in the United States with a correlation coefficient (R) of 0.085 and weighted average of 9.1%. On average, for every 1% (one percent) increase in Guyanese within a typical geography, there is an increase of 0.16% in unemployment rate among women with children between the ages 6 and 17.
It is essential to understand that the correlation between the percentage of Guyanese and unemployment rate among women with children between the ages 6 and 17 does not imply a direct cause-and-effect relationship. It remains uncertain whether the presence of Guyanese influences an upward or downward trend in the level of unemployment rate among women with children between the ages 6 and 17 within an area, or if Guyanese simply ended up residing in those areas with higher or lower levels of unemployment rate among women with children between the ages 6 and 17 due to other factors.
Demographics Similar to Guyanese by Unemployment Among Women with Children Ages 6 to 17 years
In terms of unemployment among women with children ages 6 to 17 years, the demographic groups most similar to Guyanese are Czechoslovakian (9.1%, a difference of 0.070%), Immigrants from Panama (9.1%, a difference of 0.15%), Brazilian (9.1%, a difference of 0.16%), Austrian (9.1%, a difference of 0.19%), and Immigrants from Kazakhstan (9.1%, a difference of 0.21%).
| Demographics | Rating | Rank | Unemployment Among Women with Children Ages 6 to 17 years |
| Belizeans | 28.4 /100 | #191 | Fair 9.1% |
| Guamanians/Chamorros | 27.2 /100 | #192 | Fair 9.1% |
| Immigrants from Turkey | 25.8 /100 | #193 | Fair 9.1% |
| Immigrants from Kazakhstan | 25.3 /100 | #194 | Fair 9.1% |
| Austrians | 25.0 /100 | #195 | Fair 9.1% |
| Brazilians | 24.4 /100 | #196 | Fair 9.1% |
| Immigrants from Panama | 24.3 /100 | #197 | Fair 9.1% |
| Guyanese | 21.8 /100 | #198 | Fair 9.1% |
| Czechoslovakians | 20.8 /100 | #199 | Fair 9.1% |
| Trinidadians and Tobagonians | 18.2 /100 | #200 | Poor 9.1% |
| Immigrants from Trinidad and Tobago | 16.7 /100 | #201 | Poor 9.1% |
| Immigrants from Middle Africa | 15.6 /100 | #202 | Poor 9.1% |
| Maltese | 15.3 /100 | #203 | Poor 9.1% |
| Immigrants from Canada | 15.3 /100 | #204 | Poor 9.1% |
| Immigrants from Western Europe | 14.1 /100 | #205 | Poor 9.1% |
Guyanese Unemployment Among Women with Children Ages 6 to 17 years Correlation Summary
| Measurement | Guyanese Data | Unemployment Among Women with Children Ages 6 to 17 years Data |
| Minimum | 0.026% | 0.90% |
| Maximum | 20.5% | 39.3% |
| Range | 20.5% | 38.4% |
| Mean | 4.0% | 11.2% |
| Median | 2.9% | 8.9% |
| Interquartile 25% (IQ1) | 1.3% | 5.9% |
| Interquartile 75% (IQ3) | 5.1% | 14.3% |
| Interquartile Range (IQR) | 3.8% | 8.4% |
| Standard Deviation (Sample) | 4.3% | 7.9% |
| Standard Deviation (Population) | 4.2% | 7.9% |
Correlation Details
| Guyanese Percentile | Sample Size | Unemployment Among Women with Children Ages 6 to 17 years |
[ 0.0% - 0.5% ] 0.026% | 93,156,921 | 8.1% |
[ 0.0% - 0.5% ] 0.11% | 17,841,320 | 9.3% |
[ 0.0% - 0.5% ] 0.20% | 6,949,824 | 10.7% |
[ 0.0% - 0.5% ] 0.28% | 4,909,650 | 9.1% |
[ 0.0% - 0.5% ] 0.37% | 2,792,832 | 8.3% |
[ 0.0% - 0.5% ] 0.44% | 1,818,055 | 8.9% |
[ 0.5% - 1.0% ] 0.53% | 1,166,348 | 9.7% |
[ 0.5% - 1.0% ] 0.62% | 772,081 | 10.6% |
[ 0.5% - 1.0% ] 0.71% | 1,221,648 | 9.3% |
[ 0.5% - 1.0% ] 0.79% | 555,898 | 12.1% |
[ 0.5% - 1.0% ] 0.85% | 1,028,480 | 11.6% |
[ 0.5% - 1.0% ] 0.93% | 93,803 | 14.3% |
[ 1.0% - 1.5% ] 1.02% | 479,565 | 5.4% |
[ 1.0% - 1.5% ] 1.12% | 93,186 | 7.6% |
[ 1.0% - 1.5% ] 1.19% | 122,623 | 7.4% |
[ 1.0% - 1.5% ] 1.28% | 66,874 | 2.6% |
[ 1.0% - 1.5% ] 1.35% | 126,689 | 8.2% |
[ 1.0% - 1.5% ] 1.44% | 9,013,338 | 8.2% |
[ 1.5% - 2.0% ] 1.51% | 84,339 | 14.3% |
[ 1.5% - 2.0% ] 1.60% | 78,707 | 26.4% |
[ 1.5% - 2.0% ] 1.68% | 83,760 | 15.2% |
[ 1.5% - 2.0% ] 1.76% | 107,707 | 13.7% |
[ 1.5% - 2.0% ] 1.87% | 75,300 | 6.0% |
[ 1.5% - 2.0% ] 1.90% | 132,072 | 13.1% |
[ 2.0% - 2.5% ] 2.01% | 17,632 | 1.3% |
[ 2.0% - 2.5% ] 2.09% | 152,542 | 6.2% |
[ 2.0% - 2.5% ] 2.16% | 32,528 | 20.4% |
[ 2.0% - 2.5% ] 2.24% | 2,861 | 25.8% |
[ 2.0% - 2.5% ] 2.44% | 24,438 | 4.2% |
[ 2.5% - 3.0% ] 2.56% | 110,764 | 6.3% |
[ 2.5% - 3.0% ] 2.72% | 40,288 | 0.90% |
[ 2.5% - 3.0% ] 2.83% | 70,365 | 20.3% |
[ 2.5% - 3.0% ] 2.93% | 162,084 | 9.3% |
[ 2.5% - 3.0% ] 2.97% | 43,396 | 5.9% |
[ 3.0% - 3.5% ] 3.07% | 101,053 | 1.6% |
[ 3.0% - 3.5% ] 3.15% | 66,744 | 8.3% |
[ 3.0% - 3.5% ] 3.26% | 66,771 | 15.3% |
[ 3.0% - 3.5% ] 3.33% | 25,828 | 12.9% |
[ 3.0% - 3.5% ] 3.39% | 60,268 | 5.7% |
[ 3.5% - 4.0% ] 3.76% | 84,006 | 24.7% |
[ 3.5% - 4.0% ] 3.89% | 156,163 | 8.7% |
[ 3.5% - 4.0% ] 3.98% | 72,273 | 11.7% |
[ 4.0% - 4.5% ] 4.13% | 7,653 | 7.3% |
[ 4.0% - 4.5% ] 4.40% | 39,557 | 24.1% |
[ 4.0% - 4.5% ] 4.46% | 90,781 | 7.1% |
[ 4.5% - 5.0% ] 4.56% | 64,268 | 5.2% |
[ 4.5% - 5.0% ] 4.68% | 131,608 | 8.1% |
[ 5.0% - 5.5% ] 5.06% | 100,082 | 4.4% |
[ 5.0% - 5.5% ] 5.24% | 68,879 | 24.5% |
[ 5.0% - 5.5% ] 5.31% | 21,901 | 11.1% |
[ 5.5% - 6.0% ] 5.60% | 38,317 | 2.5% |
[ 5.5% - 6.0% ] 5.71% | 27,845 | 5.0% |
[ 5.5% - 6.0% ] 5.75% | 13,801 | 27.3% |
[ 6.0% - 6.5% ] 6.37% | 35,154 | 22.5% |
[ 6.5% - 7.0% ] 6.54% | 68,476 | 6.3% |
[ 6.5% - 7.0% ] 6.63% | 108,180 | 3.5% |
[ 6.5% - 7.0% ] 6.93% | 27,794 | 18.0% |
[ 7.5% - 8.0% ] 7.83% | 138,467 | 8.8% |
[ 9.5% - 10.0% ] 9.68% | 38,865 | 14.3% |
[ 12.0% - 12.5% ] 12.35% | 7,863 | 39.3% |
[ 13.5% - 14.0% ] 13.78% | 29,921 | 29.0% |
[ 16.5% - 17.0% ] 16.52% | 19,554 | 3.5% |
[ 18.5% - 19.0% ] 18.74% | 48,096 | 4.3% |
[ 20.0% - 20.5% ] 20.48% | 51,153 | 1.7% |