European Unemployment Among Women with Children Ages 6 to 17 years
COMPARE
European
Select to Compare
Unemployment Among Women with Children Ages 6 to 17 years
European Unemployment Among Women with Children Ages 6 to 17 years
8.7%
UNEMPLOYMENT | WOMEN W/ CHILDREN 6 TO 17
90.6/ 100
METRIC RATING
135th/ 347
METRIC RANK
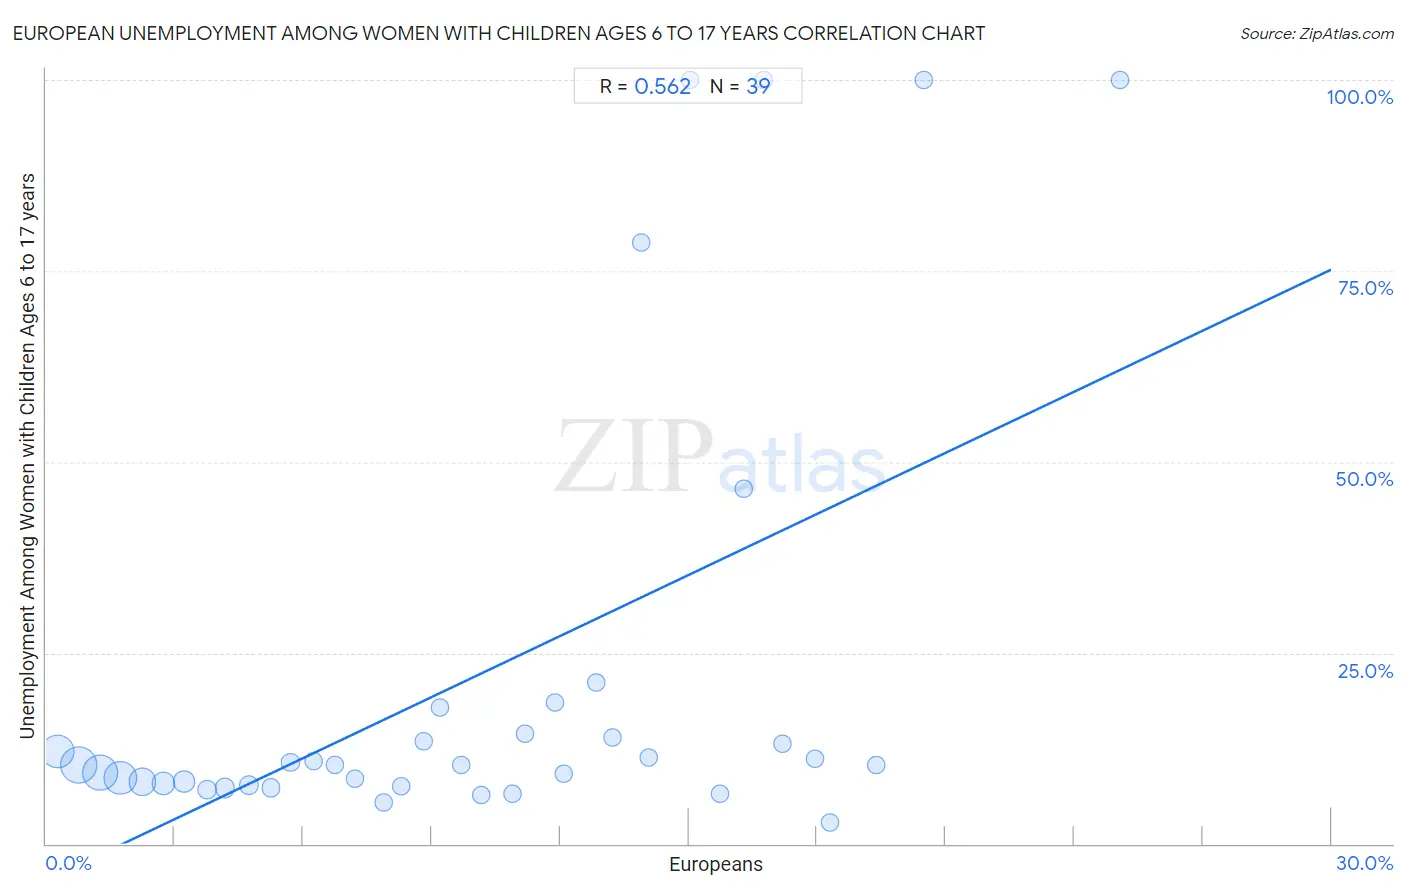
European Unemployment Among Women with Children Ages 6 to 17 years Correlation Chart
The statistical analysis conducted on geographies consisting of 354,477,145 people shows a substantial positive correlation between the proportion of Europeans and unemployment rate among women with children between the ages 6 and 17 in the United States with a correlation coefficient (R) of 0.562 and weighted average of 8.7%. On average, for every 1% (one percent) increase in Europeans within a typical geography, there is an increase of 2.7% in unemployment rate among women with children between the ages 6 and 17.
It is essential to understand that the correlation between the percentage of Europeans and unemployment rate among women with children between the ages 6 and 17 does not imply a direct cause-and-effect relationship. It remains uncertain whether the presence of Europeans influences an upward or downward trend in the level of unemployment rate among women with children between the ages 6 and 17 within an area, or if Europeans simply ended up residing in those areas with higher or lower levels of unemployment rate among women with children between the ages 6 and 17 due to other factors.
Demographics Similar to Europeans by Unemployment Among Women with Children Ages 6 to 17 years
In terms of unemployment among women with children ages 6 to 17 years, the demographic groups most similar to Europeans are Immigrants from Latvia (8.7%, a difference of 0.030%), Immigrants from Ireland (8.7%, a difference of 0.060%), Immigrants from Argentina (8.7%, a difference of 0.080%), Immigrants from Ethiopia (8.8%, a difference of 0.14%), and Egyptian (8.7%, a difference of 0.17%).
| Demographics | Rating | Rank | Unemployment Among Women with Children Ages 6 to 17 years |
| Hmong | 94.3 /100 | #128 | Exceptional 8.7% |
| Barbadians | 93.8 /100 | #129 | Exceptional 8.7% |
| Immigrants from Western Asia | 93.1 /100 | #130 | Exceptional 8.7% |
| Slavs | 92.2 /100 | #131 | Exceptional 8.7% |
| Yaqui | 92.2 /100 | #132 | Exceptional 8.7% |
| Egyptians | 91.8 /100 | #133 | Exceptional 8.7% |
| Immigrants from Ireland | 91.0 /100 | #134 | Exceptional 8.7% |
| Europeans | 90.6 /100 | #135 | Exceptional 8.7% |
| Immigrants from Latvia | 90.4 /100 | #136 | Exceptional 8.7% |
| Immigrants from Argentina | 90.0 /100 | #137 | Excellent 8.7% |
| Immigrants from Ethiopia | 89.5 /100 | #138 | Excellent 8.8% |
| Northern Europeans | 89.2 /100 | #139 | Excellent 8.8% |
| Immigrants from Poland | 88.3 /100 | #140 | Excellent 8.8% |
| Serbians | 87.6 /100 | #141 | Excellent 8.8% |
| Immigrants from Austria | 87.5 /100 | #142 | Excellent 8.8% |
European Unemployment Among Women with Children Ages 6 to 17 years Correlation Summary
| Measurement | European Data | Unemployment Among Women with Children Ages 6 to 17 years Data |
| Minimum | 0.26% | 2.8% |
| Maximum | 25.1% | 100.0% |
| Range | 24.8% | 97.2% |
| Mean | 10.1% | 22.0% |
| Median | 9.7% | 10.3% |
| Interquartile 25% (IQ1) | 4.7% | 7.7% |
| Interquartile 75% (IQ3) | 15.0% | 14.4% |
| Interquartile Range (IQR) | 10.3% | 6.7% |
| Standard Deviation (Sample) | 6.2% | 29.6% |
| Standard Deviation (Population) | 6.2% | 29.2% |
Correlation Details
| European Percentile | Sample Size | Unemployment Among Women with Children Ages 6 to 17 years |
[ 0.0% - 0.5% ] 0.26% | 58,503,378 | 12.1% |
[ 0.5% - 1.0% ] 0.77% | 74,961,038 | 10.4% |
[ 1.0% - 1.5% ] 1.25% | 68,812,414 | 9.4% |
[ 1.5% - 2.0% ] 1.73% | 57,180,393 | 8.7% |
[ 2.0% - 2.5% ] 2.23% | 35,814,598 | 8.1% |
[ 2.5% - 3.0% ] 2.73% | 22,527,877 | 7.9% |
[ 3.0% - 3.5% ] 3.22% | 12,454,425 | 8.1% |
[ 3.5% - 4.0% ] 3.75% | 7,971,935 | 7.1% |
[ 4.0% - 4.5% ] 4.17% | 6,019,307 | 7.3% |
[ 4.5% - 5.0% ] 4.73% | 3,682,896 | 7.7% |
[ 5.0% - 5.5% ] 5.25% | 2,370,066 | 7.3% |
[ 5.5% - 6.0% ] 5.70% | 852,364 | 10.7% |
[ 6.0% - 6.5% ] 6.23% | 871,586 | 10.8% |
[ 6.5% - 7.0% ] 6.73% | 804,808 | 10.3% |
[ 7.0% - 7.5% ] 7.22% | 315,231 | 8.5% |
[ 7.5% - 8.0% ] 7.88% | 277,599 | 5.4% |
[ 8.0% - 8.5% ] 8.29% | 238,389 | 7.6% |
[ 8.5% - 9.0% ] 8.82% | 86,514 | 13.4% |
[ 9.0% - 9.5% ] 9.18% | 132,634 | 17.9% |
[ 9.5% - 10.0% ] 9.70% | 270,881 | 10.3% |
[ 10.0% - 10.5% ] 10.15% | 86,140 | 6.4% |
[ 10.5% - 11.0% ] 10.88% | 43,178 | 6.6% |
[ 11.0% - 11.5% ] 11.17% | 46,516 | 14.4% |
[ 11.5% - 12.0% ] 11.87% | 26,066 | 18.5% |
[ 12.0% - 12.5% ] 12.07% | 24,585 | 9.1% |
[ 12.5% - 13.0% ] 12.85% | 16,709 | 21.2% |
[ 13.0% - 13.5% ] 13.21% | 12,523 | 13.9% |
[ 13.5% - 14.0% ] 13.89% | 648 | 78.7% |
[ 14.0% - 14.5% ] 14.05% | 17,105 | 11.4% |
[ 15.0% - 15.5% ] 15.02% | 2,770 | 100.0% |
[ 15.5% - 16.0% ] 15.73% | 1,735 | 6.5% |
[ 16.0% - 16.5% ] 16.27% | 424 | 46.5% |
[ 16.5% - 17.0% ] 16.76% | 1,265 | 100.0% |
[ 17.0% - 17.5% ] 17.20% | 24,168 | 13.1% |
[ 17.5% - 18.0% ] 17.94% | 19,071 | 11.1% |
[ 18.0% - 18.5% ] 18.31% | 2,835 | 2.8% |
[ 19.0% - 19.5% ] 19.39% | 820 | 10.3% |
[ 20.0% - 20.5% ] 20.50% | 1,815 | 100.0% |
[ 25.0% - 25.5% ] 25.06% | 439 | 100.0% |