Portuguese vs Nepalese Wage/Income Gap

COMPARE

Portuguese
Race
Ancestry
AfghanAfricanAlaska NativeAlaskan AthabascanAlbanianAleutAlsatianAmericanApacheArabArapahoArgentineanArmenianAssyrian/Chaldean/SyriacAustralianAustrianBahamianBangladeshiBarbadianBasqueBelgianBelizeanBermudanBhutaneseBlackfeetBolivianBrazilianBritishBritish West IndianBulgarianBurmeseCajunCambodianCanadianCape VerdeanCarpatho RusynCelticCentral AmericanCentral American IndianCherokeeCheyenneChickasawChileanChineseChippewaChoctawColombianColvilleComancheCosta RicanCreeCreekCroatianCrowCubanCypriotCzechCzechoslovakianDanishDelawareDominicanDutchDutch West IndianEastern EuropeanEcuadorianEgyptianEnglishEstonianEthiopianEuropeanFijianFilipinoFinnishFrenchFrench American IndianFrench CanadianGermanGerman RussianGhanaianGreekGuamanian/ChamorroGuatemalanGuyaneseHaitianHmongHonduranHopiHoumaHungarianIcelanderIndian (Asian)IndonesianInupiatIranianIraqiIrishIroquoisIsraeliItalianJamaicanJapaneseJordanianKenyanKiowaKoreanLaotianLatvianLebaneseLiberianLithuanianLumbeeLuxembourgerMacedonianMalaysianMalteseMarshalleseMenomineeMexicanMexican American IndianMongolianMoroccanNative HawaiianNavajoNew ZealanderNicaraguanNigerianNorthern EuropeanNorwegianOkinawanOsageOttawaPaiutePakistaniPalestinianPanamanianParaguayanPennsylvania GermanPeruvianPimaPolishPortuguesePotawatomiPuebloPuerto RicanPuget Sound SalishRomanianRussianSalvadoranSamoanScandinavianScotch-IrishScottishSeminoleSenegaleseSerbianShoshoneSierra LeoneanSiouxSlavicSlovakSloveneSomaliSouth AfricanSouth AmericanSouth American IndianSoviet UnionSpaniardSpanishSpanish AmericanSpanish American IndianSri LankanSubsaharan AfricanSudaneseSwedishSwissSyrianTaiwaneseThaiTlingit-HaidaTohono O'OdhamTonganTrinidadian and TobagonianTsimshianTurkishU.S. Virgin IslanderUgandanUkrainianUruguayanUteVenezuelanVietnameseWelshWest IndianYakamaYaquiYugoslavianYumanYup'ikZimbabwean
Immigration
NonimmigrantsImmigrantsAfghanistanAfricaAlbaniaArgentinaArmeniaAsiaAustraliaAustriaBahamasBangladeshBarbadosBelarusBelgiumBelizeBoliviaBosnia and HerzegovinaBrazilBulgariaBurma/MyanmarCabo VerdeCambodiaCameroonCanadaCaribbeanCentral AmericaChileChinaColombiaCongoCosta RicaCroatiaCubaCzechoslovakiaDenmarkDominicaDominican RepublicEastern AfricaEastern AsiaEastern EuropeEcuadorEgyptEl SalvadorEnglandEritreaEthiopiaEuropeFijiFranceGermanyGhanaGreeceGrenadaGuatemalaGuyanaHaitiHondurasHong KongHungaryIndiaIndonesiaIranIraqIrelandIsraelItalyJamaicaJapanJordanKazakhstanKenyaKoreaKuwaitLaosLatin AmericaLatviaLebanonLiberiaLithuaniaMalaysiaMexicoMicronesiaMiddle AfricaMoldovaMoroccoNepalNetherlandsNicaraguaNigeriaNorth AmericaNorth MacedoniaNorthern AfricaNorthern EuropeNorwayOceaniaPakistanPanamaPeruPhilippinesPolandPortugalRomaniaRussiaSaudi ArabiaScotlandSenegalSerbiaSierra LeoneSingaporeSomaliaSouth AfricaSouth AmericaSouth Central AsiaSouth Eastern AsiaSouthern EuropeSpainSri LankaSt. Vincent and the GrenadinesSudanSwedenSwitzerlandSyriaTaiwanThailandTrinidad and TobagoTurkeyUgandaUkraineUruguayUzbekistanVenezuelaVietnamWest IndiesWestern AfricaWestern AsiaWestern EuropeYemenZaireZimbabweAzores
Nepalese
Race
Ancestry
AfghanAfricanAlaska NativeAlaskan AthabascanAlbanianAleutAlsatianAmericanApacheArabArapahoArgentineanArmenianAssyrian/Chaldean/SyriacAustralianAustrianBahamianBangladeshiBarbadianBasqueBelgianBelizeanBermudanBhutaneseBlackfeetBolivianBrazilianBritishBritish West IndianBulgarianBurmeseCajunCambodianCanadianCape VerdeanCarpatho RusynCelticCentral AmericanCentral American IndianCherokeeCheyenneChickasawChileanChineseChippewaChoctawColombianColvilleComancheCosta RicanCreeCreekCroatianCrowCubanCypriotCzechCzechoslovakianDanishDelawareDominicanDutchDutch West IndianEastern EuropeanEcuadorianEgyptianEnglishEstonianEthiopianEuropeanFijianFilipinoFinnishFrenchFrench American IndianFrench CanadianGermanGerman RussianGhanaianGreekGuamanian/ChamorroGuatemalanGuyaneseHaitianHmongHonduranHopiHoumaHungarianIcelanderIndian (Asian)IndonesianInupiatIranianIraqiIrishIroquoisIsraeliItalianJamaicanJapaneseJordanianKenyanKiowaKoreanLaotianLatvianLebaneseLiberianLithuanianLumbeeLuxembourgerMacedonianMalaysianMalteseMarshalleseMenomineeMexicanMexican American IndianMongolianMoroccanNative HawaiianNavajoNepaleseNew ZealanderNicaraguanNigerianNorthern EuropeanNorwegianOkinawanOsageOttawaPaiutePakistaniPalestinianPanamanianParaguayanPennsylvania GermanPeruvianPimaPolishPotawatomiPuebloPuerto RicanPuget Sound SalishRomanianRussianSalvadoranSamoanScandinavianScotch-IrishScottishSeminoleSenegaleseSerbianShoshoneSierra LeoneanSiouxSlavicSlovakSloveneSomaliSouth AfricanSouth AmericanSouth American IndianSoviet UnionSpaniardSpanishSpanish AmericanSpanish American IndianSri LankanSubsaharan AfricanSudaneseSwedishSwissSyrianTaiwaneseThaiTlingit-HaidaTohono O'OdhamTonganTrinidadian and TobagonianTsimshianTurkishU.S. Virgin IslanderUgandanUkrainianUruguayanUteVenezuelanVietnameseWelshWest IndianYakamaYaquiYugoslavianYumanYup'ikZimbabwean
Immigration
NonimmigrantsImmigrantsAfghanistanAfricaAlbaniaArgentinaArmeniaAsiaAustraliaAustriaBahamasBangladeshBarbadosBelarusBelgiumBelizeBoliviaBosnia and HerzegovinaBrazilBulgariaBurma/MyanmarCabo VerdeCambodiaCameroonCanadaCaribbeanCentral AmericaChileChinaColombiaCongoCosta RicaCroatiaCubaCzechoslovakiaDenmarkDominicaDominican RepublicEastern AfricaEastern AsiaEastern EuropeEcuadorEgyptEl SalvadorEnglandEritreaEthiopiaEuropeFijiFranceGermanyGhanaGreeceGrenadaGuatemalaGuyanaHaitiHondurasHong KongHungaryIndiaIndonesiaIranIraqIrelandIsraelItalyJamaicaJapanJordanKazakhstanKenyaKoreaKuwaitLaosLatin AmericaLatviaLebanonLiberiaLithuaniaMalaysiaMexicoMicronesiaMiddle AfricaMoldovaMoroccoNepalNetherlandsNicaraguaNigeriaNorth AmericaNorth MacedoniaNorthern AfricaNorthern EuropeNorwayOceaniaPakistanPanamaPeruPhilippinesPolandPortugalRomaniaRussiaSaudi ArabiaScotlandSenegalSerbiaSierra LeoneSingaporeSomaliaSouth AfricaSouth AmericaSouth Central AsiaSouth Eastern AsiaSouthern EuropeSpainSri LankaSt. Vincent and the GrenadinesSudanSwedenSwitzerlandSyriaTaiwanThailandTrinidad and TobagoTurkeyUgandaUkraineUruguayUzbekistanVenezuelaVietnamWest IndiesWestern AfricaWestern AsiaWestern EuropeYemenZaireZimbabweAzores
Wage/Income Gap
Income
Poverty
Unemployment
Labor Participation
Family Structure
Vehicle Availability
Education Level
Disability

Wage/Income Gap Comparison

Portuguese

Nepalese

Tragic
Exceptional
27.4%
WAGE/INCOME GAP
2.2/ 100
METRIC RATING
253rd/ 347
METRIC RANK
22.2%
WAGE/INCOME GAP
100.0/ 100
METRIC RATING
54th/ 347
METRIC RANK

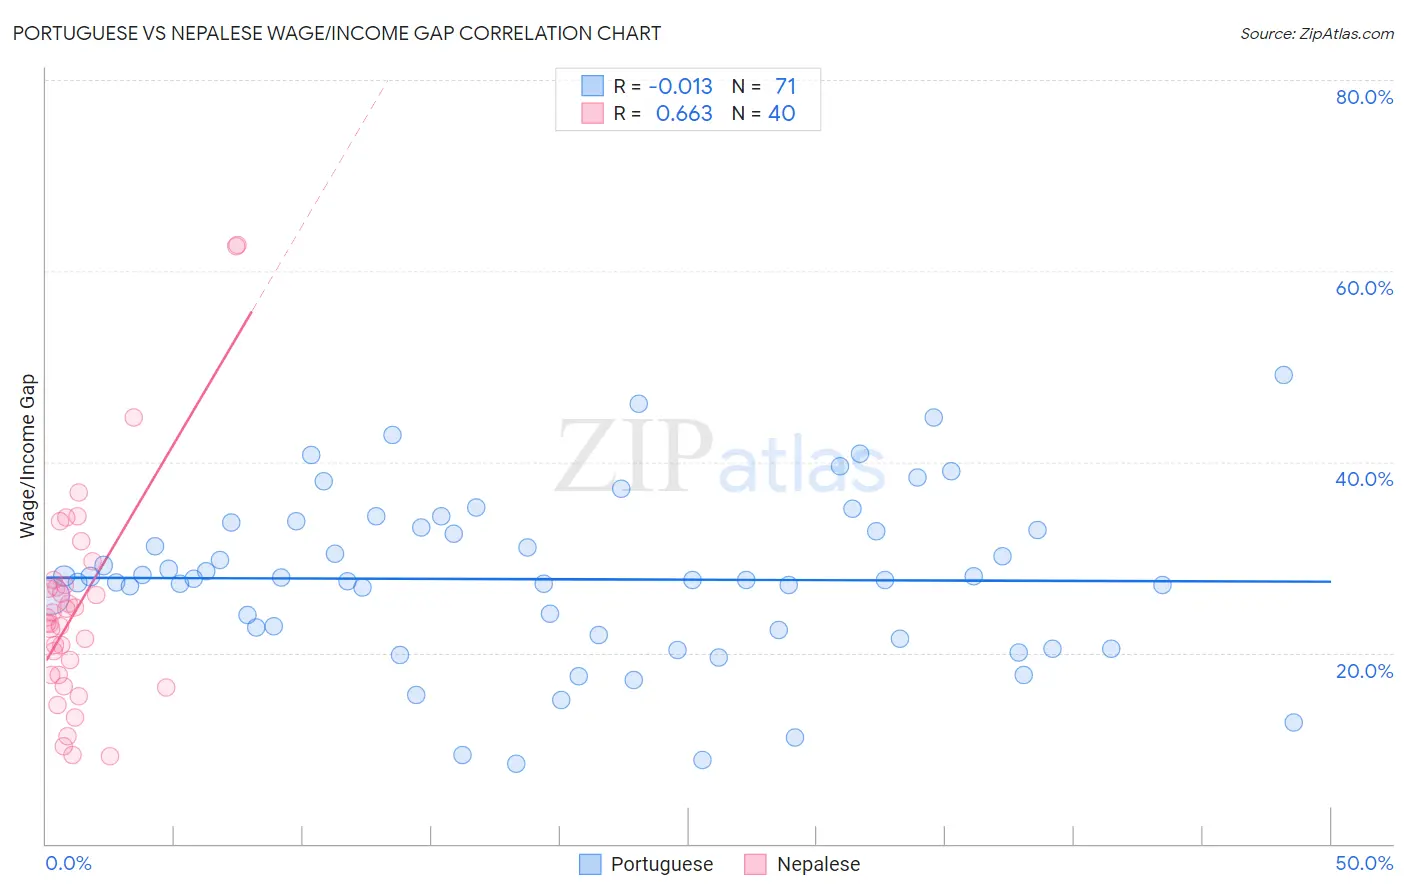
Portuguese vs Nepalese Wage/Income Gap Correlation Chart

The statistical analysis conducted on geographies consisting of 449,694,788 people shows no correlation between the proportion of Portuguese and wage/income gap percentage in the United States with a correlation coefficient (R) of -0.013 and weighted average of 27.4%. Similarly, the statistical analysis conducted on geographies consisting of 24,519,153 people shows a significant positive correlation between the proportion of Nepalese and wage/income gap percentage in the United States with a correlation coefficient (R) of 0.663 and weighted average of 22.2%, a difference of 23.2%.
Portuguese vs Nepalese Wage/Income Gap

Wage/Income Gap Correlation Summary

MeasurementPortugueseNepalese
Minimum8.3%9.1%
Maximum49.0%62.8%
Range40.7%53.7%
Mean27.7%25.0%
Median27.7%23.4%
Interquartile 25% (IQ1)21.8%17.7%
Interquartile 75% (IQ3)33.1%27.4%
Interquartile Range (IQR)11.3%9.7%
Standard Deviation (Sample)8.8%11.7%
Standard Deviation (Population)8.7%11.5%

Similar Demographics by Wage/Income Gap

Demographics Similar to Portuguese by Wage/Income Gap

In terms of wage/income gap, the demographic groups most similar to Portuguese are Israeli (27.4%, a difference of 0.080%), Immigrants from France (27.4%, a difference of 0.090%), Ukrainian (27.3%, a difference of 0.16%), Cherokee (27.4%, a difference of 0.20%), and Immigrants from Norway (27.3%, a difference of 0.22%).
DemographicsRating | RankWage/Income Gap
Immigrants | Nonimmigrants
3.3
/100
|
#246
Tragic
27.2%
Celtics
2.8
/100
|
#247
Tragic
27.3%
Cypriots
2.8
/100
|
#248
Tragic
27.3%
Carpatho Rusyns
2.7
/100
|
#249
Tragic
27.3%
Immigrants | Czechoslovakia
2.7
/100
|
#250
Tragic
27.3%
Immigrants | Norway
2.5
/100
|
#251
Tragic
27.3%
Ukrainians
2.4
/100
|
#252
Tragic
27.3%
Portuguese
2.2
/100
|
#253
Tragic
27.4%
Israelis
2.1
/100
|
#254
Tragic
27.4%
Immigrants | France
2.1
/100
|
#255
Tragic
27.4%
Cherokee
1.9
/100
|
#256
Tragic
27.4%
Luxembourgers
1.9
/100
|
#257
Tragic
27.4%
Slavs
1.8
/100
|
#258
Tragic
27.4%
Icelanders
1.8
/100
|
#259
Tragic
27.5%
Tongans
1.7
/100
|
#260
Tragic
27.5%

Demographics Similar to Nepalese by Wage/Income Gap

In terms of wage/income gap, the demographic groups most similar to Nepalese are Bangladeshi (22.2%, a difference of 0.23%), Immigrants from Cameroon (22.2%, a difference of 0.24%), Tohono O'odham (22.1%, a difference of 0.32%), Immigrants from Zaire (22.3%, a difference of 0.40%), and Immigrants from Ghana (22.3%, a difference of 0.43%).
DemographicsRating | RankWage/Income Gap
Immigrants | Congo
100.0
/100
|
#47
Exceptional
21.7%
Blacks/African Americans
100.0
/100
|
#48
Exceptional
21.7%
Ethiopians
100.0
/100
|
#49
Exceptional
21.8%
Immigrants | Western Africa
100.0
/100
|
#50
Exceptional
22.0%
Tohono O'odham
100.0
/100
|
#51
Exceptional
22.1%
Immigrants | Cameroon
100.0
/100
|
#52
Exceptional
22.2%
Bangladeshis
100.0
/100
|
#53
Exceptional
22.2%
Nepalese
100.0
/100
|
#54
Exceptional
22.2%
Immigrants | Zaire
100.0
/100
|
#55
Exceptional
22.3%
Immigrants | Ghana
100.0
/100
|
#56
Exceptional
22.3%
Ghanaians
100.0
/100
|
#57
Exceptional
22.3%
Immigrants | Cuba
100.0
/100
|
#58
Exceptional
22.4%
Navajo
100.0
/100
|
#59
Exceptional
22.4%
Immigrants | Middle Africa
100.0
/100
|
#60
Exceptional
22.4%
Immigrants | Fiji
100.0
/100
|
#61
Exceptional
22.4%