Arab vs Immigrants from Yemen Wage/Income Gap

COMPARE

Arab
Race
Ancestry
AfghanAfricanAlaska NativeAlaskan AthabascanAlbanianAleutAlsatianAmericanApacheArabArapahoArgentineanArmenianAssyrian/Chaldean/SyriacAustralianAustrianBahamianBangladeshiBarbadianBasqueBelgianBelizeanBermudanBhutaneseBlackfeetBolivianBrazilianBritishBritish West IndianBulgarianBurmeseCajunCambodianCanadianCape VerdeanCarpatho RusynCelticCentral AmericanCentral American IndianCherokeeCheyenneChickasawChileanChineseChippewaChoctawColombianColvilleComancheCosta RicanCreeCreekCroatianCrowCubanCypriotCzechCzechoslovakianDanishDelawareDominicanDutchDutch West IndianEastern EuropeanEcuadorianEgyptianEnglishEstonianEthiopianEuropeanFijianFilipinoFinnishFrenchFrench American IndianFrench CanadianGermanGerman RussianGhanaianGreekGuamanian/ChamorroGuatemalanGuyaneseHaitianHmongHonduranHopiHoumaHungarianIcelanderIndian (Asian)IndonesianInupiatIranianIraqiIrishIroquoisIsraeliItalianJamaicanJapaneseJordanianKenyanKiowaKoreanLaotianLatvianLebaneseLiberianLithuanianLumbeeLuxembourgerMacedonianMalaysianMalteseMarshalleseMenomineeMexicanMexican American IndianMongolianMoroccanNative HawaiianNavajoNepaleseNew ZealanderNicaraguanNigerianNorthern EuropeanNorwegianOkinawanOsageOttawaPaiutePakistaniPalestinianPanamanianParaguayanPennsylvania GermanPeruvianPimaPolishPortuguesePotawatomiPuebloPuerto RicanPuget Sound SalishRomanianRussianSalvadoranSamoanScandinavianScotch-IrishScottishSeminoleSenegaleseSerbianShoshoneSierra LeoneanSiouxSlavicSlovakSloveneSomaliSouth AfricanSouth AmericanSouth American IndianSoviet UnionSpaniardSpanishSpanish AmericanSpanish American IndianSri LankanSubsaharan AfricanSudaneseSwedishSwissSyrianTaiwaneseThaiTlingit-HaidaTohono O'OdhamTonganTrinidadian and TobagonianTsimshianTurkishU.S. Virgin IslanderUgandanUkrainianUruguayanUteVenezuelanVietnameseWelshWest IndianYakamaYaquiYugoslavianYumanYup'ikZimbabwean
Immigration
NonimmigrantsImmigrantsAfghanistanAfricaAlbaniaArgentinaArmeniaAsiaAustraliaAustriaBahamasBangladeshBarbadosBelarusBelgiumBelizeBoliviaBosnia and HerzegovinaBrazilBulgariaBurma/MyanmarCabo VerdeCambodiaCameroonCanadaCaribbeanCentral AmericaChileChinaColombiaCongoCosta RicaCroatiaCubaCzechoslovakiaDenmarkDominicaDominican RepublicEastern AfricaEastern AsiaEastern EuropeEcuadorEgyptEl SalvadorEnglandEritreaEthiopiaEuropeFijiFranceGermanyGhanaGreeceGrenadaGuatemalaGuyanaHaitiHondurasHong KongHungaryIndiaIndonesiaIranIraqIrelandIsraelItalyJamaicaJapanJordanKazakhstanKenyaKoreaKuwaitLaosLatin AmericaLatviaLebanonLiberiaLithuaniaMalaysiaMexicoMicronesiaMiddle AfricaMoldovaMoroccoNepalNetherlandsNicaraguaNigeriaNorth AmericaNorth MacedoniaNorthern AfricaNorthern EuropeNorwayOceaniaPakistanPanamaPeruPhilippinesPolandPortugalRomaniaRussiaSaudi ArabiaScotlandSenegalSerbiaSierra LeoneSingaporeSomaliaSouth AfricaSouth AmericaSouth Central AsiaSouth Eastern AsiaSouthern EuropeSpainSri LankaSt. Vincent and the GrenadinesSudanSwedenSwitzerlandSyriaTaiwanThailandTrinidad and TobagoTurkeyUgandaUkraineUruguayUzbekistanVenezuelaVietnamWest IndiesWestern AfricaWestern AsiaWestern EuropeZaireZimbabweAzores
Immigrants from Yemen
Race
Ancestry
AfghanAfricanAlaska NativeAlaskan AthabascanAlbanianAleutAlsatianAmericanApacheArapahoArgentineanArmenianAssyrian/Chaldean/SyriacAustralianAustrianBahamianBangladeshiBarbadianBasqueBelgianBelizeanBermudanBhutaneseBlackfeetBolivianBrazilianBritishBritish West IndianBulgarianBurmeseCajunCambodianCanadianCape VerdeanCarpatho RusynCelticCentral AmericanCentral American IndianCherokeeCheyenneChickasawChileanChineseChippewaChoctawColombianColvilleComancheCosta RicanCreeCreekCroatianCrowCubanCypriotCzechCzechoslovakianDanishDelawareDominicanDutchDutch West IndianEastern EuropeanEcuadorianEgyptianEnglishEstonianEthiopianEuropeanFijianFilipinoFinnishFrenchFrench American IndianFrench CanadianGermanGerman RussianGhanaianGreekGuamanian/ChamorroGuatemalanGuyaneseHaitianHmongHonduranHopiHoumaHungarianIcelanderIndian (Asian)IndonesianInupiatIranianIraqiIrishIroquoisIsraeliItalianJamaicanJapaneseJordanianKenyanKiowaKoreanLaotianLatvianLebaneseLiberianLithuanianLumbeeLuxembourgerMacedonianMalaysianMalteseMarshalleseMenomineeMexicanMexican American IndianMongolianMoroccanNative HawaiianNavajoNepaleseNew ZealanderNicaraguanNigerianNorthern EuropeanNorwegianOkinawanOsageOttawaPaiutePakistaniPalestinianPanamanianParaguayanPennsylvania GermanPeruvianPimaPolishPortuguesePotawatomiPuebloPuerto RicanPuget Sound SalishRomanianRussianSalvadoranSamoanScandinavianScotch-IrishScottishSeminoleSenegaleseSerbianShoshoneSierra LeoneanSiouxSlavicSlovakSloveneSomaliSouth AfricanSouth AmericanSouth American IndianSoviet UnionSpaniardSpanishSpanish AmericanSpanish American IndianSri LankanSubsaharan AfricanSudaneseSwedishSwissSyrianTaiwaneseThaiTlingit-HaidaTohono O'OdhamTonganTrinidadian and TobagonianTsimshianTurkishU.S. Virgin IslanderUgandanUkrainianUruguayanUteVenezuelanVietnameseWelshWest IndianYakamaYaquiYugoslavianYumanYup'ikZimbabwean
Immigration
NonimmigrantsImmigrantsAfghanistanAfricaAlbaniaArgentinaArmeniaAsiaAustraliaAustriaBahamasBangladeshBarbadosBelarusBelgiumBelizeBoliviaBosnia and HerzegovinaBrazilBulgariaBurma/MyanmarCabo VerdeCambodiaCameroonCanadaCaribbeanCentral AmericaChileChinaColombiaCongoCosta RicaCroatiaCubaCzechoslovakiaDenmarkDominicaDominican RepublicEastern AfricaEastern AsiaEastern EuropeEcuadorEgyptEl SalvadorEnglandEritreaEthiopiaEuropeFijiFranceGermanyGhanaGreeceGrenadaGuatemalaGuyanaHaitiHondurasHong KongHungaryIndiaIndonesiaIranIraqIrelandIsraelItalyJamaicaJapanJordanKazakhstanKenyaKoreaKuwaitLaosLatin AmericaLatviaLebanonLiberiaLithuaniaMalaysiaMexicoMicronesiaMiddle AfricaMoldovaMoroccoNepalNetherlandsNicaraguaNigeriaNorth AmericaNorth MacedoniaNorthern AfricaNorthern EuropeNorwayOceaniaPakistanPanamaPeruPhilippinesPolandPortugalRomaniaRussiaSaudi ArabiaScotlandSenegalSerbiaSierra LeoneSingaporeSomaliaSouth AfricaSouth AmericaSouth Central AsiaSouth Eastern AsiaSouthern EuropeSpainSri LankaSt. Vincent and the GrenadinesSudanSwedenSwitzerlandSyriaTaiwanThailandTrinidad and TobagoTurkeyUgandaUkraineUruguayUzbekistanVenezuelaVietnamWest IndiesWestern AfricaWestern AsiaWestern EuropeYemenZaireZimbabweAzores
Wage/Income Gap
Income
Poverty
Unemployment
Labor Participation
Family Structure
Vehicle Availability
Education Level
Disability

Wage/Income Gap Comparison

Arabs

Immigrants from Yemen

Poor
Exceptional
26.6%
WAGE/INCOME GAP
12.3/ 100
METRIC RATING
210th/ 347
METRIC RANK
21.1%
WAGE/INCOME GAP
100.0/ 100
METRIC RATING
32nd/ 347
METRIC RANK

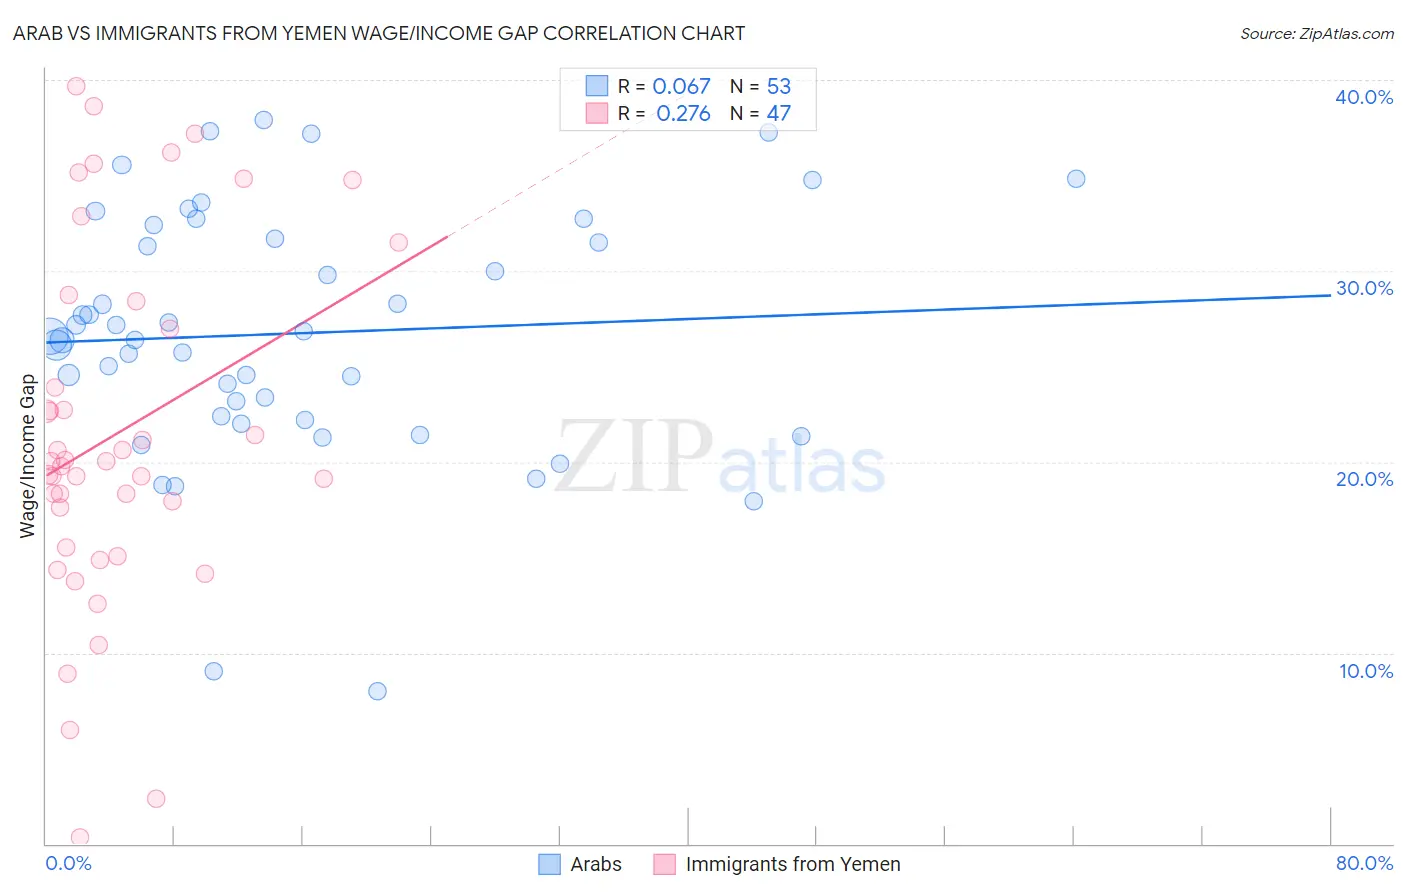
Arab vs Immigrants from Yemen Wage/Income Gap Correlation Chart

The statistical analysis conducted on geographies consisting of 486,307,173 people shows a slight positive correlation between the proportion of Arabs and wage/income gap percentage in the United States with a correlation coefficient (R) of 0.067 and weighted average of 26.6%. Similarly, the statistical analysis conducted on geographies consisting of 82,415,599 people shows a weak positive correlation between the proportion of Immigrants from Yemen and wage/income gap percentage in the United States with a correlation coefficient (R) of 0.276 and weighted average of 21.1%, a difference of 26.3%.
Arab vs Immigrants from Yemen Wage/Income Gap

Wage/Income Gap Correlation Summary

MeasurementArabImmigrants from Yemen
Minimum8.0%0.33%
Maximum37.9%39.7%
Range29.9%39.3%
Mean26.7%21.5%
Median26.6%20.0%
Interquartile 25% (IQ1)22.3%15.5%
Interquartile 75% (IQ3)32.0%28.4%
Interquartile Range (IQR)9.7%12.9%
Standard Deviation (Sample)6.5%9.3%
Standard Deviation (Population)6.4%9.2%

Similar Demographics by Wage/Income Gap

Demographics Similar to Arabs by Wage/Income Gap

In terms of wage/income gap, the demographic groups most similar to Arabs are Immigrants from Kuwait (26.6%, a difference of 0.040%), Egyptian (26.6%, a difference of 0.060%), Mongolian (26.6%, a difference of 0.13%), Iraqi (26.6%, a difference of 0.16%), and Immigrants from Iraq (26.7%, a difference of 0.31%).
DemographicsRating | RankWage/Income Gap
Immigrants | Eastern Europe
19.2
/100
|
#203
Poor
26.4%
Immigrants | Russia
19.0
/100
|
#204
Poor
26.4%
Immigrants | Southern Europe
17.3
/100
|
#205
Poor
26.4%
Indians (Asian)
16.5
/100
|
#206
Poor
26.4%
Immigrants | Italy
15.8
/100
|
#207
Poor
26.5%
Egyptians
12.7
/100
|
#208
Poor
26.6%
Immigrants | Kuwait
12.6
/100
|
#209
Poor
26.6%
Arabs
12.3
/100
|
#210
Poor
26.6%
Mongolians
11.4
/100
|
#211
Poor
26.6%
Iraqis
11.2
/100
|
#212
Poor
26.6%
Immigrants | Iraq
10.3
/100
|
#213
Poor
26.7%
Immigrants | China
10.3
/100
|
#214
Poor
26.7%
Yugoslavians
9.7
/100
|
#215
Tragic
26.7%
Immigrants | Portugal
9.5
/100
|
#216
Tragic
26.7%
Brazilians
9.2
/100
|
#217
Tragic
26.7%

Demographics Similar to Immigrants from Yemen by Wage/Income Gap

In terms of wage/income gap, the demographic groups most similar to Immigrants from Yemen are Immigrants from Bahamas (21.1%, a difference of 0.010%), Vietnamese (21.0%, a difference of 0.23%), Pima (21.1%, a difference of 0.30%), Immigrants from Bangladesh (20.9%, a difference of 0.51%), and Immigrants from Senegal (20.9%, a difference of 0.73%).
DemographicsRating | RankWage/Income Gap
Senegalese
100.0
/100
|
#25
Exceptional
20.7%
Pueblo
100.0
/100
|
#26
Exceptional
20.7%
Immigrants | Armenia
100.0
/100
|
#27
Exceptional
20.7%
Inupiat
100.0
/100
|
#28
Exceptional
20.8%
Immigrants | Senegal
100.0
/100
|
#29
Exceptional
20.9%
Immigrants | Bangladesh
100.0
/100
|
#30
Exceptional
20.9%
Vietnamese
100.0
/100
|
#31
Exceptional
21.0%
Immigrants | Yemen
100.0
/100
|
#32
Exceptional
21.1%
Immigrants | Bahamas
100.0
/100
|
#33
Exceptional
21.1%
Pima
100.0
/100
|
#34
Exceptional
21.1%
Somalis
100.0
/100
|
#35
Exceptional
21.2%
Belizeans
100.0
/100
|
#36
Exceptional
21.2%
Immigrants | Somalia
100.0
/100
|
#37
Exceptional
21.2%
Immigrants | Belize
100.0
/100
|
#38
Exceptional
21.3%
Colville
100.0
/100
|
#39
Exceptional
21.3%