Nicaraguan vs Immigrants from Uzbekistan Wage/Income Gap
COMPARE
Nicaraguan
Immigrants from Uzbekistan
Wage/Income Gap
Wage/Income Gap Comparison
Nicaraguans
Immigrants from Uzbekistan
23.4%
WAGE/INCOME GAP
99.6/ 100
METRIC RATING
90th/ 347
METRIC RANK
22.7%
WAGE/INCOME GAP
99.9/ 100
METRIC RATING
70th/ 347
METRIC RANK
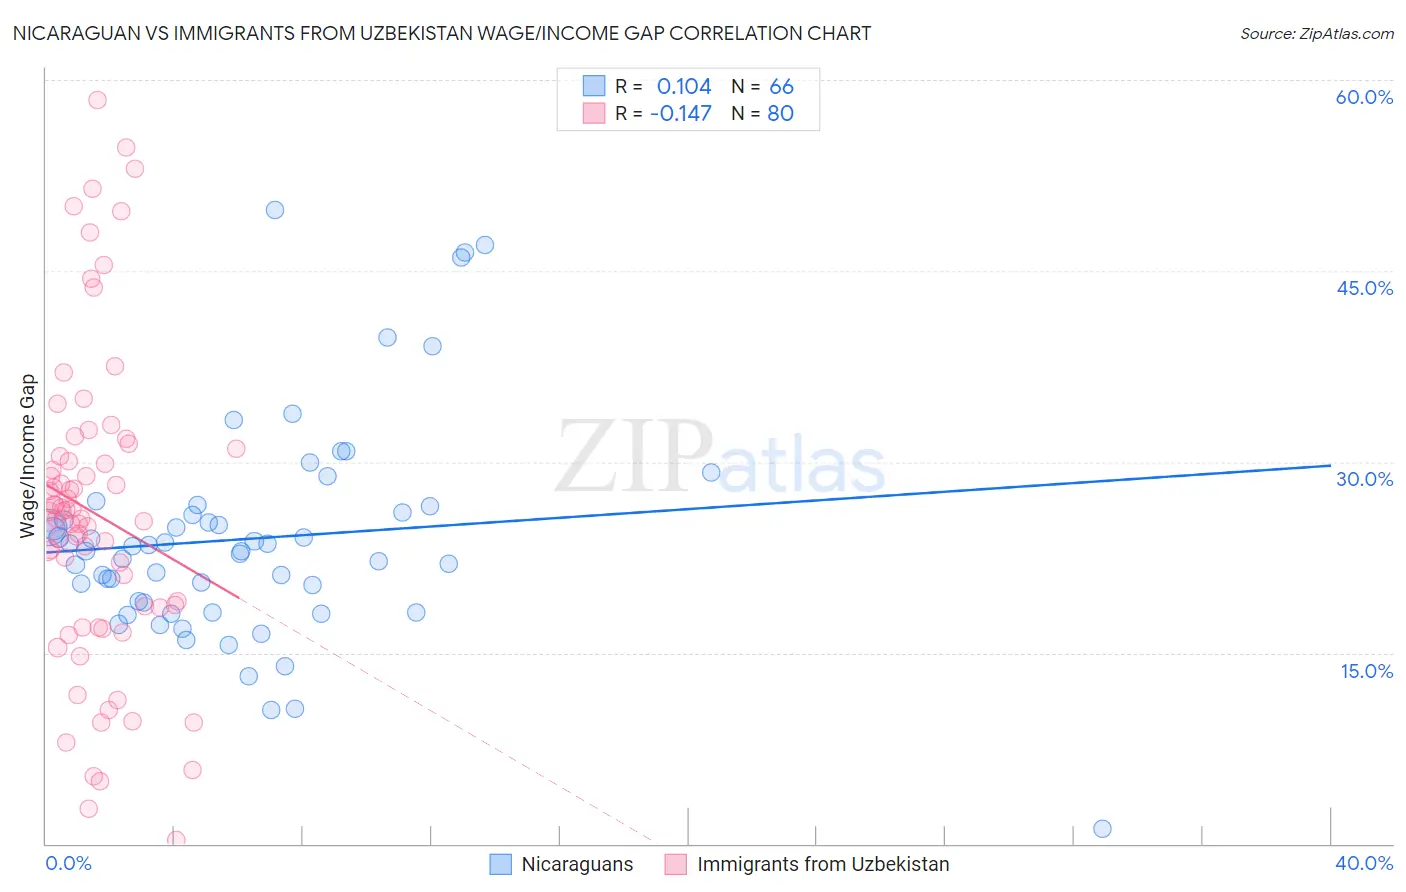
Nicaraguan vs Immigrants from Uzbekistan Wage/Income Gap Correlation Chart
The statistical analysis conducted on geographies consisting of 285,636,386 people shows a poor positive correlation between the proportion of Nicaraguans and wage/income gap percentage in the United States with a correlation coefficient (R) of 0.104 and weighted average of 23.4%. Similarly, the statistical analysis conducted on geographies consisting of 118,761,905 people shows a poor negative correlation between the proportion of Immigrants from Uzbekistan and wage/income gap percentage in the United States with a correlation coefficient (R) of -0.147 and weighted average of 22.7%, a difference of 3.0%.
Wage/Income Gap Correlation Summary
| Measurement | Nicaraguan | Immigrants from Uzbekistan |
| Minimum | 1.2% | 0.26% |
| Maximum | 49.8% | 58.5% |
| Range | 48.6% | 58.2% |
| Mean | 24.0% | 26.0% |
| Median | 23.2% | 25.8% |
| Interquartile 25% (IQ1) | 18.9% | 18.6% |
| Interquartile 75% (IQ3) | 26.0% | 30.7% |
| Interquartile Range (IQR) | 7.1% | 12.1% |
| Standard Deviation (Sample) | 8.6% | 12.3% |
| Standard Deviation (Population) | 8.5% | 12.2% |
Demographics Similar to Nicaraguans and Immigrants from Uzbekistan by Wage/Income Gap
In terms of wage/income gap, the demographic groups most similar to Nicaraguans are Marshallese (23.4%, a difference of 0.010%), Immigrants from Panama (23.4%, a difference of 0.10%), Yuman (23.3%, a difference of 0.42%), Cheyenne (23.3%, a difference of 0.47%), and Immigrants from Cambodia (23.3%, a difference of 0.67%). Similarly, the demographic groups most similar to Immigrants from Uzbekistan are Immigrants from El Salvador (22.8%, a difference of 0.17%), Subsaharan African (22.8%, a difference of 0.31%), Immigrants from Eastern Africa (22.8%, a difference of 0.34%), Immigrants from Burma/Myanmar (22.8%, a difference of 0.42%), and Fijian (22.9%, a difference of 0.71%).
| Demographics | Rating | Rank | Wage/Income Gap |
| Immigrants | Uzbekistan | 99.9 /100 | #70 | Exceptional 22.7% |
| Immigrants | El Salvador | 99.9 /100 | #71 | Exceptional 22.8% |
| Sub-Saharan Africans | 99.9 /100 | #72 | Exceptional 22.8% |
| Immigrants | Eastern Africa | 99.9 /100 | #73 | Exceptional 22.8% |
| Immigrants | Burma/Myanmar | 99.9 /100 | #74 | Exceptional 22.8% |
| Fijians | 99.9 /100 | #75 | Exceptional 22.9% |
| Ecuadorians | 99.9 /100 | #76 | Exceptional 22.9% |
| Africans | 99.9 /100 | #77 | Exceptional 22.9% |
| Nigerians | 99.9 /100 | #78 | Exceptional 23.0% |
| Immigrants | Nicaragua | 99.9 /100 | #79 | Exceptional 23.0% |
| Salvadorans | 99.9 /100 | #80 | Exceptional 23.0% |
| Bermudans | 99.8 /100 | #81 | Exceptional 23.1% |
| Central Americans | 99.8 /100 | #82 | Exceptional 23.1% |
| Immigrants | Africa | 99.8 /100 | #83 | Exceptional 23.2% |
| Cubans | 99.7 /100 | #84 | Exceptional 23.3% |
| Immigrants | Cambodia | 99.7 /100 | #85 | Exceptional 23.3% |
| Cheyenne | 99.7 /100 | #86 | Exceptional 23.3% |
| Yuman | 99.7 /100 | #87 | Exceptional 23.3% |
| Immigrants | Panama | 99.6 /100 | #88 | Exceptional 23.4% |
| Marshallese | 99.6 /100 | #89 | Exceptional 23.4% |
| Nicaraguans | 99.6 /100 | #90 | Exceptional 23.4% |