Native/Alaskan Single Mother Households
COMPARE
Native/Alaskan
Select to Compare
Single Mother Households
Native/Alaskan Single Mother Households
8.0%
SINGLE MOTHER HOUSEHOLDS
0.0/ 100
METRIC RATING
304th/ 347
METRIC RANK
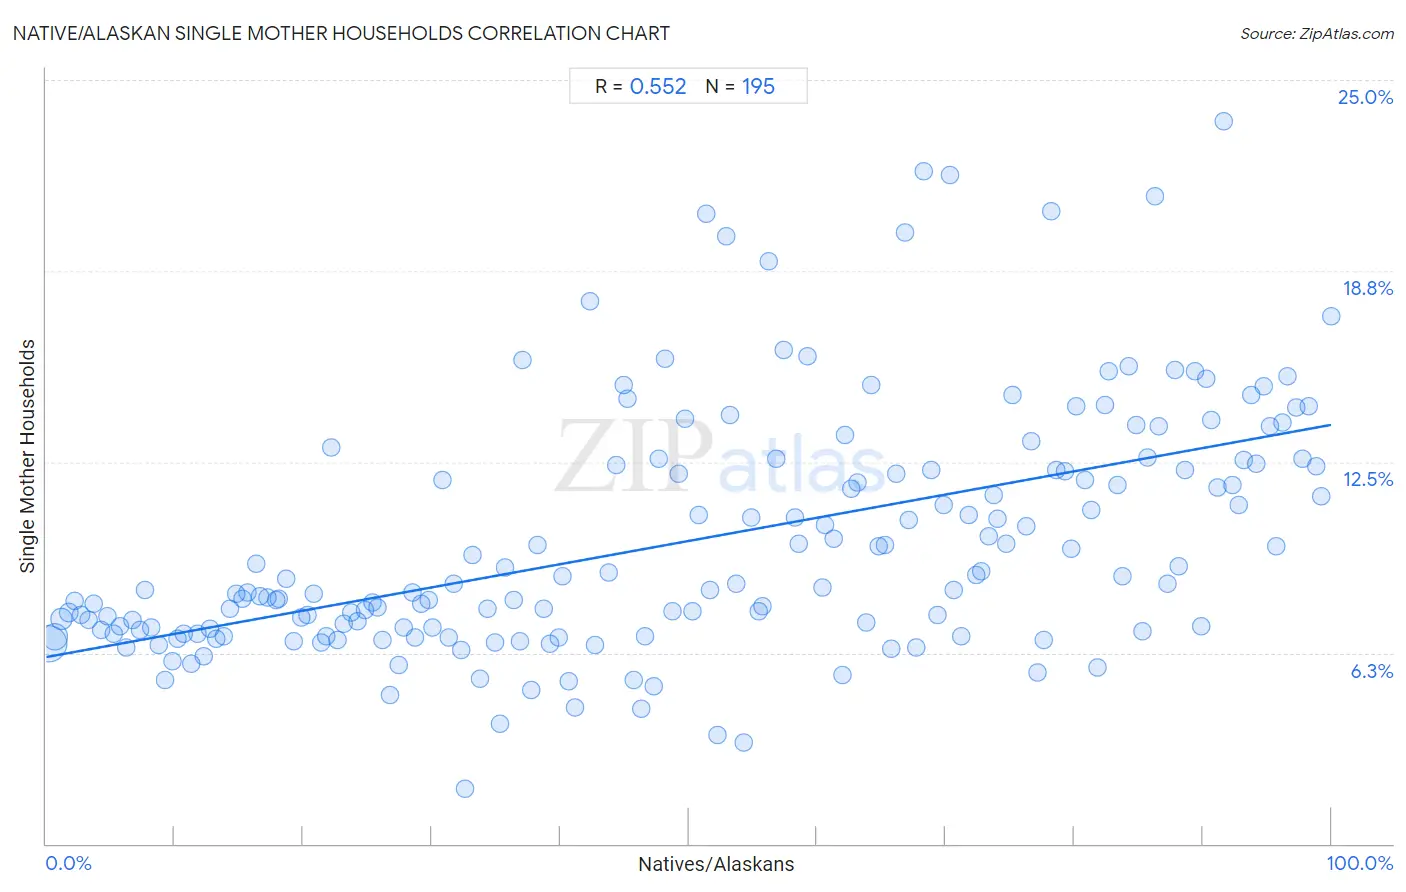
Native/Alaskan Single Mother Households Correlation Chart
The statistical analysis conducted on geographies consisting of 510,596,383 people shows a substantial positive correlation between the proportion of Natives/Alaskans and percentage of single mother households in the United States with a correlation coefficient (R) of 0.552 and weighted average of 8.0%. On average, for every 1% (one percent) increase in Natives/Alaskans within a typical geography, there is an increase of 0.076% in percentage of single mother households.
It is essential to understand that the correlation between the percentage of Natives/Alaskans and percentage of single mother households does not imply a direct cause-and-effect relationship. It remains uncertain whether the presence of Natives/Alaskans influences an upward or downward trend in the level of percentage of single mother households within an area, or if Natives/Alaskans simply ended up residing in those areas with higher or lower levels of percentage of single mother households due to other factors.
Demographics Similar to Natives/Alaskans by Single Mother Households
In terms of single mother households, the demographic groups most similar to Natives/Alaskans are Colville (8.0%, a difference of 0.050%), Immigrants from Barbados (8.0%, a difference of 0.12%), Immigrants from St. Vincent and the Grenadines (8.0%, a difference of 0.36%), Immigrants from Central America (8.1%, a difference of 0.38%), and Immigrants from Bahamas (8.0%, a difference of 0.44%).
| Demographics | Rating | Rank | Single Mother Households |
| Hispanics or Latinos | 0.0 /100 | #297 | Tragic 7.9% |
| Immigrants from West Indies | 0.0 /100 | #298 | Tragic 7.9% |
| Houma | 0.0 /100 | #299 | Tragic 7.9% |
| Mexicans | 0.0 /100 | #300 | Tragic 8.0% |
| Chippewa | 0.0 /100 | #301 | Tragic 8.0% |
| Immigrants from Ghana | 0.0 /100 | #302 | Tragic 8.0% |
| Immigrants from Bahamas | 0.0 /100 | #303 | Tragic 8.0% |
| Natives/Alaskans | 0.0 /100 | #304 | Tragic 8.0% |
| Colville | 0.0 /100 | #305 | Tragic 8.0% |
| Immigrants from Barbados | 0.0 /100 | #306 | Tragic 8.0% |
| Immigrants from St. Vincent and the Grenadines | 0.0 /100 | #307 | Tragic 8.0% |
| Immigrants from Central America | 0.0 /100 | #308 | Tragic 8.1% |
| Cheyenne | 0.0 /100 | #309 | Tragic 8.1% |
| Hondurans | 0.0 /100 | #310 | Tragic 8.1% |
| Immigrants from Congo | 0.0 /100 | #311 | Tragic 8.1% |
Native/Alaskan Single Mother Households Correlation Summary
| Measurement | Native/Alaskan Data | Single Mother Households Data |
| Minimum | 0.21% | 1.8% |
| Maximum | 100.0% | 23.6% |
| Range | 99.8% | 21.8% |
| Mean | 49.9% | 9.9% |
| Median | 49.7% | 8.4% |
| Interquartile 25% (IQ1) | 24.3% | 7.0% |
| Interquartile 75% (IQ3) | 75.2% | 12.4% |
| Interquartile Range (IQR) | 50.9% | 5.4% |
| Standard Deviation (Sample) | 29.2% | 4.0% |
| Standard Deviation (Population) | 29.2% | 4.0% |
Correlation Details
| Native/Alaskan Percentile | Sample Size | Single Mother Households |
[ 0.0% - 0.5% ] 0.21% | 287,588,271 | 6.5% |
[ 0.5% - 1.0% ] 0.71% | 118,319,738 | 6.8% |
[ 1.0% - 1.5% ] 1.20% | 51,307,451 | 7.3% |
[ 1.5% - 2.0% ] 1.72% | 18,036,087 | 7.6% |
[ 2.0% - 2.5% ] 2.20% | 10,969,804 | 7.9% |
[ 2.5% - 3.0% ] 2.71% | 4,818,847 | 7.5% |
[ 3.0% - 3.5% ] 3.26% | 4,314,591 | 7.3% |
[ 3.5% - 4.0% ] 3.72% | 2,033,035 | 7.9% |
[ 4.0% - 4.5% ] 4.26% | 2,545,530 | 7.0% |
[ 4.5% - 5.0% ] 4.76% | 1,791,603 | 7.5% |
[ 5.0% - 5.5% ] 5.22% | 676,716 | 6.9% |
[ 5.5% - 6.0% ] 5.73% | 845,301 | 7.1% |
[ 6.0% - 6.5% ] 6.25% | 652,160 | 6.4% |
[ 6.5% - 7.0% ] 6.74% | 371,143 | 7.3% |
[ 7.0% - 7.5% ] 7.32% | 690,408 | 7.0% |
[ 7.5% - 8.0% ] 7.70% | 359,771 | 8.3% |
[ 8.0% - 8.5% ] 8.21% | 377,887 | 7.1% |
[ 8.5% - 9.0% ] 8.72% | 402,886 | 6.5% |
[ 9.0% - 9.5% ] 9.23% | 271,967 | 5.4% |
[ 9.5% - 10.0% ] 9.79% | 242,612 | 6.0% |
[ 10.0% - 10.5% ] 10.25% | 151,674 | 6.7% |
[ 10.5% - 11.0% ] 10.70% | 131,172 | 6.9% |
[ 11.0% - 11.5% ] 11.32% | 182,778 | 5.9% |
[ 11.5% - 12.0% ] 11.78% | 190,903 | 6.9% |
[ 12.0% - 12.5% ] 12.23% | 229,584 | 6.2% |
[ 12.5% - 13.0% ] 12.77% | 132,215 | 7.1% |
[ 13.0% - 13.5% ] 13.26% | 94,015 | 6.7% |
[ 13.5% - 14.0% ] 13.81% | 140,239 | 6.8% |
[ 14.0% - 14.5% ] 14.28% | 72,476 | 7.7% |
[ 14.5% - 15.0% ] 14.77% | 98,672 | 8.2% |
[ 15.0% - 15.5% ] 15.24% | 111,088 | 8.0% |
[ 15.5% - 16.0% ] 15.65% | 64,033 | 8.2% |
[ 16.0% - 16.5% ] 16.33% | 33,223 | 9.2% |
[ 16.5% - 17.0% ] 16.65% | 84,558 | 8.1% |
[ 17.0% - 17.5% ] 17.23% | 88,236 | 8.1% |
[ 17.5% - 18.0% ] 17.85% | 98,446 | 8.0% |
[ 18.0% - 18.5% ] 18.13% | 125,295 | 8.0% |
[ 18.5% - 19.0% ] 18.71% | 38,089 | 8.7% |
[ 19.0% - 19.5% ] 19.31% | 85,863 | 6.6% |
[ 19.5% - 20.0% ] 19.82% | 44,245 | 7.4% |
[ 20.0% - 20.5% ] 20.31% | 43,786 | 7.5% |
[ 20.5% - 21.0% ] 20.85% | 32,127 | 8.2% |
[ 21.0% - 21.5% ] 21.40% | 28,126 | 6.6% |
[ 21.5% - 22.0% ] 21.81% | 38,102 | 6.8% |
[ 22.0% - 22.5% ] 22.17% | 8,140 | 13.0% |
[ 22.5% - 23.0% ] 22.66% | 35,486 | 6.7% |
[ 23.0% - 23.5% ] 23.17% | 14,999 | 7.2% |
[ 23.5% - 24.0% ] 23.72% | 23,005 | 7.6% |
[ 24.0% - 24.5% ] 24.27% | 24,970 | 7.3% |
[ 24.5% - 25.0% ] 24.78% | 19,641 | 7.6% |
[ 25.0% - 25.5% ] 25.41% | 14,804 | 7.9% |
[ 25.5% - 26.0% ] 25.78% | 14,493 | 7.7% |
[ 26.0% - 26.5% ] 26.19% | 12,229 | 6.7% |
[ 26.5% - 27.0% ] 26.71% | 7,532 | 4.9% |
[ 27.0% - 27.5% ] 27.46% | 13,948 | 5.9% |
[ 27.5% - 28.0% ] 27.81% | 17,532 | 7.1% |
[ 28.0% - 28.5% ] 28.48% | 55,430 | 8.2% |
[ 28.5% - 29.0% ] 28.65% | 4,447 | 6.7% |
[ 29.0% - 29.5% ] 29.20% | 8,562 | 7.8% |
[ 29.5% - 30.0% ] 29.80% | 34,612 | 8.0% |
[ 30.0% - 30.5% ] 30.09% | 28,146 | 7.1% |
[ 30.5% - 31.0% ] 30.81% | 9,861 | 11.9% |
[ 31.0% - 31.5% ] 31.36% | 9,246 | 6.7% |
[ 31.5% - 32.0% ] 31.70% | 5,840 | 8.5% |
[ 32.0% - 32.5% ] 32.31% | 20,978 | 6.3% |
[ 32.5% - 33.0% ] 32.58% | 5,310 | 1.8% |
[ 33.0% - 33.5% ] 33.17% | 59,152 | 9.5% |
[ 33.5% - 34.0% ] 33.78% | 7,995 | 5.4% |
[ 34.0% - 34.5% ] 34.32% | 37,189 | 7.7% |
[ 34.5% - 35.0% ] 34.88% | 11,899 | 6.6% |
[ 35.0% - 35.5% ] 35.32% | 5,079 | 3.9% |
[ 35.5% - 36.0% ] 35.71% | 18,060 | 9.1% |
[ 36.0% - 36.5% ] 36.35% | 4,072 | 8.0% |
[ 36.5% - 37.0% ] 36.91% | 1,880 | 6.6% |
[ 37.0% - 37.5% ] 37.08% | 10,277 | 15.8% |
[ 37.5% - 38.0% ] 37.76% | 12,216 | 5.0% |
[ 38.0% - 38.5% ] 38.24% | 11,387 | 9.8% |
[ 38.5% - 39.0% ] 38.69% | 9,868 | 7.7% |
[ 39.0% - 39.5% ] 39.21% | 6,998 | 6.6% |
[ 39.5% - 40.0% ] 39.91% | 4,505 | 6.8% |
[ 40.0% - 40.5% ] 40.18% | 4,828 | 8.8% |
[ 40.5% - 41.0% ] 40.67% | 1,126 | 5.3% |
[ 41.0% - 41.5% ] 41.13% | 4,257 | 4.5% |
[ 42.0% - 42.5% ] 42.29% | 1,783 | 17.7% |
[ 42.5% - 43.0% ] 42.69% | 6,409 | 6.5% |
[ 43.5% - 44.0% ] 43.78% | 2,748 | 8.9% |
[ 44.0% - 44.5% ] 44.32% | 774 | 12.4% |
[ 44.5% - 45.0% ] 44.90% | 7,114 | 15.0% |
[ 45.0% - 45.5% ] 45.26% | 2,329 | 14.6% |
[ 45.5% - 46.0% ] 45.69% | 348 | 5.3% |
[ 46.0% - 46.5% ] 46.33% | 1,200 | 4.4% |
[ 46.5% - 47.0% ] 46.55% | 14,983 | 6.8% |
[ 47.0% - 47.5% ] 47.29% | 4,060 | 5.2% |
[ 47.5% - 48.0% ] 47.68% | 22,753 | 12.6% |
[ 48.0% - 48.5% ] 48.19% | 7,344 | 15.9% |
[ 48.5% - 49.0% ] 48.69% | 1,719 | 7.6% |
[ 49.0% - 49.5% ] 49.17% | 28,147 | 12.1% |
[ 49.5% - 50.0% ] 49.74% | 5,139 | 13.9% |
[ 50.0% - 50.5% ] 50.32% | 1,393 | 7.6% |
[ 50.5% - 51.0% ] 50.81% | 6,703 | 10.8% |
[ 51.0% - 51.5% ] 51.32% | 2,009 | 20.6% |
[ 51.5% - 52.0% ] 51.68% | 5,371 | 8.3% |
[ 52.0% - 52.5% ] 52.27% | 2,267 | 3.6% |
[ 52.5% - 53.0% ] 52.93% | 735 | 19.9% |
[ 53.0% - 53.5% ] 53.19% | 15,015 | 14.0% |
[ 53.5% - 54.0% ] 53.70% | 16,907 | 8.5% |
[ 54.0% - 54.5% ] 54.25% | 1,329 | 3.3% |
[ 54.5% - 55.0% ] 54.91% | 5,101 | 10.7% |
[ 55.0% - 55.5% ] 55.44% | 9,749 | 7.6% |
[ 55.5% - 56.0% ] 55.72% | 10,236 | 7.8% |
[ 56.0% - 56.5% ] 56.22% | 2,362 | 19.1% |
[ 56.5% - 57.0% ] 56.80% | 2,391 | 12.6% |
[ 57.0% - 57.5% ] 57.39% | 115 | 16.2% |
[ 58.0% - 58.5% ] 58.28% | 5,666 | 10.7% |
[ 58.5% - 59.0% ] 58.59% | 1,386 | 9.8% |
[ 59.0% - 59.5% ] 59.21% | 581 | 16.0% |
[ 60.0% - 60.5% ] 60.36% | 6,176 | 8.4% |
[ 60.5% - 61.0% ] 60.62% | 8,294 | 10.4% |
[ 61.0% - 61.5% ] 61.26% | 14,494 | 10.0% |
[ 61.5% - 62.0% ] 61.94% | 3,263 | 5.5% |
[ 62.0% - 62.5% ] 62.12% | 2,117 | 13.4% |
[ 62.5% - 63.0% ] 62.62% | 4,339 | 11.6% |
[ 63.0% - 63.5% ] 63.16% | 2,481 | 11.8% |
[ 63.5% - 64.0% ] 63.80% | 11,444 | 7.2% |
[ 64.0% - 64.5% ] 64.21% | 3,663 | 15.0% |
[ 64.5% - 65.0% ] 64.77% | 12,190 | 9.7% |
[ 65.0% - 65.5% ] 65.24% | 13,874 | 9.8% |
[ 65.5% - 66.0% ] 65.78% | 2,031 | 6.4% |
[ 66.0% - 66.5% ] 66.17% | 2,663 | 12.1% |
[ 66.5% - 67.0% ] 66.79% | 804 | 20.0% |
[ 67.0% - 67.5% ] 67.16% | 5,826 | 10.6% |
[ 67.5% - 68.0% ] 67.71% | 11,170 | 6.4% |
[ 68.0% - 68.5% ] 68.31% | 243 | 22.0% |
[ 68.5% - 69.0% ] 68.90% | 14,947 | 12.2% |
[ 69.0% - 69.5% ] 69.36% | 5,275 | 7.5% |
[ 69.5% - 70.0% ] 69.87% | 1,580 | 11.1% |
[ 70.0% - 70.5% ] 70.33% | 792 | 21.9% |
[ 70.5% - 71.0% ] 70.65% | 1,530 | 8.3% |
[ 71.0% - 71.5% ] 71.18% | 4,143 | 6.8% |
[ 71.5% - 72.0% ] 71.83% | 2,886 | 10.8% |
[ 72.0% - 72.5% ] 72.39% | 11,661 | 8.8% |
[ 72.5% - 73.0% ] 72.80% | 930 | 8.9% |
[ 73.0% - 73.5% ] 73.30% | 19,235 | 10.1% |
[ 73.5% - 74.0% ] 73.75% | 461 | 11.4% |
[ 74.0% - 74.5% ] 74.06% | 3,632 | 10.6% |
[ 74.5% - 75.0% ] 74.75% | 7,402 | 9.8% |
[ 75.0% - 75.5% ] 75.22% | 3,248 | 14.7% |
[ 76.0% - 76.5% ] 76.29% | 5,943 | 10.4% |
[ 76.5% - 77.0% ] 76.67% | 9,084 | 13.2% |
[ 77.0% - 77.5% ] 77.18% | 7,261 | 5.6% |
[ 77.5% - 78.0% ] 77.65% | 1,356 | 6.7% |
[ 78.0% - 78.5% ] 78.19% | 2,811 | 20.7% |
[ 78.5% - 79.0% ] 78.63% | 2,209 | 12.3% |
[ 79.0% - 79.5% ] 79.26% | 11,199 | 12.2% |
[ 79.5% - 80.0% ] 79.73% | 12,272 | 9.7% |
[ 80.0% - 80.5% ] 80.17% | 8,079 | 14.3% |
[ 80.5% - 81.0% ] 80.88% | 4,100 | 11.9% |
[ 81.0% - 81.5% ] 81.32% | 2,629 | 10.9% |
[ 81.5% - 82.0% ] 81.76% | 4,266 | 5.8% |
[ 82.0% - 82.5% ] 82.43% | 882 | 14.4% |
[ 82.5% - 83.0% ] 82.68% | 7,581 | 15.5% |
[ 83.0% - 83.5% ] 83.39% | 14,068 | 11.8% |
[ 83.5% - 84.0% ] 83.72% | 9,673 | 8.7% |
[ 84.0% - 84.5% ] 84.28% | 4,993 | 15.6% |
[ 84.5% - 85.0% ] 84.84% | 24,712 | 13.7% |
[ 85.0% - 85.5% ] 85.31% | 7,932 | 7.0% |
[ 85.5% - 86.0% ] 85.70% | 9,663 | 12.6% |
[ 86.0% - 86.5% ] 86.27% | 2,687 | 21.2% |
[ 86.5% - 87.0% ] 86.60% | 6,978 | 13.7% |
[ 87.0% - 87.5% ] 87.29% | 2,109 | 8.5% |
[ 87.5% - 88.0% ] 87.86% | 6,968 | 15.5% |
[ 88.0% - 88.5% ] 88.16% | 7,303 | 9.1% |
[ 88.5% - 89.0% ] 88.66% | 17,950 | 12.2% |
[ 89.0% - 89.5% ] 89.36% | 10,270 | 15.5% |
[ 89.5% - 90.0% ] 89.87% | 2,832 | 7.1% |
[ 90.0% - 90.5% ] 90.31% | 13,699 | 15.2% |
[ 90.5% - 91.0% ] 90.63% | 21,005 | 13.9% |
[ 91.0% - 91.5% ] 91.17% | 16,123 | 11.7% |
[ 91.5% - 92.0% ] 91.67% | 9,201 | 23.6% |
[ 92.0% - 92.5% ] 92.28% | 18,094 | 11.8% |
[ 92.5% - 93.0% ] 92.84% | 39,699 | 11.1% |
[ 93.0% - 93.5% ] 93.17% | 20,298 | 12.6% |
[ 93.5% - 94.0% ] 93.78% | 28,716 | 14.7% |
[ 94.0% - 94.5% ] 94.17% | 16,722 | 12.4% |
[ 94.5% - 95.0% ] 94.75% | 37,491 | 15.0% |
[ 95.0% - 95.5% ] 95.19% | 23,870 | 13.7% |
[ 95.5% - 96.0% ] 95.70% | 32,853 | 9.8% |
[ 96.0% - 96.5% ] 96.24% | 21,848 | 13.8% |
[ 96.5% - 97.0% ] 96.57% | 23,237 | 15.3% |
[ 97.0% - 97.5% ] 97.26% | 13,951 | 14.3% |
[ 97.5% - 98.0% ] 97.75% | 32,793 | 12.6% |
[ 98.0% - 98.5% ] 98.27% | 20,076 | 14.3% |
[ 98.5% - 99.0% ] 98.80% | 17,139 | 12.4% |
[ 99.0% - 99.5% ] 99.26% | 21,129 | 11.4% |
[ 99.5% - 100.0% ] 99.99% | 26,917 | 17.3% |