Native/Alaskan Median Male Earnings
COMPARE
Native/Alaskan
Select to Compare
Median Male Earnings
Native/Alaskan Median Male Earnings
$44,775
EARNINGS | MALES
0.0/ 100
METRIC RATING
331st/ 347
METRIC RANK
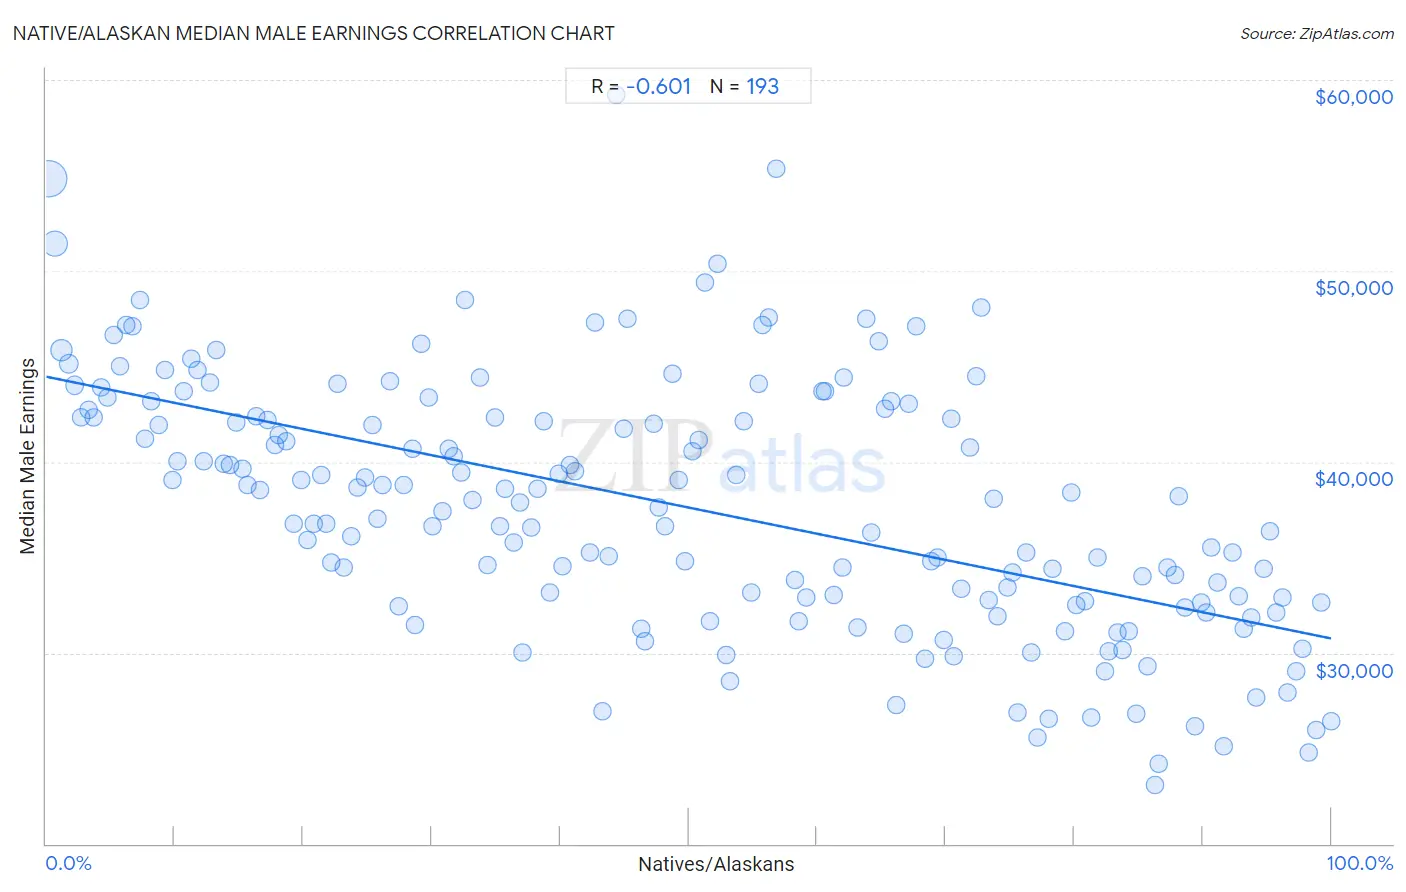
Native/Alaskan Median Male Earnings Correlation Chart
The statistical analysis conducted on geographies consisting of 512,408,867 people shows a significant negative correlation between the proportion of Natives/Alaskans and median male earnings in the United States with a correlation coefficient (R) of -0.601 and weighted average of $44,775. On average, for every 1% (one percent) increase in Natives/Alaskans within a typical geography, there is a decrease of $137 in median male earnings.
It is essential to understand that the correlation between the percentage of Natives/Alaskans and median male earnings does not imply a direct cause-and-effect relationship. It remains uncertain whether the presence of Natives/Alaskans influences an upward or downward trend in the level of median male earnings within an area, or if Natives/Alaskans simply ended up residing in those areas with higher or lower levels of median male earnings due to other factors.
Demographics Similar to Natives/Alaskans by Median Male Earnings
In terms of median male earnings, the demographic groups most similar to Natives/Alaskans are Bahamian ($44,756, a difference of 0.040%), Immigrants from Mexico ($44,960, a difference of 0.41%), Yakama ($45,002, a difference of 0.51%), Kiowa ($45,094, a difference of 0.71%), and Immigrants from Bahamas ($45,176, a difference of 0.90%).
| Demographics | Rating | Rank | Median Male Earnings |
| Blacks/African Americans | 0.0 /100 | #324 | Tragic $45,523 |
| Yuman | 0.0 /100 | #325 | Tragic $45,446 |
| Immigrants from Haiti | 0.0 /100 | #326 | Tragic $45,266 |
| Immigrants from Bahamas | 0.0 /100 | #327 | Tragic $45,176 |
| Kiowa | 0.0 /100 | #328 | Tragic $45,094 |
| Yakama | 0.0 /100 | #329 | Tragic $45,002 |
| Immigrants from Mexico | 0.0 /100 | #330 | Tragic $44,960 |
| Natives/Alaskans | 0.0 /100 | #331 | Tragic $44,775 |
| Bahamians | 0.0 /100 | #332 | Tragic $44,756 |
| Immigrants from Congo | 0.0 /100 | #333 | Tragic $44,204 |
| Immigrants from Yemen | 0.0 /100 | #334 | Tragic $44,083 |
| Spanish American Indians | 0.0 /100 | #335 | Tragic $44,010 |
| Immigrants from Cuba | 0.0 /100 | #336 | Tragic $43,461 |
| Menominee | 0.0 /100 | #337 | Tragic $42,581 |
| Crow | 0.0 /100 | #338 | Tragic $42,434 |
Native/Alaskan Median Male Earnings Correlation Summary
| Measurement | Native/Alaskan Data | Median Male Earnings Data |
| Minimum | 0.21% | $23,050 |
| Maximum | 100.0% | $59,216 |
| Range | 99.8% | $36,166 |
| Mean | 49.7% | $37,642 |
| Median | 49.2% | $37,848 |
| Interquartile 25% (IQ1) | 24.0% | $32,642 |
| Interquartile 75% (IQ3) | 75.4% | $42,387 |
| Interquartile Range (IQR) | 51.4% | $9,745 |
| Standard Deviation (Sample) | 29.3% | $6,692 |
| Standard Deviation (Population) | 29.3% | $6,675 |
Correlation Details
| Native/Alaskan Percentile | Sample Size | Median Male Earnings |
[ 0.0% - 0.5% ] 0.21% | 288,461,416 | $54,845 |
[ 0.5% - 1.0% ] 0.71% | 118,701,384 | $51,413 |
[ 1.0% - 1.5% ] 1.20% | 51,495,580 | $45,839 |
[ 1.5% - 2.0% ] 1.72% | 18,115,787 | $45,150 |
[ 2.0% - 2.5% ] 2.20% | 11,025,911 | $44,011 |
[ 2.5% - 3.0% ] 2.71% | 4,855,115 | $42,344 |
[ 3.0% - 3.5% ] 3.26% | 4,367,622 | $42,724 |
[ 3.5% - 4.0% ] 3.72% | 2,073,175 | $42,335 |
[ 4.0% - 4.5% ] 4.26% | 2,567,907 | $43,898 |
[ 4.5% - 5.0% ] 4.76% | 1,813,435 | $43,386 |
[ 5.0% - 5.5% ] 5.22% | 692,794 | $46,667 |
[ 5.5% - 6.0% ] 5.73% | 859,268 | $44,979 |
[ 6.0% - 6.5% ] 6.24% | 655,764 | $47,161 |
[ 6.5% - 7.0% ] 6.74% | 381,230 | $47,112 |
[ 7.0% - 7.5% ] 7.33% | 692,940 | $48,480 |
[ 7.5% - 8.0% ] 7.70% | 364,054 | $41,233 |
[ 8.0% - 8.5% ] 8.21% | 382,885 | $43,185 |
[ 8.5% - 9.0% ] 8.72% | 400,767 | $41,933 |
[ 9.0% - 9.5% ] 9.23% | 274,926 | $44,819 |
[ 9.5% - 10.0% ] 9.79% | 244,195 | $39,029 |
[ 10.0% - 10.5% ] 10.25% | 154,527 | $40,017 |
[ 10.5% - 11.0% ] 10.69% | 133,015 | $43,726 |
[ 11.0% - 11.5% ] 11.32% | 184,240 | $45,391 |
[ 11.5% - 12.0% ] 11.78% | 198,875 | $44,831 |
[ 12.0% - 12.5% ] 12.23% | 230,732 | $40,008 |
[ 12.5% - 13.0% ] 12.76% | 136,235 | $44,171 |
[ 13.0% - 13.5% ] 13.26% | 94,377 | $45,869 |
[ 13.5% - 14.0% ] 13.81% | 142,074 | $39,880 |
[ 14.0% - 14.5% ] 14.28% | 72,631 | $39,811 |
[ 14.5% - 15.0% ] 14.77% | 100,529 | $42,060 |
[ 15.0% - 15.5% ] 15.24% | 113,128 | $39,621 |
[ 15.5% - 16.0% ] 15.65% | 64,722 | $38,799 |
[ 16.0% - 16.5% ] 16.33% | 33,249 | $42,421 |
[ 16.5% - 17.0% ] 16.65% | 85,319 | $38,540 |
[ 17.0% - 17.5% ] 17.23% | 88,393 | $42,166 |
[ 17.5% - 18.0% ] 17.85% | 101,018 | $40,905 |
[ 18.0% - 18.5% ] 18.13% | 126,589 | $41,392 |
[ 18.5% - 19.0% ] 18.71% | 40,938 | $41,059 |
[ 19.0% - 19.5% ] 19.31% | 88,220 | $36,764 |
[ 19.5% - 20.0% ] 19.82% | 43,502 | $39,035 |
[ 20.0% - 20.5% ] 20.32% | 40,927 | $35,911 |
[ 20.5% - 21.0% ] 20.84% | 31,960 | $36,745 |
[ 21.0% - 21.5% ] 21.40% | 27,818 | $39,294 |
[ 21.5% - 22.0% ] 21.81% | 39,047 | $36,784 |
[ 22.0% - 22.5% ] 22.19% | 8,859 | $34,698 |
[ 22.5% - 23.0% ] 22.66% | 35,777 | $44,078 |
[ 23.0% - 23.5% ] 23.19% | 15,734 | $34,490 |
[ 23.5% - 24.0% ] 23.73% | 24,641 | $36,104 |
[ 24.0% - 24.5% ] 24.26% | 26,677 | $38,681 |
[ 24.5% - 25.0% ] 24.78% | 19,921 | $39,159 |
[ 25.0% - 25.5% ] 25.39% | 15,570 | $41,951 |
[ 25.5% - 26.0% ] 25.78% | 14,557 | $37,034 |
[ 26.0% - 26.5% ] 26.22% | 14,476 | $38,803 |
[ 26.5% - 27.0% ] 26.71% | 7,747 | $44,245 |
[ 27.0% - 27.5% ] 27.46% | 14,370 | $32,443 |
[ 27.5% - 28.0% ] 27.81% | 18,023 | $38,765 |
[ 28.0% - 28.5% ] 28.47% | 55,872 | $40,659 |
[ 28.5% - 29.0% ] 28.70% | 6,982 | $31,452 |
[ 29.0% - 29.5% ] 29.21% | 8,512 | $46,170 |
[ 29.5% - 30.0% ] 29.80% | 34,683 | $43,339 |
[ 30.0% - 30.5% ] 30.09% | 30,264 | $36,658 |
[ 30.5% - 31.0% ] 30.81% | 10,024 | $37,407 |
[ 31.0% - 31.5% ] 31.35% | 9,279 | $40,679 |
[ 31.5% - 32.0% ] 31.69% | 6,084 | $40,288 |
[ 32.0% - 32.5% ] 32.30% | 20,264 | $39,423 |
[ 32.5% - 33.0% ] 32.60% | 5,702 | $48,473 |
[ 33.0% - 33.5% ] 33.17% | 59,666 | $37,971 |
[ 33.5% - 34.0% ] 33.78% | 8,084 | $44,413 |
[ 34.0% - 34.5% ] 34.32% | 36,289 | $34,604 |
[ 34.5% - 35.0% ] 34.88% | 11,778 | $42,353 |
[ 35.0% - 35.5% ] 35.34% | 6,267 | $36,620 |
[ 35.5% - 36.0% ] 35.71% | 18,283 | $38,569 |
[ 36.0% - 36.5% ] 36.34% | 4,122 | $35,755 |
[ 36.5% - 37.0% ] 36.91% | 1,948 | $37,848 |
[ 37.0% - 37.5% ] 37.09% | 10,918 | $29,989 |
[ 37.5% - 38.0% ] 37.76% | 12,349 | $36,556 |
[ 38.0% - 38.5% ] 38.24% | 11,387 | $38,572 |
[ 38.5% - 39.0% ] 38.71% | 8,080 | $42,112 |
[ 39.0% - 39.5% ] 39.21% | 7,366 | $33,137 |
[ 39.5% - 40.0% ] 39.91% | 4,505 | $39,409 |
[ 40.0% - 40.5% ] 40.19% | 4,959 | $34,546 |
[ 40.5% - 41.0% ] 40.72% | 1,444 | $39,826 |
[ 41.0% - 41.5% ] 41.14% | 4,487 | $39,517 |
[ 42.0% - 42.5% ] 42.29% | 2,062 | $35,252 |
[ 42.5% - 43.0% ] 42.69% | 6,409 | $47,316 |
[ 43.0% - 43.5% ] 43.28% | 2,112 | $26,970 |
[ 43.5% - 44.0% ] 43.76% | 2,854 | $35,057 |
[ 44.0% - 44.5% ] 44.33% | 1,076 | $59,216 |
[ 44.5% - 45.0% ] 44.90% | 7,114 | $41,745 |
[ 45.0% - 45.5% ] 45.26% | 2,329 | $47,523 |
[ 46.0% - 46.5% ] 46.33% | 1,200 | $31,257 |
[ 46.5% - 47.0% ] 46.55% | 14,893 | $30,576 |
[ 47.0% - 47.5% ] 47.28% | 4,344 | $41,974 |
[ 47.5% - 48.0% ] 47.68% | 23,007 | $37,606 |
[ 48.0% - 48.5% ] 48.19% | 7,190 | $36,645 |
[ 48.5% - 49.0% ] 48.69% | 1,877 | $44,630 |
[ 49.0% - 49.5% ] 49.17% | 28,147 | $39,023 |
[ 49.5% - 50.0% ] 49.73% | 4,997 | $34,769 |
[ 50.0% - 50.5% ] 50.32% | 1,393 | $40,572 |
[ 50.5% - 51.0% ] 50.81% | 6,140 | $41,171 |
[ 51.0% - 51.5% ] 51.26% | 2,544 | $49,373 |
[ 51.5% - 52.0% ] 51.68% | 5,371 | $31,641 |
[ 52.0% - 52.5% ] 52.28% | 2,548 | $50,357 |
[ 52.5% - 53.0% ] 52.90% | 794 | $29,853 |
[ 53.0% - 53.5% ] 53.19% | 14,688 | $28,509 |
[ 53.5% - 54.0% ] 53.70% | 16,825 | $39,286 |
[ 54.0% - 54.5% ] 54.25% | 1,329 | $42,128 |
[ 54.5% - 55.0% ] 54.90% | 5,621 | $33,165 |
[ 55.0% - 55.5% ] 55.43% | 9,967 | $44,096 |
[ 55.5% - 56.0% ] 55.72% | 10,236 | $47,144 |
[ 56.0% - 56.5% ] 56.22% | 2,362 | $47,567 |
[ 56.5% - 57.0% ] 56.80% | 2,391 | $55,380 |
[ 58.0% - 58.5% ] 58.27% | 5,902 | $33,795 |
[ 58.5% - 59.0% ] 58.57% | 1,103 | $31,630 |
[ 59.0% - 59.5% ] 59.18% | 490 | $32,877 |
[ 60.0% - 60.5% ] 60.36% | 6,176 | $43,721 |
[ 60.5% - 61.0% ] 60.62% | 8,294 | $43,730 |
[ 61.0% - 61.5% ] 61.26% | 14,494 | $33,035 |
[ 61.5% - 62.0% ] 61.94% | 3,263 | $34,455 |
[ 62.0% - 62.5% ] 62.06% | 1,434 | $44,394 |
[ 63.0% - 63.5% ] 63.16% | 2,481 | $31,316 |
[ 63.5% - 64.0% ] 63.80% | 11,444 | $47,512 |
[ 64.0% - 64.5% ] 64.21% | 3,663 | $36,319 |
[ 64.5% - 65.0% ] 64.77% | 12,520 | $46,334 |
[ 65.0% - 65.5% ] 65.24% | 13,632 | $42,759 |
[ 65.5% - 66.0% ] 65.78% | 2,031 | $43,185 |
[ 66.0% - 66.5% ] 66.13% | 2,380 | $27,266 |
[ 66.5% - 67.0% ] 66.78% | 882 | $31,025 |
[ 67.0% - 67.5% ] 67.16% | 5,826 | $43,030 |
[ 67.5% - 68.0% ] 67.71% | 11,170 | $47,077 |
[ 68.0% - 68.5% ] 68.34% | 338 | $29,687 |
[ 68.5% - 69.0% ] 68.90% | 14,947 | $34,798 |
[ 69.0% - 69.5% ] 69.37% | 4,391 | $35,019 |
[ 69.5% - 70.0% ] 69.82% | 676 | $30,680 |
[ 70.0% - 70.5% ] 70.38% | 574 | $42,250 |
[ 70.5% - 71.0% ] 70.65% | 1,530 | $29,844 |
[ 71.0% - 71.5% ] 71.18% | 4,143 | $33,369 |
[ 71.5% - 72.0% ] 71.85% | 2,714 | $40,741 |
[ 72.0% - 72.5% ] 72.39% | 11,661 | $44,478 |
[ 72.5% - 73.0% ] 72.79% | 544 | $48,070 |
[ 73.0% - 73.5% ] 73.31% | 19,043 | $32,798 |
[ 73.5% - 74.0% ] 73.75% | 461 | $38,040 |
[ 74.0% - 74.5% ] 74.06% | 3,632 | $31,892 |
[ 74.5% - 75.0% ] 74.80% | 5,436 | $33,392 |
[ 75.0% - 75.5% ] 75.22% | 3,248 | $34,178 |
[ 75.5% - 76.0% ] 75.59% | 299 | $26,875 |
[ 76.0% - 76.5% ] 76.28% | 6,193 | $35,268 |
[ 76.5% - 77.0% ] 76.68% | 9,485 | $30,011 |
[ 77.0% - 77.5% ] 77.18% | 7,301 | $25,546 |
[ 77.5% - 78.0% ] 77.98% | 218 | $26,533 |
[ 78.0% - 78.5% ] 78.31% | 1,535 | $34,388 |
[ 79.0% - 79.5% ] 79.26% | 11,584 | $31,141 |
[ 79.5% - 80.0% ] 79.72% | 10,217 | $38,408 |
[ 80.0% - 80.5% ] 80.16% | 7,691 | $32,519 |
[ 80.5% - 81.0% ] 80.88% | 4,100 | $32,695 |
[ 81.0% - 81.5% ] 81.33% | 2,683 | $26,642 |
[ 81.5% - 82.0% ] 81.78% | 4,352 | $34,994 |
[ 82.0% - 82.5% ] 82.38% | 1,402 | $29,024 |
[ 82.5% - 83.0% ] 82.69% | 7,007 | $30,066 |
[ 83.0% - 83.5% ] 83.39% | 13,908 | $31,052 |
[ 83.5% - 84.0% ] 83.71% | 9,369 | $30,159 |
[ 84.0% - 84.5% ] 84.26% | 3,417 | $31,140 |
[ 84.5% - 85.0% ] 84.84% | 25,017 | $26,779 |
[ 85.0% - 85.5% ] 85.31% | 7,803 | $33,982 |
[ 85.5% - 86.0% ] 85.68% | 8,952 | $29,293 |
[ 86.0% - 86.5% ] 86.26% | 1,979 | $23,050 |
[ 86.5% - 87.0% ] 86.60% | 6,932 | $24,179 |
[ 87.0% - 87.5% ] 87.29% | 2,070 | $34,437 |
[ 87.5% - 88.0% ] 87.86% | 6,968 | $34,095 |
[ 88.0% - 88.5% ] 88.16% | 7,303 | $38,172 |
[ 88.5% - 89.0% ] 88.64% | 15,822 | $32,389 |
[ 89.0% - 89.5% ] 89.36% | 10,016 | $26,159 |
[ 89.5% - 90.0% ] 89.86% | 2,752 | $32,661 |
[ 90.0% - 90.5% ] 90.31% | 13,937 | $32,143 |
[ 90.5% - 91.0% ] 90.64% | 20,050 | $35,548 |
[ 91.0% - 91.5% ] 91.17% | 16,237 | $33,704 |
[ 91.5% - 92.0% ] 91.68% | 9,544 | $25,080 |
[ 92.0% - 92.5% ] 92.28% | 18,326 | $35,267 |
[ 92.5% - 93.0% ] 92.84% | 39,699 | $32,957 |
[ 93.0% - 93.5% ] 93.16% | 18,759 | $31,230 |
[ 93.5% - 94.0% ] 93.79% | 29,346 | $31,879 |
[ 94.0% - 94.5% ] 94.15% | 15,341 | $27,683 |
[ 94.5% - 95.0% ] 94.75% | 37,491 | $34,400 |
[ 95.0% - 95.5% ] 95.21% | 20,460 | $36,390 |
[ 95.5% - 96.0% ] 95.70% | 32,275 | $32,118 |
[ 96.0% - 96.5% ] 96.25% | 20,180 | $32,914 |
[ 96.5% - 97.0% ] 96.57% | 24,095 | $27,949 |
[ 97.0% - 97.5% ] 97.26% | 12,388 | $29,016 |
[ 97.5% - 98.0% ] 97.75% | 31,189 | $30,228 |
[ 98.0% - 98.5% ] 98.27% | 18,524 | $24,780 |
[ 98.5% - 99.0% ] 98.81% | 14,147 | $25,975 |
[ 99.0% - 99.5% ] 99.26% | 17,724 | $32,624 |
[ 99.5% - 100.0% ] 99.99% | 16,267 | $26,422 |