Native/Alaskan Median Household Income
COMPARE
Native/Alaskan
Select to Compare
Median Household Income
Native/Alaskan Median Household Income
$67,879
HOUSEHOLD INCOME
0.0/ 100
METRIC RATING
331st/ 347
METRIC RANK
Native/Alaskan Median Household Income Correlation Chart
The statistical analysis conducted on geographies consisting of 512,383,553 people shows a moderate negative correlation between the proportion of Natives/Alaskans and median household income in the United States with a correlation coefficient (R) of -0.462 and weighted average of $67,879. On average, for every 1% (one percent) increase in Natives/Alaskans within a typical geography, there is a decrease of $206 in median household income.
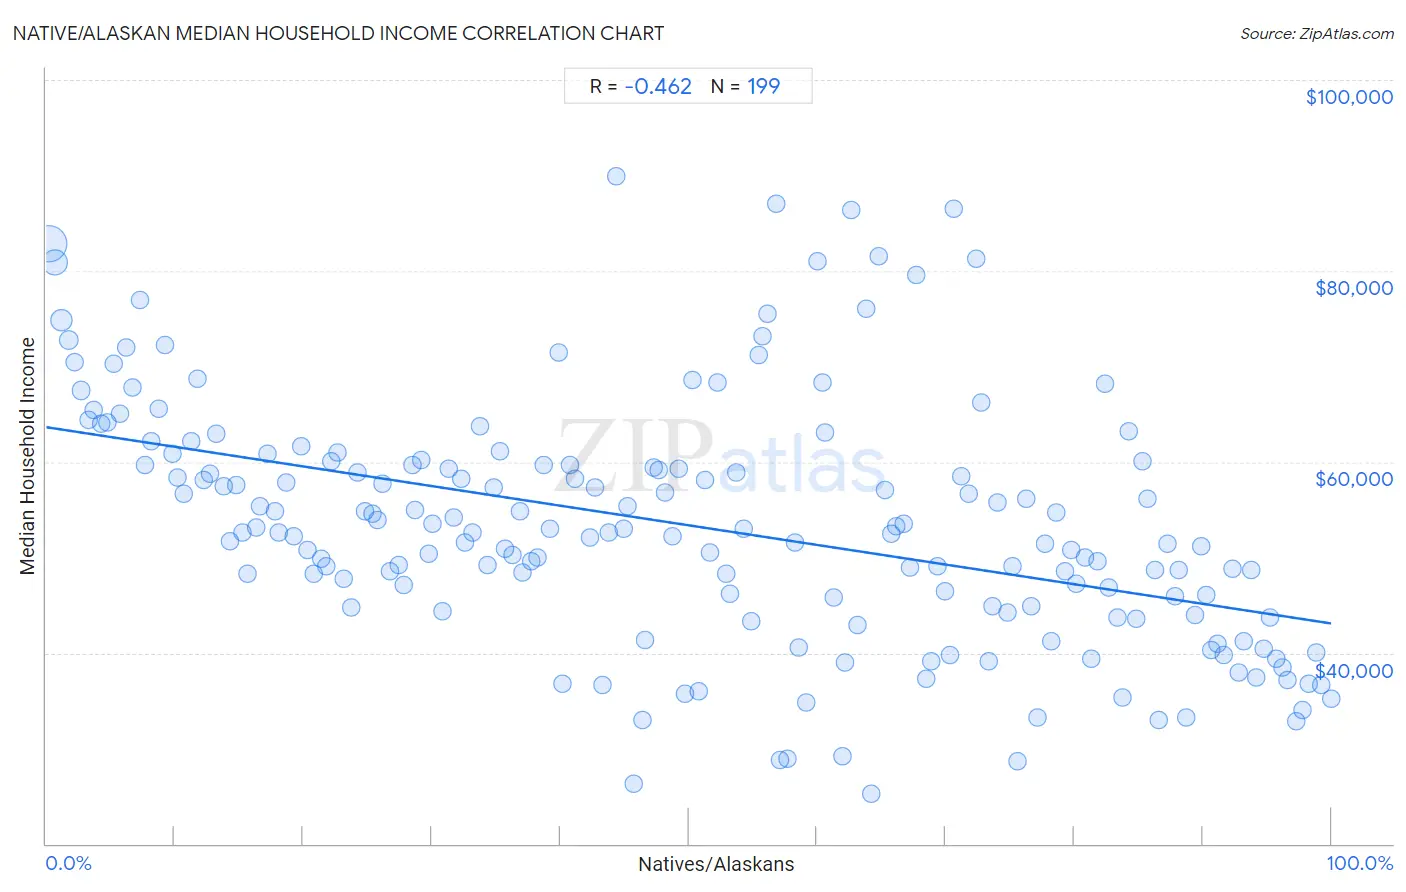
It is essential to understand that the correlation between the percentage of Natives/Alaskans and median household income does not imply a direct cause-and-effect relationship. It remains uncertain whether the presence of Natives/Alaskans influences an upward or downward trend in the level of median household income within an area, or if Natives/Alaskans simply ended up residing in those areas with higher or lower levels of median household income due to other factors.
Demographics Similar to Natives/Alaskans by Median Household Income
In terms of median household income, the demographic groups most similar to Natives/Alaskans are Arapaho ($67,965, a difference of 0.13%), Sioux ($67,792, a difference of 0.13%), Creek ($67,715, a difference of 0.24%), Black/African American ($67,573, a difference of 0.45%), and Dutch West Indian ($68,412, a difference of 0.79%).
| Demographics | Rating | Rank | Median Household Income |
| Yup'ik | 0.0 /100 | #324 | Tragic $69,695 |
| Seminole | 0.0 /100 | #325 | Tragic $69,420 |
| Yuman | 0.0 /100 | #326 | Tragic $68,743 |
| Immigrants from Cuba | 0.0 /100 | #327 | Tragic $68,461 |
| Menominee | 0.0 /100 | #328 | Tragic $68,423 |
| Dutch West Indians | 0.0 /100 | #329 | Tragic $68,412 |
| Arapaho | 0.0 /100 | #330 | Tragic $67,965 |
| Natives/Alaskans | 0.0 /100 | #331 | Tragic $67,879 |
| Sioux | 0.0 /100 | #332 | Tragic $67,792 |
| Creek | 0.0 /100 | #333 | Tragic $67,715 |
| Blacks/African Americans | 0.0 /100 | #334 | Tragic $67,573 |
| Cheyenne | 0.0 /100 | #335 | Tragic $66,974 |
| Immigrants from Congo | 0.0 /100 | #336 | Tragic $66,768 |
| Kiowa | 0.0 /100 | #337 | Tragic $65,914 |
| Immigrants from Yemen | 0.0 /100 | #338 | Tragic $65,194 |
Native/Alaskan Median Household Income Correlation Summary
| Measurement | Native/Alaskan Data | Median Household Income Data |
| Minimum | 0.21% | $25,291 |
| Maximum | 100.0% | $89,884 |
| Range | 99.8% | $64,593 |
| Mean | 50.0% | $53,343 |
| Median | 50.3% | $52,617 |
| Interquartile 25% (IQ1) | 24.8% | $44,793 |
| Interquartile 75% (IQ3) | 75.2% | $60,078 |
| Interquartile Range (IQR) | 50.4% | $15,285 |
| Standard Deviation (Sample) | 29.0% | $12,918 |
| Standard Deviation (Population) | 28.9% | $12,886 |
Correlation Details
| Native/Alaskan Percentile | Sample Size | Median Household Income |
[ 0.0% - 0.5% ] 0.21% | 288,342,492 | $82,793 |
[ 0.5% - 1.0% ] 0.71% | 118,684,033 | $80,847 |
[ 1.0% - 1.5% ] 1.20% | 51,464,135 | $74,856 |
[ 1.5% - 2.0% ] 1.72% | 18,129,386 | $72,752 |
[ 2.0% - 2.5% ] 2.20% | 11,034,208 | $70,443 |
[ 2.5% - 3.0% ] 2.71% | 4,885,190 | $67,480 |
[ 3.0% - 3.5% ] 3.26% | 4,362,140 | $64,427 |
[ 3.5% - 4.0% ] 3.72% | 2,068,777 | $65,448 |
[ 4.0% - 4.5% ] 4.26% | 2,566,438 | $64,049 |
[ 4.5% - 5.0% ] 4.76% | 1,814,505 | $64,125 |
[ 5.0% - 5.5% ] 5.22% | 693,755 | $70,329 |
[ 5.5% - 6.0% ] 5.73% | 859,729 | $65,054 |
[ 6.0% - 6.5% ] 6.25% | 662,056 | $71,987 |
[ 6.5% - 7.0% ] 6.74% | 380,730 | $67,740 |
[ 7.0% - 7.5% ] 7.32% | 696,608 | $77,020 |
[ 7.5% - 8.0% ] 7.70% | 365,104 | $59,610 |
[ 8.0% - 8.5% ] 8.21% | 385,221 | $62,211 |
[ 8.5% - 9.0% ] 8.72% | 407,126 | $65,571 |
[ 9.0% - 9.5% ] 9.23% | 274,833 | $72,227 |
[ 9.5% - 10.0% ] 9.79% | 244,523 | $60,819 |
[ 10.0% - 10.5% ] 10.25% | 155,150 | $58,407 |
[ 10.5% - 11.0% ] 10.70% | 134,990 | $56,672 |
[ 11.0% - 11.5% ] 11.32% | 185,791 | $62,168 |
[ 11.5% - 12.0% ] 11.78% | 199,668 | $68,754 |
[ 12.0% - 12.5% ] 12.23% | 232,955 | $58,097 |
[ 12.5% - 13.0% ] 12.76% | 136,740 | $58,691 |
[ 13.0% - 13.5% ] 13.26% | 95,117 | $62,935 |
[ 13.5% - 14.0% ] 13.81% | 141,777 | $57,460 |
[ 14.0% - 14.5% ] 14.28% | 72,631 | $51,654 |
[ 14.5% - 15.0% ] 14.77% | 100,709 | $57,567 |
[ 15.0% - 15.5% ] 15.24% | 113,447 | $52,643 |
[ 15.5% - 16.0% ] 15.65% | 66,393 | $48,311 |
[ 16.0% - 16.5% ] 16.33% | 33,249 | $53,104 |
[ 16.5% - 17.0% ] 16.65% | 85,959 | $55,291 |
[ 17.0% - 17.5% ] 17.22% | 87,201 | $60,786 |
[ 17.5% - 18.0% ] 17.85% | 100,526 | $54,789 |
[ 18.0% - 18.5% ] 18.13% | 127,098 | $52,632 |
[ 18.5% - 19.0% ] 18.71% | 41,471 | $57,859 |
[ 19.0% - 19.5% ] 19.30% | 90,132 | $52,156 |
[ 19.5% - 20.0% ] 19.82% | 46,462 | $61,643 |
[ 20.0% - 20.5% ] 20.31% | 44,389 | $50,749 |
[ 20.5% - 21.0% ] 20.84% | 32,239 | $48,284 |
[ 21.0% - 21.5% ] 21.40% | 28,865 | $49,837 |
[ 21.5% - 22.0% ] 21.81% | 39,448 | $49,007 |
[ 22.0% - 22.5% ] 22.20% | 9,753 | $60,104 |
[ 22.5% - 23.0% ] 22.66% | 35,656 | $60,922 |
[ 23.0% - 23.5% ] 23.19% | 17,070 | $47,716 |
[ 23.5% - 24.0% ] 23.73% | 24,704 | $44,793 |
[ 24.0% - 24.5% ] 24.26% | 26,980 | $58,950 |
[ 24.5% - 25.0% ] 24.78% | 19,957 | $54,846 |
[ 25.0% - 25.5% ] 25.39% | 15,828 | $54,620 |
[ 25.5% - 26.0% ] 25.78% | 15,387 | $53,865 |
[ 26.0% - 26.5% ] 26.20% | 14,289 | $57,717 |
[ 26.5% - 27.0% ] 26.71% | 8,775 | $48,553 |
[ 27.0% - 27.5% ] 27.45% | 14,988 | $49,145 |
[ 27.5% - 28.0% ] 27.81% | 17,532 | $47,120 |
[ 28.0% - 28.5% ] 28.47% | 56,213 | $59,659 |
[ 28.5% - 29.0% ] 28.70% | 6,944 | $54,984 |
[ 29.0% - 29.5% ] 29.19% | 8,481 | $60,207 |
[ 29.5% - 30.0% ] 29.80% | 34,683 | $50,439 |
[ 30.0% - 30.5% ] 30.09% | 30,264 | $53,533 |
[ 30.5% - 31.0% ] 30.81% | 10,781 | $44,326 |
[ 31.0% - 31.5% ] 31.34% | 8,462 | $59,264 |
[ 31.5% - 32.0% ] 31.69% | 6,179 | $54,145 |
[ 32.0% - 32.5% ] 32.31% | 21,301 | $58,221 |
[ 32.5% - 33.0% ] 32.61% | 5,918 | $51,588 |
[ 33.0% - 33.5% ] 33.17% | 59,591 | $52,617 |
[ 33.5% - 34.0% ] 33.78% | 8,629 | $63,763 |
[ 34.0% - 34.5% ] 34.32% | 37,377 | $49,144 |
[ 34.5% - 35.0% ] 34.87% | 12,300 | $57,287 |
[ 35.0% - 35.5% ] 35.36% | 6,279 | $61,069 |
[ 35.5% - 36.0% ] 35.71% | 18,534 | $50,940 |
[ 36.0% - 36.5% ] 36.33% | 4,305 | $50,210 |
[ 36.5% - 37.0% ] 36.90% | 2,019 | $54,775 |
[ 37.0% - 37.5% ] 37.09% | 10,918 | $48,367 |
[ 37.5% - 38.0% ] 37.76% | 12,216 | $49,580 |
[ 38.0% - 38.5% ] 38.24% | 11,387 | $50,028 |
[ 38.5% - 39.0% ] 38.69% | 10,018 | $59,673 |
[ 39.0% - 39.5% ] 39.21% | 7,680 | $53,011 |
[ 39.5% - 40.0% ] 39.91% | 4,573 | $71,464 |
[ 40.0% - 40.5% ] 40.19% | 5,168 | $36,775 |
[ 40.5% - 41.0% ] 40.72% | 1,444 | $59,628 |
[ 41.0% - 41.5% ] 41.14% | 4,487 | $58,285 |
[ 42.0% - 42.5% ] 42.34% | 1,606 | $52,042 |
[ 42.5% - 43.0% ] 42.69% | 6,409 | $57,261 |
[ 43.0% - 43.5% ] 43.28% | 2,181 | $36,625 |
[ 43.5% - 44.0% ] 43.76% | 3,199 | $52,560 |
[ 44.0% - 44.5% ] 44.36% | 949 | $89,884 |
[ 44.5% - 45.0% ] 44.90% | 7,143 | $52,965 |
[ 45.0% - 45.5% ] 45.25% | 2,400 | $55,349 |
[ 45.5% - 46.0% ] 45.69% | 348 | $26,250 |
[ 46.0% - 46.5% ] 46.36% | 770 | $32,917 |
[ 46.5% - 47.0% ] 46.56% | 15,425 | $41,351 |
[ 47.0% - 47.5% ] 47.29% | 4,166 | $59,420 |
[ 47.5% - 48.0% ] 47.68% | 23,306 | $59,106 |
[ 48.0% - 48.5% ] 48.19% | 7,190 | $56,765 |
[ 48.5% - 49.0% ] 48.71% | 1,973 | $52,194 |
[ 49.0% - 49.5% ] 49.17% | 28,257 | $59,323 |
[ 49.5% - 50.0% ] 49.73% | 4,979 | $35,744 |
[ 50.0% - 50.5% ] 50.32% | 1,393 | $68,547 |
[ 50.5% - 51.0% ] 50.81% | 6,140 | $35,965 |
[ 51.0% - 51.5% ] 51.25% | 2,642 | $58,047 |
[ 51.5% - 52.0% ] 51.68% | 5,371 | $50,484 |
[ 52.0% - 52.5% ] 52.27% | 2,797 | $68,292 |
[ 52.5% - 53.0% ] 52.90% | 794 | $48,289 |
[ 53.0% - 53.5% ] 53.19% | 15,015 | $46,236 |
[ 53.5% - 54.0% ] 53.70% | 16,825 | $58,879 |
[ 54.0% - 54.5% ] 54.25% | 1,329 | $53,040 |
[ 54.5% - 55.0% ] 54.90% | 5,621 | $43,349 |
[ 55.0% - 55.5% ] 55.40% | 10,763 | $71,243 |
[ 55.5% - 56.0% ] 55.70% | 9,555 | $73,110 |
[ 56.0% - 56.5% ] 56.15% | 1,699 | $75,456 |
[ 56.5% - 57.0% ] 56.80% | 2,428 | $87,004 |
[ 57.0% - 57.5% ] 57.14% | 28 | $28,750 |
[ 57.5% - 58.0% ] 57.73% | 291 | $28,967 |
[ 58.0% - 58.5% ] 58.27% | 5,859 | $51,550 |
[ 58.5% - 59.0% ] 58.57% | 1,103 | $40,583 |
[ 59.0% - 59.5% ] 59.18% | 490 | $34,814 |
[ 60.0% - 60.5% ] 60.00% | 270 | $81,029 |
[ 60.0% - 60.5% ] 60.36% | 5,876 | $68,279 |
[ 60.5% - 61.0% ] 60.62% | 8,294 | $63,080 |
[ 61.0% - 61.5% ] 61.26% | 14,494 | $45,840 |
[ 61.5% - 62.0% ] 61.94% | 3,263 | $29,164 |
[ 62.0% - 62.5% ] 62.12% | 2,117 | $38,925 |
[ 62.5% - 63.0% ] 62.60% | 4,222 | $86,379 |
[ 63.0% - 63.5% ] 63.16% | 2,481 | $42,901 |
[ 63.5% - 64.0% ] 63.80% | 11,359 | $76,058 |
[ 64.0% - 64.5% ] 64.21% | 3,677 | $25,291 |
[ 64.5% - 65.0% ] 64.77% | 12,330 | $81,561 |
[ 65.0% - 65.5% ] 65.24% | 13,874 | $57,102 |
[ 65.5% - 66.0% ] 65.78% | 2,031 | $52,536 |
[ 66.0% - 66.5% ] 66.13% | 2,380 | $53,299 |
[ 66.5% - 67.0% ] 66.77% | 948 | $53,542 |
[ 67.0% - 67.5% ] 67.17% | 5,337 | $48,898 |
[ 67.5% - 68.0% ] 67.71% | 11,170 | $79,616 |
[ 68.0% - 68.5% ] 68.46% | 241 | $37,278 |
[ 68.5% - 69.0% ] 68.90% | 15,011 | $39,171 |
[ 69.0% - 69.5% ] 69.37% | 4,888 | $49,120 |
[ 69.5% - 70.0% ] 69.91% | 1,399 | $46,390 |
[ 70.0% - 70.5% ] 70.34% | 890 | $39,721 |
[ 70.5% - 71.0% ] 70.65% | 1,530 | $86,563 |
[ 71.0% - 71.5% ] 71.18% | 4,143 | $58,500 |
[ 71.5% - 72.0% ] 71.83% | 3,003 | $56,688 |
[ 72.0% - 72.5% ] 72.39% | 11,661 | $81,235 |
[ 72.5% - 73.0% ] 72.80% | 930 | $66,221 |
[ 73.0% - 73.5% ] 73.31% | 19,043 | $39,133 |
[ 73.5% - 74.0% ] 73.64% | 755 | $44,858 |
[ 74.0% - 74.5% ] 74.06% | 3,632 | $55,683 |
[ 74.5% - 75.0% ] 74.76% | 7,033 | $44,190 |
[ 75.0% - 75.5% ] 75.22% | 3,248 | $49,094 |
[ 75.5% - 76.0% ] 75.59% | 299 | $28,654 |
[ 76.0% - 76.5% ] 76.27% | 6,671 | $56,162 |
[ 76.5% - 77.0% ] 76.67% | 9,110 | $44,929 |
[ 77.0% - 77.5% ] 77.18% | 7,441 | $33,214 |
[ 77.5% - 78.0% ] 77.70% | 1,614 | $51,458 |
[ 78.0% - 78.5% ] 78.19% | 2,646 | $41,231 |
[ 78.5% - 79.0% ] 78.63% | 2,209 | $54,666 |
[ 79.0% - 79.5% ] 79.26% | 11,584 | $48,565 |
[ 79.5% - 80.0% ] 79.73% | 11,918 | $50,763 |
[ 80.0% - 80.5% ] 80.17% | 8,079 | $47,252 |
[ 80.5% - 81.0% ] 80.88% | 4,100 | $49,942 |
[ 81.0% - 81.5% ] 81.33% | 2,855 | $39,423 |
[ 81.5% - 82.0% ] 81.77% | 4,482 | $49,607 |
[ 82.0% - 82.5% ] 82.37% | 1,492 | $68,195 |
[ 82.5% - 83.0% ] 82.68% | 7,581 | $46,907 |
[ 83.0% - 83.5% ] 83.39% | 14,134 | $43,762 |
[ 83.5% - 84.0% ] 83.72% | 9,673 | $35,320 |
[ 84.0% - 84.5% ] 84.28% | 5,139 | $63,149 |
[ 84.5% - 85.0% ] 84.84% | 24,712 | $43,609 |
[ 85.0% - 85.5% ] 85.31% | 7,530 | $60,078 |
[ 85.5% - 86.0% ] 85.70% | 9,537 | $56,166 |
[ 86.0% - 86.5% ] 86.26% | 2,482 | $48,683 |
[ 86.5% - 87.0% ] 86.60% | 6,978 | $32,958 |
[ 87.0% - 87.5% ] 87.29% | 2,109 | $51,439 |
[ 87.5% - 88.0% ] 87.86% | 6,968 | $45,895 |
[ 88.0% - 88.5% ] 88.16% | 7,303 | $48,735 |
[ 88.5% - 89.0% ] 88.67% | 17,836 | $33,219 |
[ 89.0% - 89.5% ] 89.36% | 10,289 | $43,953 |
[ 89.5% - 90.0% ] 89.88% | 2,568 | $51,178 |
[ 90.0% - 90.5% ] 90.30% | 12,433 | $46,106 |
[ 90.5% - 91.0% ] 90.64% | 21,532 | $40,302 |
[ 91.0% - 91.5% ] 91.17% | 16,237 | $40,887 |
[ 91.5% - 92.0% ] 91.68% | 7,105 | $39,795 |
[ 92.0% - 92.5% ] 92.29% | 19,024 | $48,851 |
[ 92.5% - 93.0% ] 92.84% | 39,643 | $38,000 |
[ 93.0% - 93.5% ] 93.16% | 20,798 | $41,241 |
[ 93.5% - 94.0% ] 93.79% | 29,655 | $48,615 |
[ 94.0% - 94.5% ] 94.17% | 16,881 | $37,370 |
[ 94.5% - 95.0% ] 94.75% | 37,491 | $40,392 |
[ 95.0% - 95.5% ] 95.20% | 21,158 | $43,675 |
[ 95.5% - 96.0% ] 95.70% | 32,853 | $39,424 |
[ 96.0% - 96.5% ] 96.24% | 21,642 | $38,476 |
[ 96.5% - 97.0% ] 96.57% | 25,278 | $37,124 |
[ 97.0% - 97.5% ] 97.26% | 13,483 | $32,881 |
[ 97.5% - 98.0% ] 97.75% | 32,793 | $34,037 |
[ 98.0% - 98.5% ] 98.27% | 20,041 | $36,798 |
[ 98.5% - 99.0% ] 98.80% | 17,051 | $39,980 |
[ 99.0% - 99.5% ] 99.26% | 21,129 | $36,668 |
[ 99.5% - 100.0% ] 99.99% | 25,547 | $35,206 |