Native/Alaskan Median Female Earnings
COMPARE
Native/Alaskan
Select to Compare
Median Female Earnings
Native/Alaskan Median Female Earnings
$33,806
EARNINGS | FEMALES
0.0/ 100
METRIC RATING
331st/ 347
METRIC RANK
Native/Alaskan Median Female Earnings Correlation Chart
The statistical analysis conducted on geographies consisting of 512,112,793 people shows a poor negative correlation between the proportion of Natives/Alaskans and median female earnings in the United States with a correlation coefficient (R) of -0.104 and weighted average of $33,806. On average, for every 1% (one percent) increase in Natives/Alaskans within a typical geography, there is a decrease of $17 in median female earnings.
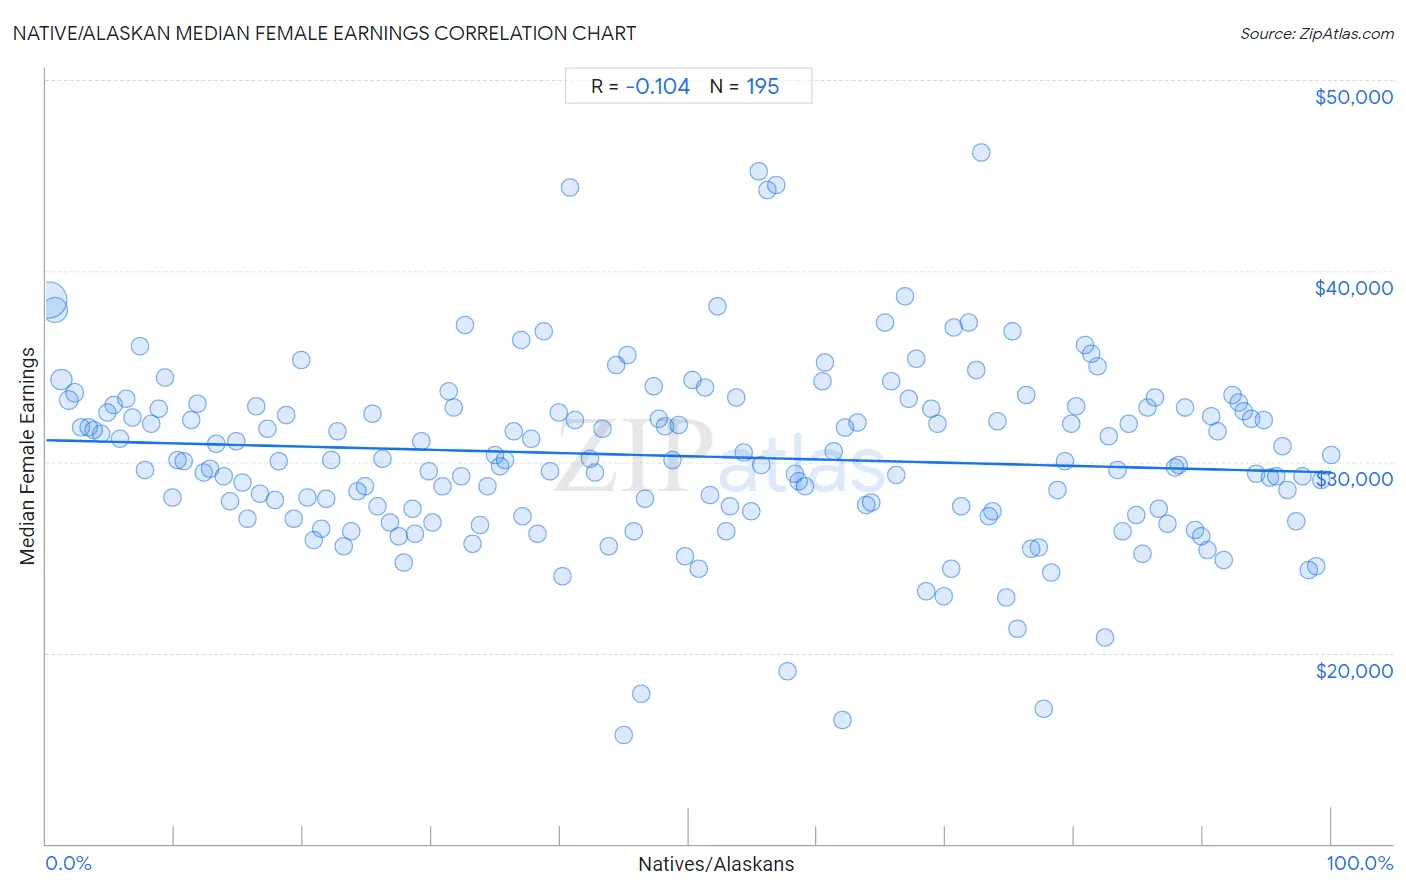
It is essential to understand that the correlation between the percentage of Natives/Alaskans and median female earnings does not imply a direct cause-and-effect relationship. It remains uncertain whether the presence of Natives/Alaskans influences an upward or downward trend in the level of median female earnings within an area, or if Natives/Alaskans simply ended up residing in those areas with higher or lower levels of median female earnings due to other factors.
Demographics Similar to Natives/Alaskans by Median Female Earnings
In terms of median female earnings, the demographic groups most similar to Natives/Alaskans are Choctaw ($33,775, a difference of 0.090%), Menominee ($33,894, a difference of 0.26%), Hopi ($33,932, a difference of 0.37%), Mexican ($33,664, a difference of 0.42%), and Immigrants from Central America ($33,953, a difference of 0.43%).
| Demographics | Rating | Rank | Median Female Earnings |
| Immigrants from Congo | 0.0 /100 | #324 | Tragic $34,317 |
| Dutch West Indians | 0.0 /100 | #325 | Tragic $34,106 |
| Kiowa | 0.0 /100 | #326 | Tragic $34,074 |
| Cajuns | 0.0 /100 | #327 | Tragic $34,034 |
| Immigrants from Central America | 0.0 /100 | #328 | Tragic $33,953 |
| Hopi | 0.0 /100 | #329 | Tragic $33,932 |
| Menominee | 0.0 /100 | #330 | Tragic $33,894 |
| Natives/Alaskans | 0.0 /100 | #331 | Tragic $33,806 |
| Choctaw | 0.0 /100 | #332 | Tragic $33,775 |
| Mexicans | 0.0 /100 | #333 | Tragic $33,664 |
| Spanish American Indians | 0.0 /100 | #334 | Tragic $33,625 |
| Creek | 0.0 /100 | #335 | Tragic $33,437 |
| Ottawa | 0.0 /100 | #336 | Tragic $33,378 |
| Yakama | 0.0 /100 | #337 | Tragic $33,354 |
| Immigrants from Cuba | 0.0 /100 | #338 | Tragic $33,291 |
Native/Alaskan Median Female Earnings Correlation Summary
| Measurement | Native/Alaskan Data | Median Female Earnings Data |
| Minimum | 0.21% | $15,696 |
| Maximum | 100.0% | $46,195 |
| Range | 99.8% | $30,499 |
| Mean | 49.8% | $30,297 |
| Median | 49.2% | $30,121 |
| Interquartile 25% (IQ1) | 24.3% | $27,399 |
| Interquartile 75% (IQ3) | 75.6% | $32,868 |
| Interquartile Range (IQR) | 51.3% | $5,469 |
| Standard Deviation (Sample) | 29.3% | $4,739 |
| Standard Deviation (Population) | 29.2% | $4,727 |
Correlation Details
| Native/Alaskan Percentile | Sample Size | Median Female Earnings |
[ 0.0% - 0.5% ] 0.21% | 288,369,027 | $38,493 |
[ 0.5% - 1.0% ] 0.71% | 118,683,526 | $37,952 |
[ 1.0% - 1.5% ] 1.20% | 51,459,535 | $34,310 |
[ 1.5% - 2.0% ] 1.72% | 18,103,136 | $33,265 |
[ 2.0% - 2.5% ] 2.20% | 11,012,504 | $33,625 |
[ 2.5% - 3.0% ] 2.71% | 4,848,888 | $31,828 |
[ 3.0% - 3.5% ] 3.26% | 4,355,310 | $31,832 |
[ 3.5% - 4.0% ] 3.72% | 2,061,011 | $31,696 |
[ 4.0% - 4.5% ] 4.26% | 2,560,458 | $31,483 |
[ 4.5% - 5.0% ] 4.76% | 1,801,666 | $32,595 |
[ 5.0% - 5.5% ] 5.22% | 678,457 | $32,967 |
[ 5.5% - 6.0% ] 5.73% | 845,830 | $31,214 |
[ 6.0% - 6.5% ] 6.25% | 650,199 | $33,289 |
[ 6.5% - 7.0% ] 6.74% | 374,924 | $32,333 |
[ 7.0% - 7.5% ] 7.32% | 692,266 | $36,044 |
[ 7.5% - 8.0% ] 7.70% | 358,318 | $29,553 |
[ 8.0% - 8.5% ] 8.21% | 382,213 | $31,967 |
[ 8.5% - 9.0% ] 8.72% | 404,803 | $32,787 |
[ 9.0% - 9.5% ] 9.23% | 272,974 | $34,447 |
[ 9.5% - 10.0% ] 9.79% | 243,749 | $28,161 |
[ 10.0% - 10.5% ] 10.25% | 154,298 | $30,093 |
[ 10.5% - 11.0% ] 10.69% | 133,452 | $30,059 |
[ 11.0% - 11.5% ] 11.32% | 182,890 | $32,217 |
[ 11.5% - 12.0% ] 11.78% | 198,358 | $33,042 |
[ 12.0% - 12.5% ] 12.23% | 230,814 | $29,447 |
[ 12.5% - 13.0% ] 12.76% | 134,693 | $29,639 |
[ 13.0% - 13.5% ] 13.26% | 93,750 | $30,971 |
[ 13.5% - 14.0% ] 13.81% | 139,565 | $29,246 |
[ 14.0% - 14.5% ] 14.28% | 70,485 | $27,922 |
[ 14.5% - 15.0% ] 14.77% | 99,817 | $31,095 |
[ 15.0% - 15.5% ] 15.24% | 112,861 | $28,893 |
[ 15.5% - 16.0% ] 15.65% | 65,953 | $27,045 |
[ 16.0% - 16.5% ] 16.33% | 33,249 | $32,943 |
[ 16.5% - 17.0% ] 16.65% | 84,082 | $28,361 |
[ 17.0% - 17.5% ] 17.23% | 87,821 | $31,715 |
[ 17.5% - 18.0% ] 17.85% | 98,470 | $28,027 |
[ 18.0% - 18.5% ] 18.13% | 127,367 | $30,059 |
[ 18.5% - 19.0% ] 18.70% | 38,921 | $32,442 |
[ 19.0% - 19.5% ] 19.30% | 90,287 | $27,043 |
[ 19.5% - 20.0% ] 19.82% | 45,921 | $35,305 |
[ 20.0% - 20.5% ] 20.31% | 41,481 | $28,125 |
[ 20.5% - 21.0% ] 20.85% | 31,950 | $25,901 |
[ 21.0% - 21.5% ] 21.40% | 27,840 | $26,520 |
[ 21.5% - 22.0% ] 21.81% | 39,080 | $28,056 |
[ 22.0% - 22.5% ] 22.19% | 8,798 | $30,121 |
[ 22.5% - 23.0% ] 22.66% | 35,384 | $31,603 |
[ 23.0% - 23.5% ] 23.18% | 16,052 | $25,604 |
[ 23.5% - 24.0% ] 23.73% | 23,173 | $26,338 |
[ 24.0% - 24.5% ] 24.27% | 24,970 | $28,440 |
[ 24.5% - 25.0% ] 24.78% | 19,562 | $28,694 |
[ 25.0% - 25.5% ] 25.39% | 15,709 | $32,532 |
[ 25.5% - 26.0% ] 25.78% | 14,151 | $27,672 |
[ 26.0% - 26.5% ] 26.21% | 13,165 | $30,148 |
[ 26.5% - 27.0% ] 26.71% | 7,979 | $26,854 |
[ 27.0% - 27.5% ] 27.46% | 13,981 | $26,127 |
[ 27.5% - 28.0% ] 27.81% | 17,532 | $24,736 |
[ 28.0% - 28.5% ] 28.47% | 55,636 | $27,570 |
[ 28.5% - 29.0% ] 28.69% | 6,661 | $26,267 |
[ 29.0% - 29.5% ] 29.21% | 8,512 | $31,055 |
[ 29.5% - 30.0% ] 29.80% | 34,649 | $29,517 |
[ 30.0% - 30.5% ] 30.10% | 30,186 | $26,800 |
[ 30.5% - 31.0% ] 30.82% | 10,618 | $28,735 |
[ 31.0% - 31.5% ] 31.35% | 9,767 | $33,700 |
[ 31.5% - 32.0% ] 31.70% | 5,840 | $32,880 |
[ 32.0% - 32.5% ] 32.31% | 21,273 | $29,227 |
[ 32.5% - 33.0% ] 32.60% | 5,702 | $37,184 |
[ 33.0% - 33.5% ] 33.17% | 59,155 | $25,732 |
[ 33.5% - 34.0% ] 33.78% | 8,328 | $26,715 |
[ 34.0% - 34.5% ] 34.32% | 37,094 | $28,728 |
[ 34.5% - 35.0% ] 34.88% | 11,899 | $30,362 |
[ 35.0% - 35.5% ] 35.34% | 5,532 | $29,772 |
[ 35.5% - 36.0% ] 35.71% | 18,461 | $30,124 |
[ 36.0% - 36.5% ] 36.34% | 4,155 | $31,623 |
[ 36.5% - 37.0% ] 36.94% | 1,711 | $36,376 |
[ 37.0% - 37.5% ] 37.08% | 10,514 | $27,163 |
[ 37.5% - 38.0% ] 37.76% | 12,216 | $31,237 |
[ 38.0% - 38.5% ] 38.23% | 11,053 | $26,234 |
[ 38.5% - 39.0% ] 38.71% | 8,080 | $36,839 |
[ 39.0% - 39.5% ] 39.21% | 6,957 | $29,521 |
[ 39.5% - 40.0% ] 39.91% | 4,505 | $32,593 |
[ 40.0% - 40.5% ] 40.19% | 5,168 | $24,016 |
[ 40.5% - 41.0% ] 40.73% | 1,370 | $44,367 |
[ 41.0% - 41.5% ] 41.14% | 4,429 | $32,193 |
[ 42.0% - 42.5% ] 42.35% | 1,327 | $30,143 |
[ 42.5% - 43.0% ] 42.69% | 6,409 | $29,433 |
[ 43.0% - 43.5% ] 43.28% | 2,112 | $31,707 |
[ 43.5% - 44.0% ] 43.76% | 2,854 | $25,609 |
[ 44.0% - 44.5% ] 44.34% | 981 | $35,045 |
[ 44.5% - 45.0% ] 44.90% | 7,114 | $15,696 |
[ 45.0% - 45.5% ] 45.26% | 2,329 | $35,570 |
[ 45.5% - 46.0% ] 45.69% | 348 | $26,346 |
[ 46.0% - 46.5% ] 46.33% | 1,200 | $17,839 |
[ 46.5% - 47.0% ] 46.55% | 14,893 | $28,095 |
[ 47.0% - 47.5% ] 47.29% | 4,060 | $33,975 |
[ 47.5% - 48.0% ] 47.68% | 23,011 | $32,233 |
[ 48.0% - 48.5% ] 48.17% | 6,560 | $31,873 |
[ 48.5% - 49.0% ] 48.69% | 1,877 | $30,122 |
[ 49.0% - 49.5% ] 49.17% | 28,257 | $31,928 |
[ 49.5% - 50.0% ] 49.73% | 5,009 | $25,064 |
[ 50.0% - 50.5% ] 50.32% | 1,393 | $34,294 |
[ 50.5% - 51.0% ] 50.81% | 6,703 | $24,408 |
[ 51.0% - 51.5% ] 51.25% | 2,642 | $33,923 |
[ 51.5% - 52.0% ] 51.68% | 5,371 | $28,253 |
[ 52.0% - 52.5% ] 52.27% | 2,797 | $38,172 |
[ 52.5% - 53.0% ] 52.95% | 644 | $26,375 |
[ 53.0% - 53.5% ] 53.19% | 15,015 | $27,645 |
[ 53.5% - 54.0% ] 53.70% | 16,825 | $33,386 |
[ 54.0% - 54.5% ] 54.25% | 1,329 | $30,469 |
[ 54.5% - 55.0% ] 54.90% | 5,621 | $27,399 |
[ 55.0% - 55.5% ] 55.40% | 10,830 | $45,241 |
[ 55.5% - 56.0% ] 55.69% | 9,050 | $29,852 |
[ 56.0% - 56.5% ] 56.15% | 1,699 | $44,252 |
[ 56.5% - 57.0% ] 56.80% | 2,391 | $44,532 |
[ 57.5% - 58.0% ] 57.73% | 291 | $19,063 |
[ 58.0% - 58.5% ] 58.27% | 5,859 | $29,349 |
[ 58.5% - 59.0% ] 58.57% | 1,103 | $28,958 |
[ 59.0% - 59.5% ] 59.04% | 293 | $28,750 |
[ 60.0% - 60.5% ] 60.37% | 5,846 | $34,198 |
[ 60.5% - 61.0% ] 60.62% | 8,294 | $35,198 |
[ 61.0% - 61.5% ] 61.26% | 14,313 | $30,572 |
[ 61.5% - 62.0% ] 61.94% | 3,263 | $16,479 |
[ 62.0% - 62.5% ] 62.12% | 2,117 | $31,796 |
[ 63.0% - 63.5% ] 63.16% | 2,481 | $32,037 |
[ 63.5% - 64.0% ] 63.80% | 11,359 | $27,739 |
[ 64.0% - 64.5% ] 64.21% | 3,663 | $27,863 |
[ 65.0% - 65.5% ] 65.24% | 13,874 | $37,287 |
[ 65.5% - 66.0% ] 65.75% | 1,746 | $34,230 |
[ 66.0% - 66.5% ] 66.17% | 2,663 | $29,297 |
[ 66.5% - 67.0% ] 66.80% | 1,232 | $38,669 |
[ 67.0% - 67.5% ] 67.11% | 4,214 | $33,314 |
[ 67.5% - 68.0% ] 67.71% | 11,170 | $35,380 |
[ 68.0% - 68.5% ] 68.46% | 241 | $23,221 |
[ 68.5% - 69.0% ] 68.90% | 14,947 | $32,777 |
[ 69.0% - 69.5% ] 69.36% | 5,275 | $31,985 |
[ 69.5% - 70.0% ] 69.87% | 1,580 | $22,994 |
[ 70.0% - 70.5% ] 70.38% | 601 | $24,373 |
[ 70.5% - 71.0% ] 70.65% | 1,530 | $37,026 |
[ 71.0% - 71.5% ] 71.18% | 4,143 | $27,683 |
[ 71.5% - 72.0% ] 71.83% | 2,886 | $37,281 |
[ 72.0% - 72.5% ] 72.39% | 11,661 | $34,793 |
[ 72.5% - 73.0% ] 72.80% | 592 | $46,195 |
[ 73.0% - 73.5% ] 73.30% | 19,295 | $27,178 |
[ 73.5% - 74.0% ] 73.68% | 855 | $27,381 |
[ 74.0% - 74.5% ] 74.06% | 3,632 | $32,148 |
[ 74.5% - 75.0% ] 74.76% | 6,560 | $22,880 |
[ 75.0% - 75.5% ] 75.22% | 3,248 | $36,828 |
[ 75.5% - 76.0% ] 75.59% | 299 | $21,250 |
[ 76.0% - 76.5% ] 76.29% | 5,943 | $33,511 |
[ 76.5% - 77.0% ] 76.67% | 9,084 | $25,452 |
[ 77.0% - 77.5% ] 77.23% | 1,801 | $25,521 |
[ 77.5% - 78.0% ] 77.61% | 1,206 | $17,051 |
[ 78.0% - 78.5% ] 78.19% | 2,811 | $24,182 |
[ 78.5% - 79.0% ] 78.69% | 1,511 | $28,513 |
[ 79.0% - 79.5% ] 79.26% | 11,584 | $30,051 |
[ 79.5% - 80.0% ] 79.73% | 12,272 | $31,968 |
[ 80.0% - 80.5% ] 80.17% | 8,079 | $32,937 |
[ 80.5% - 81.0% ] 80.88% | 4,100 | $36,134 |
[ 81.0% - 81.5% ] 81.33% | 2,683 | $35,650 |
[ 81.5% - 82.0% ] 81.78% | 4,258 | $35,005 |
[ 82.0% - 82.5% ] 82.38% | 1,402 | $20,798 |
[ 82.5% - 83.0% ] 82.69% | 6,048 | $31,356 |
[ 83.0% - 83.5% ] 83.39% | 13,728 | $29,567 |
[ 83.5% - 84.0% ] 83.79% | 6,735 | $26,373 |
[ 84.0% - 84.5% ] 84.28% | 5,031 | $31,984 |
[ 84.5% - 85.0% ] 84.84% | 23,414 | $27,237 |
[ 85.0% - 85.5% ] 85.31% | 7,489 | $25,211 |
[ 85.5% - 86.0% ] 85.68% | 8,952 | $32,868 |
[ 86.0% - 86.5% ] 86.30% | 1,956 | $33,384 |
[ 86.5% - 87.0% ] 86.61% | 7,078 | $27,537 |
[ 87.0% - 87.5% ] 87.29% | 2,109 | $26,774 |
[ 87.5% - 88.0% ] 87.86% | 7,197 | $29,698 |
[ 88.0% - 88.5% ] 88.16% | 7,303 | $29,852 |
[ 88.5% - 89.0% ] 88.67% | 17,815 | $32,864 |
[ 89.0% - 89.5% ] 89.36% | 10,270 | $26,432 |
[ 89.5% - 90.0% ] 89.86% | 2,752 | $26,129 |
[ 90.0% - 90.5% ] 90.32% | 7,956 | $25,363 |
[ 90.5% - 91.0% ] 90.63% | 20,093 | $32,391 |
[ 91.0% - 91.5% ] 91.17% | 16,123 | $31,581 |
[ 91.5% - 92.0% ] 91.67% | 6,208 | $24,847 |
[ 92.0% - 92.5% ] 92.29% | 16,801 | $33,502 |
[ 92.5% - 93.0% ] 92.84% | 39,643 | $33,141 |
[ 93.0% - 93.5% ] 93.15% | 18,989 | $32,664 |
[ 93.5% - 94.0% ] 93.79% | 28,405 | $32,246 |
[ 94.0% - 94.5% ] 94.17% | 16,722 | $29,377 |
[ 94.5% - 95.0% ] 94.75% | 37,172 | $32,192 |
[ 95.0% - 95.5% ] 95.19% | 22,106 | $29,194 |
[ 95.5% - 96.0% ] 95.69% | 32,168 | $29,240 |
[ 96.0% - 96.5% ] 96.24% | 21,222 | $30,821 |
[ 96.5% - 97.0% ] 96.58% | 24,919 | $28,496 |
[ 97.0% - 97.5% ] 97.26% | 11,427 | $26,908 |
[ 97.5% - 98.0% ] 97.74% | 31,029 | $29,262 |
[ 98.0% - 98.5% ] 98.27% | 18,500 | $24,321 |
[ 98.5% - 99.0% ] 98.79% | 15,148 | $24,524 |
[ 99.0% - 99.5% ] 99.25% | 18,287 | $29,083 |
[ 99.5% - 100.0% ] 100.00% | 21,361 | $30,364 |