Native/Alaskan Per Capita Income
COMPARE
Native/Alaskan
Select to Compare
Per Capita Income
Native/Alaskan Per Capita Income
$33,279
PER CAPITA INCOME
0.0/ 100
METRIC RATING
334th/ 347
METRIC RANK
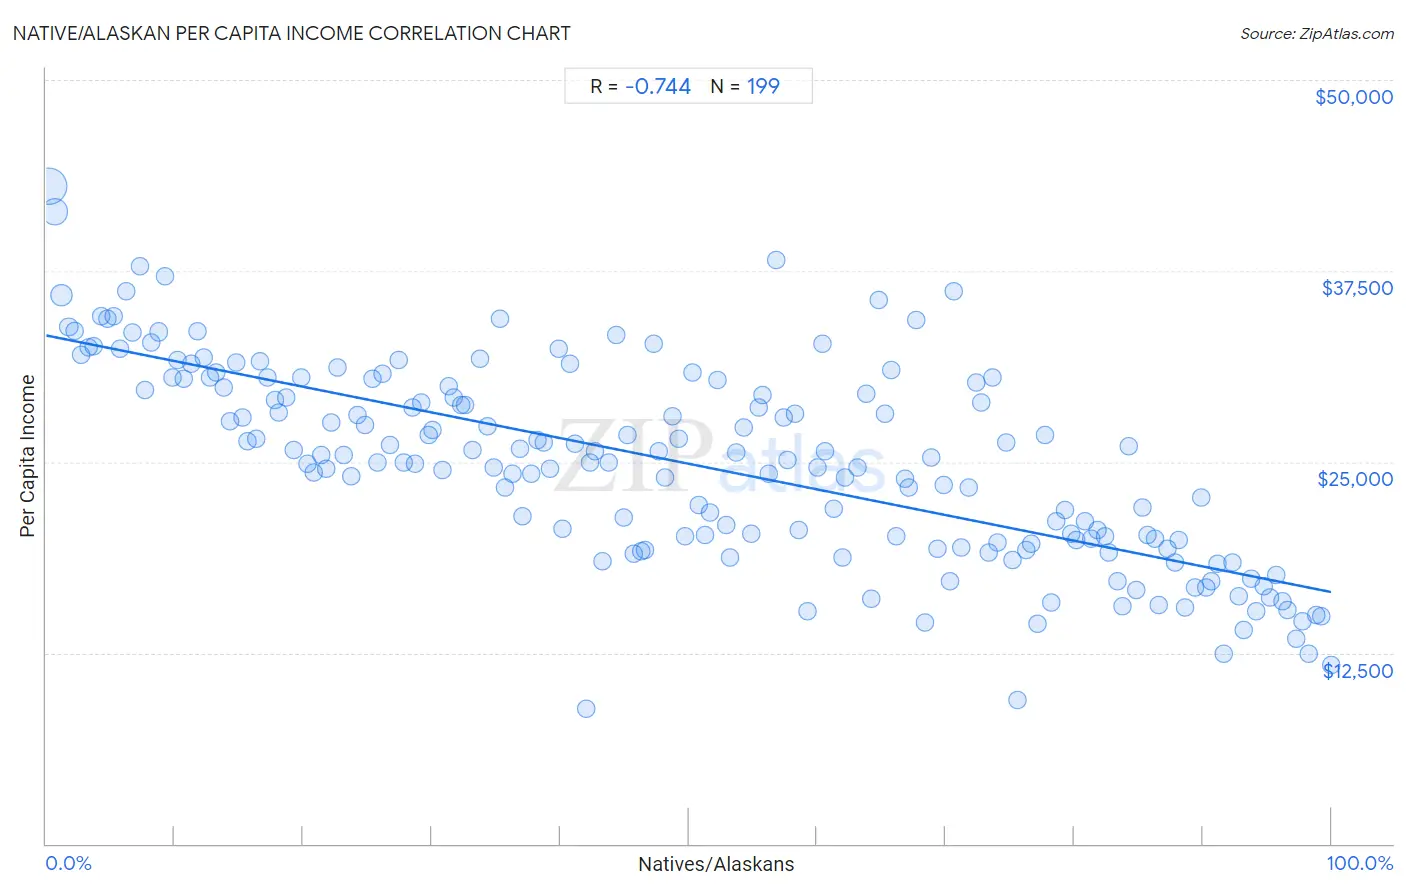
Native/Alaskan Per Capita Income Correlation Chart
The statistical analysis conducted on geographies consisting of 513,079,708 people shows a strong negative correlation between the proportion of Natives/Alaskans and per capita income in the United States with a correlation coefficient (R) of -0.744 and weighted average of $33,279. On average, for every 1% (one percent) increase in Natives/Alaskans within a typical geography, there is a decrease of $168 in per capita income.
It is essential to understand that the correlation between the percentage of Natives/Alaskans and per capita income does not imply a direct cause-and-effect relationship. It remains uncertain whether the presence of Natives/Alaskans influences an upward or downward trend in the level of per capita income within an area, or if Natives/Alaskans simply ended up residing in those areas with higher or lower levels of per capita income due to other factors.
Demographics Similar to Natives/Alaskans by Per Capita Income
In terms of per capita income, the demographic groups most similar to Natives/Alaskans are Yuman ($33,236, a difference of 0.13%), Yakama ($33,009, a difference of 0.82%), Houma ($32,996, a difference of 0.86%), Immigrants from Yemen ($33,696, a difference of 1.3%), and Sioux ($33,921, a difference of 1.9%).
| Demographics | Rating | Rank | Per Capita Income |
| Apache | 0.0 /100 | #327 | Tragic $34,886 |
| Menominee | 0.0 /100 | #328 | Tragic $34,578 |
| Mexicans | 0.0 /100 | #329 | Tragic $34,559 |
| Spanish American Indians | 0.0 /100 | #330 | Tragic $34,195 |
| Immigrants from Mexico | 0.0 /100 | #331 | Tragic $33,931 |
| Sioux | 0.0 /100 | #332 | Tragic $33,921 |
| Immigrants from Yemen | 0.0 /100 | #333 | Tragic $33,696 |
| Natives/Alaskans | 0.0 /100 | #334 | Tragic $33,279 |
| Yuman | 0.0 /100 | #335 | Tragic $33,236 |
| Yakama | 0.0 /100 | #336 | Tragic $33,009 |
| Houma | 0.0 /100 | #337 | Tragic $32,996 |
| Arapaho | 0.0 /100 | #338 | Tragic $32,345 |
| Pueblo | 0.0 /100 | #339 | Tragic $32,012 |
| Crow | 0.0 /100 | #340 | Tragic $31,729 |
| Puerto Ricans | 0.0 /100 | #341 | Tragic $31,268 |
Native/Alaskan Per Capita Income Correlation Summary
| Measurement | Native/Alaskan Data | Per Capita Income Data |
| Minimum | 0.21% | $8,837 |
| Maximum | 100.0% | $43,037 |
| Range | 99.8% | $34,200 |
| Mean | 49.9% | $24,883 |
| Median | 49.7% | $25,158 |
| Interquartile 25% (IQ1) | 24.8% | $19,735 |
| Interquartile 75% (IQ3) | 75.2% | $30,217 |
| Interquartile Range (IQR) | 50.4% | $10,482 |
| Standard Deviation (Sample) | 29.0% | $6,547 |
| Standard Deviation (Population) | 28.9% | $6,531 |
Correlation Details
| Native/Alaskan Percentile | Sample Size | Per Capita Income |
[ 0.0% - 0.5% ] 0.21% | 288,594,925 | $43,037 |
[ 0.5% - 1.0% ] 0.71% | 118,823,021 | $41,377 |
[ 1.0% - 1.5% ] 1.20% | 51,559,363 | $35,884 |
[ 1.5% - 2.0% ] 1.72% | 18,158,906 | $33,837 |
[ 2.0% - 2.5% ] 2.20% | 11,054,972 | $33,585 |
[ 2.5% - 3.0% ] 2.71% | 4,894,884 | $32,023 |
[ 3.0% - 3.5% ] 3.26% | 4,387,245 | $32,500 |
[ 3.5% - 4.0% ] 3.72% | 2,084,401 | $32,590 |
[ 4.0% - 4.5% ] 4.26% | 2,575,378 | $34,527 |
[ 4.5% - 5.0% ] 4.76% | 1,821,057 | $34,389 |
[ 5.0% - 5.5% ] 5.22% | 698,781 | $34,520 |
[ 5.5% - 6.0% ] 5.73% | 864,724 | $32,401 |
[ 6.0% - 6.5% ] 6.25% | 663,627 | $36,172 |
[ 6.5% - 7.0% ] 6.74% | 389,411 | $33,465 |
[ 7.0% - 7.5% ] 7.32% | 701,885 | $37,777 |
[ 7.5% - 8.0% ] 7.70% | 367,939 | $29,684 |
[ 8.0% - 8.5% ] 8.21% | 388,259 | $32,783 |
[ 8.5% - 9.0% ] 8.72% | 408,446 | $33,511 |
[ 9.0% - 9.5% ] 9.23% | 276,540 | $37,123 |
[ 9.5% - 10.0% ] 9.79% | 246,881 | $30,486 |
[ 10.0% - 10.5% ] 10.25% | 155,550 | $31,698 |
[ 10.5% - 11.0% ] 10.70% | 137,891 | $30,402 |
[ 11.0% - 11.5% ] 11.32% | 186,522 | $31,463 |
[ 11.5% - 12.0% ] 11.78% | 200,029 | $33,581 |
[ 12.0% - 12.5% ] 12.23% | 233,489 | $31,866 |
[ 12.5% - 13.0% ] 12.76% | 137,541 | $30,486 |
[ 13.0% - 13.5% ] 13.26% | 95,162 | $30,877 |
[ 13.5% - 14.0% ] 13.81% | 142,759 | $29,847 |
[ 14.0% - 14.5% ] 14.28% | 73,325 | $27,647 |
[ 14.5% - 15.0% ] 14.77% | 100,709 | $31,533 |
[ 15.0% - 15.5% ] 15.24% | 113,650 | $27,894 |
[ 15.5% - 16.0% ] 15.65% | 66,893 | $26,314 |
[ 16.0% - 16.5% ] 16.33% | 33,755 | $26,476 |
[ 16.5% - 17.0% ] 16.65% | 86,372 | $31,607 |
[ 17.0% - 17.5% ] 17.23% | 88,520 | $30,487 |
[ 17.5% - 18.0% ] 17.85% | 101,848 | $29,021 |
[ 18.0% - 18.5% ] 18.13% | 128,285 | $28,248 |
[ 18.5% - 19.0% ] 18.72% | 41,656 | $29,220 |
[ 19.0% - 19.5% ] 19.30% | 90,381 | $25,766 |
[ 19.5% - 20.0% ] 19.81% | 47,490 | $30,541 |
[ 20.0% - 20.5% ] 20.31% | 44,389 | $24,918 |
[ 20.5% - 21.0% ] 20.84% | 32,399 | $24,269 |
[ 21.0% - 21.5% ] 21.40% | 29,173 | $25,416 |
[ 21.5% - 22.0% ] 21.81% | 40,155 | $24,579 |
[ 22.0% - 22.5% ] 22.20% | 9,978 | $27,606 |
[ 22.5% - 23.0% ] 22.66% | 35,997 | $31,156 |
[ 23.0% - 23.5% ] 23.19% | 17,070 | $25,464 |
[ 23.5% - 24.0% ] 23.73% | 24,830 | $24,063 |
[ 24.0% - 24.5% ] 24.26% | 27,156 | $28,082 |
[ 24.5% - 25.0% ] 24.78% | 20,017 | $27,379 |
[ 25.0% - 25.5% ] 25.39% | 15,828 | $30,432 |
[ 25.5% - 26.0% ] 25.77% | 15,790 | $24,981 |
[ 26.0% - 26.5% ] 26.21% | 15,405 | $30,788 |
[ 26.5% - 27.0% ] 26.71% | 8,943 | $26,084 |
[ 27.0% - 27.5% ] 27.45% | 15,542 | $31,700 |
[ 27.5% - 28.0% ] 27.81% | 18,246 | $24,982 |
[ 28.0% - 28.5% ] 28.47% | 56,270 | $28,598 |
[ 28.5% - 29.0% ] 28.70% | 6,982 | $24,882 |
[ 29.0% - 29.5% ] 29.21% | 9,028 | $28,858 |
[ 29.5% - 30.0% ] 29.80% | 34,720 | $26,748 |
[ 30.0% - 30.5% ] 30.10% | 31,472 | $27,073 |
[ 30.5% - 31.0% ] 30.81% | 10,781 | $24,428 |
[ 31.0% - 31.5% ] 31.35% | 9,767 | $29,990 |
[ 31.5% - 32.0% ] 31.69% | 6,179 | $29,185 |
[ 32.0% - 32.5% ] 32.30% | 21,879 | $28,749 |
[ 32.5% - 33.0% ] 32.63% | 6,188 | $28,729 |
[ 33.0% - 33.5% ] 33.17% | 61,155 | $25,739 |
[ 33.5% - 34.0% ] 33.78% | 8,629 | $31,768 |
[ 34.0% - 34.5% ] 34.32% | 37,524 | $27,312 |
[ 34.5% - 35.0% ] 34.87% | 12,300 | $24,643 |
[ 35.0% - 35.5% ] 35.35% | 6,498 | $34,365 |
[ 35.5% - 36.0% ] 35.71% | 18,746 | $23,324 |
[ 36.0% - 36.5% ] 36.33% | 4,338 | $24,220 |
[ 36.5% - 37.0% ] 36.89% | 2,174 | $25,858 |
[ 37.0% - 37.5% ] 37.09% | 10,918 | $21,465 |
[ 37.5% - 38.0% ] 37.76% | 12,349 | $24,239 |
[ 38.0% - 38.5% ] 38.24% | 11,387 | $26,405 |
[ 38.5% - 39.0% ] 38.69% | 10,018 | $26,293 |
[ 39.0% - 39.5% ] 39.21% | 7,680 | $24,531 |
[ 39.5% - 40.0% ] 39.91% | 4,573 | $32,400 |
[ 40.0% - 40.5% ] 40.19% | 5,168 | $20,594 |
[ 40.5% - 41.0% ] 40.72% | 1,444 | $31,413 |
[ 41.0% - 41.5% ] 41.14% | 4,487 | $26,218 |
[ 41.5% - 42.0% ] 41.98% | 81 | $8,837 |
[ 42.0% - 42.5% ] 42.29% | 2,062 | $24,954 |
[ 42.5% - 43.0% ] 42.69% | 6,601 | $25,709 |
[ 43.0% - 43.5% ] 43.28% | 2,218 | $18,511 |
[ 43.5% - 44.0% ] 43.76% | 3,199 | $24,934 |
[ 44.0% - 44.5% ] 44.33% | 1,234 | $33,328 |
[ 44.5% - 45.0% ] 44.90% | 7,642 | $21,361 |
[ 45.0% - 45.5% ] 45.25% | 2,400 | $26,776 |
[ 45.5% - 46.0% ] 45.75% | 577 | $18,999 |
[ 46.0% - 46.5% ] 46.33% | 1,200 | $19,164 |
[ 46.5% - 47.0% ] 46.56% | 15,425 | $19,230 |
[ 47.0% - 47.5% ] 47.28% | 4,482 | $32,735 |
[ 47.5% - 48.0% ] 47.68% | 23,306 | $25,732 |
[ 48.0% - 48.5% ] 48.19% | 7,344 | $24,015 |
[ 48.5% - 49.0% ] 48.71% | 2,014 | $28,008 |
[ 49.0% - 49.5% ] 49.17% | 28,257 | $26,522 |
[ 49.5% - 50.0% ] 49.74% | 5,227 | $20,113 |
[ 50.0% - 50.5% ] 50.32% | 1,393 | $30,870 |
[ 50.5% - 51.0% ] 50.81% | 6,754 | $22,180 |
[ 51.0% - 51.5% ] 51.25% | 2,642 | $20,217 |
[ 51.5% - 52.0% ] 51.70% | 5,598 | $21,725 |
[ 52.0% - 52.5% ] 52.27% | 2,797 | $30,344 |
[ 52.5% - 53.0% ] 52.90% | 794 | $20,861 |
[ 53.0% - 53.5% ] 53.19% | 15,015 | $18,721 |
[ 53.5% - 54.0% ] 53.70% | 17,032 | $25,578 |
[ 54.0% - 54.5% ] 54.25% | 1,329 | $27,225 |
[ 54.5% - 55.0% ] 54.90% | 5,621 | $20,303 |
[ 55.0% - 55.5% ] 55.40% | 10,830 | $28,552 |
[ 55.5% - 56.0% ] 55.72% | 10,236 | $29,389 |
[ 56.0% - 56.5% ] 56.23% | 2,440 | $24,189 |
[ 56.5% - 57.0% ] 56.80% | 2,428 | $38,207 |
[ 57.0% - 57.5% ] 57.39% | 115 | $27,919 |
[ 57.5% - 58.0% ] 57.73% | 291 | $25,158 |
[ 58.0% - 58.5% ] 58.27% | 5,902 | $28,111 |
[ 58.5% - 59.0% ] 58.61% | 1,580 | $20,509 |
[ 59.0% - 59.5% ] 59.21% | 581 | $15,220 |
[ 60.0% - 60.5% ] 60.00% | 270 | $24,666 |
[ 60.0% - 60.5% ] 60.36% | 6,176 | $32,756 |
[ 60.5% - 61.0% ] 60.63% | 8,598 | $25,734 |
[ 61.0% - 61.5% ] 61.26% | 14,494 | $21,899 |
[ 61.5% - 62.0% ] 61.94% | 3,263 | $18,735 |
[ 62.0% - 62.5% ] 62.12% | 2,117 | $23,948 |
[ 63.0% - 63.5% ] 63.16% | 2,481 | $24,617 |
[ 63.5% - 64.0% ] 63.80% | 11,444 | $29,424 |
[ 64.0% - 64.5% ] 64.21% | 3,677 | $16,076 |
[ 64.5% - 65.0% ] 64.77% | 12,557 | $35,621 |
[ 65.0% - 65.5% ] 65.24% | 14,042 | $28,148 |
[ 65.5% - 66.0% ] 65.78% | 2,031 | $30,997 |
[ 66.0% - 66.5% ] 66.17% | 2,663 | $20,126 |
[ 66.5% - 67.0% ] 66.79% | 1,310 | $23,926 |
[ 67.0% - 67.5% ] 67.16% | 5,826 | $23,311 |
[ 67.5% - 68.0% ] 67.71% | 11,170 | $34,282 |
[ 68.0% - 68.5% ] 68.34% | 338 | $14,506 |
[ 68.5% - 69.0% ] 68.91% | 15,875 | $25,320 |
[ 69.0% - 69.5% ] 69.36% | 5,275 | $19,297 |
[ 69.5% - 70.0% ] 69.87% | 1,580 | $23,450 |
[ 70.0% - 70.5% ] 70.34% | 917 | $17,203 |
[ 70.5% - 71.0% ] 70.65% | 1,530 | $36,179 |
[ 71.0% - 71.5% ] 71.18% | 4,143 | $19,420 |
[ 71.5% - 72.0% ] 71.83% | 3,003 | $23,310 |
[ 72.0% - 72.5% ] 72.39% | 11,697 | $30,217 |
[ 72.5% - 73.0% ] 72.80% | 930 | $28,881 |
[ 73.0% - 73.5% ] 73.30% | 19,295 | $19,052 |
[ 73.5% - 74.0% ] 73.68% | 855 | $30,506 |
[ 74.0% - 74.5% ] 74.06% | 3,632 | $19,735 |
[ 74.5% - 75.0% ] 74.75% | 7,418 | $26,301 |
[ 75.0% - 75.5% ] 75.22% | 3,248 | $18,581 |
[ 75.5% - 76.0% ] 75.59% | 299 | $9,386 |
[ 76.0% - 76.5% ] 76.27% | 6,688 | $19,232 |
[ 76.5% - 77.0% ] 76.68% | 9,580 | $19,614 |
[ 77.0% - 77.5% ] 77.18% | 7,441 | $14,382 |
[ 77.5% - 78.0% ] 77.70% | 1,623 | $26,777 |
[ 78.0% - 78.5% ] 78.19% | 2,811 | $15,798 |
[ 78.5% - 79.0% ] 78.63% | 2,209 | $21,129 |
[ 79.0% - 79.5% ] 79.26% | 11,584 | $21,877 |
[ 79.5% - 80.0% ] 79.73% | 12,277 | $20,314 |
[ 80.0% - 80.5% ] 80.17% | 8,079 | $19,883 |
[ 80.5% - 81.0% ] 80.88% | 4,100 | $21,138 |
[ 81.0% - 81.5% ] 81.33% | 2,909 | $19,953 |
[ 81.5% - 82.0% ] 81.77% | 4,482 | $20,549 |
[ 82.0% - 82.5% ] 82.37% | 1,492 | $20,106 |
[ 82.5% - 83.0% ] 82.68% | 7,650 | $19,065 |
[ 83.0% - 83.5% ] 83.39% | 14,134 | $17,192 |
[ 83.5% - 84.0% ] 83.72% | 9,752 | $15,527 |
[ 84.0% - 84.5% ] 84.28% | 5,139 | $26,035 |
[ 84.5% - 85.0% ] 84.84% | 25,017 | $16,590 |
[ 85.0% - 85.5% ] 85.31% | 7,932 | $22,049 |
[ 85.5% - 86.0% ] 85.70% | 9,663 | $20,220 |
[ 86.0% - 86.5% ] 86.28% | 3,031 | $19,966 |
[ 86.5% - 87.0% ] 86.61% | 7,169 | $15,606 |
[ 87.0% - 87.5% ] 87.29% | 2,109 | $19,337 |
[ 87.5% - 88.0% ] 87.86% | 7,403 | $18,403 |
[ 88.0% - 88.5% ] 88.16% | 7,303 | $19,868 |
[ 88.5% - 89.0% ] 88.67% | 18,954 | $15,506 |
[ 89.0% - 89.5% ] 89.36% | 10,289 | $16,769 |
[ 89.5% - 90.0% ] 89.87% | 2,832 | $22,651 |
[ 90.0% - 90.5% ] 90.32% | 14,084 | $16,814 |
[ 90.5% - 91.0% ] 90.64% | 21,532 | $17,217 |
[ 91.0% - 91.5% ] 91.17% | 16,237 | $18,302 |
[ 91.5% - 92.0% ] 91.68% | 9,544 | $12,450 |
[ 92.0% - 92.5% ] 92.29% | 19,295 | $18,438 |
[ 92.5% - 93.0% ] 92.84% | 39,888 | $16,218 |
[ 93.0% - 93.5% ] 93.17% | 21,220 | $14,004 |
[ 93.5% - 94.0% ] 93.79% | 29,655 | $17,388 |
[ 94.0% - 94.5% ] 94.17% | 16,881 | $15,201 |
[ 94.5% - 95.0% ] 94.75% | 37,491 | $16,844 |
[ 95.0% - 95.5% ] 95.19% | 23,870 | $16,111 |
[ 95.5% - 96.0% ] 95.70% | 32,853 | $17,616 |
[ 96.0% - 96.5% ] 96.24% | 21,848 | $15,886 |
[ 96.5% - 97.0% ] 96.58% | 25,928 | $15,338 |
[ 97.0% - 97.5% ] 97.26% | 13,951 | $13,420 |
[ 97.5% - 98.0% ] 97.75% | 32,793 | $14,571 |
[ 98.0% - 98.5% ] 98.27% | 20,876 | $12,446 |
[ 98.5% - 99.0% ] 98.80% | 17,139 | $14,968 |
[ 99.0% - 99.5% ] 99.26% | 21,129 | $14,918 |
[ 99.5% - 100.0% ] 99.99% | 34,997 | $11,739 |