Native/Alaskan Median Family Income
COMPARE
Native/Alaskan
Select to Compare
Median Family Income
Native/Alaskan Median Family Income
$80,908
FAMILY INCOME
0.0/ 100
METRIC RATING
332nd/ 347
METRIC RANK
Native/Alaskan Median Family Income Correlation Chart
The statistical analysis conducted on geographies consisting of 512,223,526 people shows a substantial negative correlation between the proportion of Natives/Alaskans and median family income in the United States with a correlation coefficient (R) of -0.573 and weighted average of $80,908. On average, for every 1% (one percent) increase in Natives/Alaskans within a typical geography, there is a decrease of $306 in median family income.
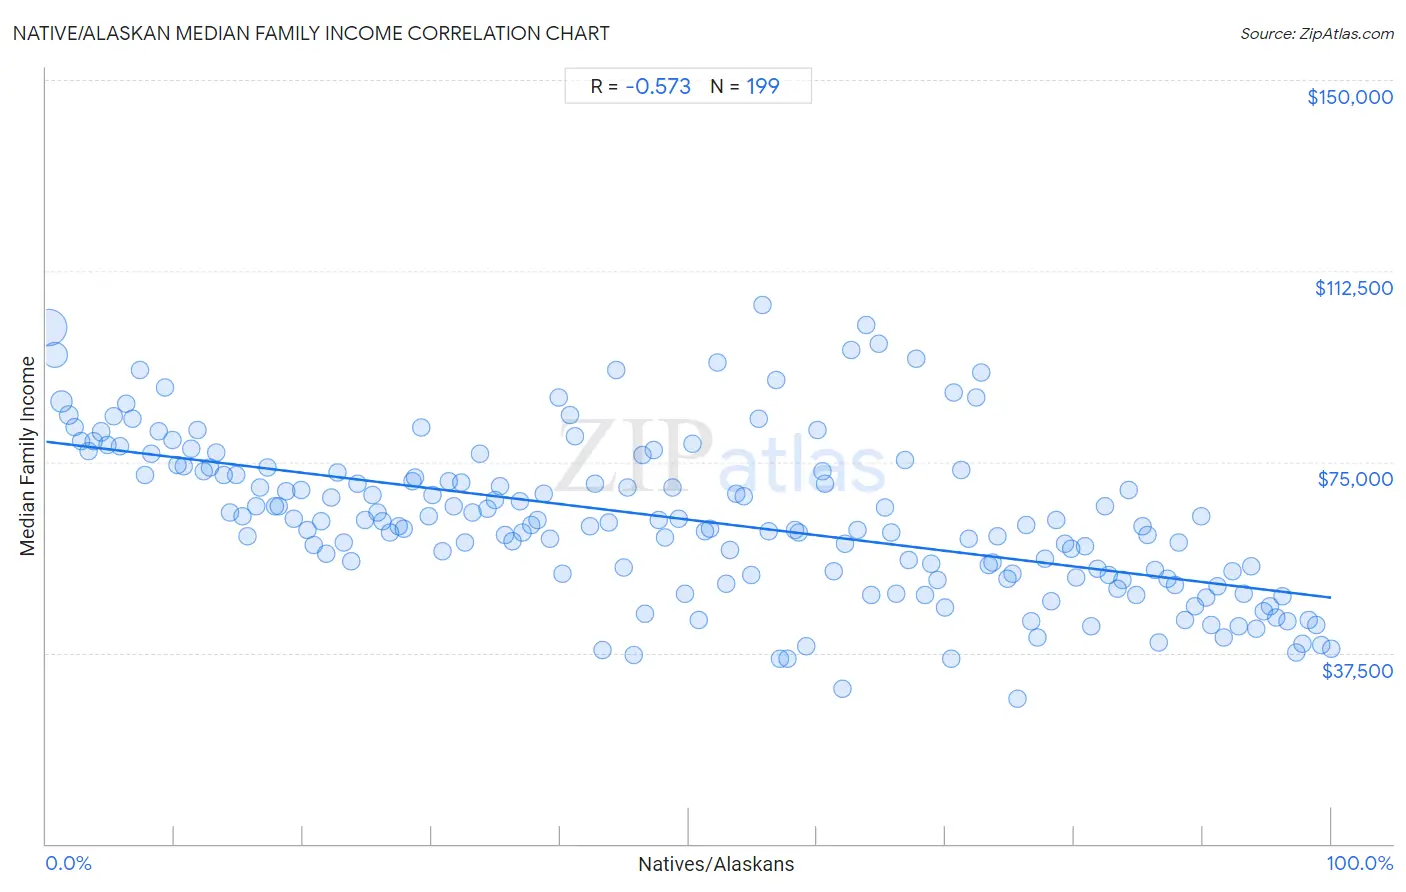
It is essential to understand that the correlation between the percentage of Natives/Alaskans and median family income does not imply a direct cause-and-effect relationship. It remains uncertain whether the presence of Natives/Alaskans influences an upward or downward trend in the level of median family income within an area, or if Natives/Alaskans simply ended up residing in those areas with higher or lower levels of median family income due to other factors.
Demographics Similar to Natives/Alaskans by Median Family Income
In terms of median family income, the demographic groups most similar to Natives/Alaskans are Kiowa ($80,885, a difference of 0.030%), Immigrants from Dominican Republic ($81,233, a difference of 0.40%), Cheyenne ($81,385, a difference of 0.59%), Dutch West Indian ($81,852, a difference of 1.2%), and Black/African American ($81,912, a difference of 1.2%).
| Demographics | Rating | Rank | Median Family Income |
| Sioux | 0.0 /100 | #325 | Tragic $82,386 |
| Immigrants from Congo | 0.0 /100 | #326 | Tragic $82,216 |
| Arapaho | 0.0 /100 | #327 | Tragic $82,064 |
| Blacks/African Americans | 0.0 /100 | #328 | Tragic $81,912 |
| Dutch West Indians | 0.0 /100 | #329 | Tragic $81,852 |
| Cheyenne | 0.0 /100 | #330 | Tragic $81,385 |
| Immigrants from Dominican Republic | 0.0 /100 | #331 | Tragic $81,233 |
| Natives/Alaskans | 0.0 /100 | #332 | Tragic $80,908 |
| Kiowa | 0.0 /100 | #333 | Tragic $80,885 |
| Menominee | 0.0 /100 | #334 | Tragic $79,563 |
| Yup'ik | 0.0 /100 | #335 | Tragic $79,290 |
| Immigrants from Cuba | 0.0 /100 | #336 | Tragic $78,249 |
| Yuman | 0.0 /100 | #337 | Tragic $78,055 |
| Immigrants from Yemen | 0.0 /100 | #338 | Tragic $77,457 |
| Pima | 0.0 /100 | #339 | Tragic $77,431 |
Native/Alaskan Median Family Income Correlation Summary
| Measurement | Native/Alaskan Data | Median Family Income Data |
| Minimum | 0.21% | $28,542 |
| Maximum | 100.0% | $105,692 |
| Range | 99.8% | $77,150 |
| Mean | 50.0% | $63,631 |
| Median | 50.3% | $62,694 |
| Interquartile 25% (IQ1) | 24.8% | $52,723 |
| Interquartile 75% (IQ3) | 75.2% | $73,193 |
| Interquartile Range (IQR) | 50.4% | $20,470 |
| Standard Deviation (Sample) | 29.0% | $15,516 |
| Standard Deviation (Population) | 28.9% | $15,477 |
Correlation Details
| Native/Alaskan Percentile | Sample Size | Median Family Income |
[ 0.0% - 0.5% ] 0.21% | 288,285,325 | $101,338 |
[ 0.5% - 1.0% ] 0.71% | 118,651,185 | $96,010 |
[ 1.0% - 1.5% ] 1.20% | 51,453,957 | $86,919 |
[ 1.5% - 2.0% ] 1.72% | 18,122,042 | $84,173 |
[ 2.0% - 2.5% ] 2.20% | 11,026,728 | $81,828 |
[ 2.5% - 3.0% ] 2.71% | 4,882,222 | $79,124 |
[ 3.0% - 3.5% ] 3.26% | 4,355,920 | $77,200 |
[ 3.5% - 4.0% ] 3.72% | 2,060,152 | $78,970 |
[ 4.0% - 4.5% ] 4.26% | 2,568,465 | $80,918 |
[ 4.5% - 5.0% ] 4.76% | 1,812,610 | $78,239 |
[ 5.0% - 5.5% ] 5.22% | 692,728 | $83,870 |
[ 5.5% - 6.0% ] 5.73% | 860,254 | $78,092 |
[ 6.0% - 6.5% ] 6.25% | 659,457 | $86,386 |
[ 6.5% - 7.0% ] 6.74% | 379,601 | $83,386 |
[ 7.0% - 7.5% ] 7.32% | 695,340 | $93,154 |
[ 7.5% - 8.0% ] 7.70% | 363,422 | $72,352 |
[ 8.0% - 8.5% ] 8.21% | 384,689 | $76,499 |
[ 8.5% - 9.0% ] 8.72% | 405,125 | $80,946 |
[ 9.0% - 9.5% ] 9.23% | 273,649 | $89,635 |
[ 9.5% - 10.0% ] 9.79% | 245,507 | $79,267 |
[ 10.0% - 10.5% ] 10.25% | 154,105 | $74,370 |
[ 10.5% - 11.0% ] 10.69% | 134,110 | $74,028 |
[ 11.0% - 11.5% ] 11.32% | 185,169 | $77,573 |
[ 11.5% - 12.0% ] 11.78% | 199,298 | $81,356 |
[ 12.0% - 12.5% ] 12.23% | 232,078 | $73,081 |
[ 12.5% - 13.0% ] 12.76% | 136,441 | $73,979 |
[ 13.0% - 13.5% ] 13.26% | 94,829 | $76,950 |
[ 13.5% - 14.0% ] 13.81% | 142,385 | $72,383 |
[ 14.0% - 14.5% ] 14.28% | 71,860 | $65,082 |
[ 14.5% - 15.0% ] 14.77% | 100,569 | $72,319 |
[ 15.0% - 15.5% ] 15.24% | 113,447 | $64,289 |
[ 15.5% - 16.0% ] 15.65% | 66,273 | $60,472 |
[ 16.0% - 16.5% ] 16.33% | 33,328 | $66,248 |
[ 16.5% - 17.0% ] 16.65% | 85,633 | $69,990 |
[ 17.0% - 17.5% ] 17.22% | 87,074 | $73,798 |
[ 17.5% - 18.0% ] 17.85% | 100,476 | $66,265 |
[ 18.0% - 18.5% ] 18.13% | 126,983 | $66,312 |
[ 18.5% - 19.0% ] 18.71% | 41,471 | $69,300 |
[ 19.0% - 19.5% ] 19.30% | 90,339 | $63,929 |
[ 19.5% - 20.0% ] 19.82% | 46,197 | $69,437 |
[ 20.0% - 20.5% ] 20.31% | 44,090 | $61,499 |
[ 20.5% - 21.0% ] 20.85% | 31,950 | $58,571 |
[ 21.0% - 21.5% ] 21.40% | 28,865 | $63,248 |
[ 21.5% - 22.0% ] 21.81% | 39,448 | $56,834 |
[ 22.0% - 22.5% ] 22.20% | 9,281 | $67,925 |
[ 22.5% - 23.0% ] 22.66% | 35,895 | $72,943 |
[ 23.0% - 23.5% ] 23.19% | 17,006 | $59,071 |
[ 23.5% - 24.0% ] 23.73% | 24,607 | $55,501 |
[ 24.0% - 24.5% ] 24.26% | 26,853 | $70,602 |
[ 24.5% - 25.0% ] 24.78% | 19,957 | $63,621 |
[ 25.0% - 25.5% ] 25.39% | 15,828 | $68,412 |
[ 25.5% - 26.0% ] 25.77% | 15,252 | $65,085 |
[ 26.0% - 26.5% ] 26.21% | 14,287 | $63,343 |
[ 26.5% - 27.0% ] 26.71% | 8,775 | $61,091 |
[ 27.0% - 27.5% ] 27.45% | 14,988 | $62,306 |
[ 27.5% - 28.0% ] 27.81% | 18,106 | $61,762 |
[ 28.0% - 28.5% ] 28.47% | 55,793 | $71,174 |
[ 28.5% - 29.0% ] 28.70% | 6,982 | $71,918 |
[ 29.0% - 29.5% ] 29.19% | 8,040 | $81,787 |
[ 29.5% - 30.0% ] 29.80% | 34,720 | $64,274 |
[ 30.0% - 30.5% ] 30.10% | 31,472 | $68,460 |
[ 30.5% - 31.0% ] 30.81% | 10,781 | $57,425 |
[ 31.0% - 31.5% ] 31.36% | 9,561 | $71,247 |
[ 31.5% - 32.0% ] 31.69% | 6,179 | $66,178 |
[ 32.0% - 32.5% ] 32.31% | 21,357 | $71,052 |
[ 32.5% - 33.0% ] 32.61% | 5,918 | $59,120 |
[ 33.0% - 33.5% ] 33.17% | 59,456 | $64,947 |
[ 33.5% - 34.0% ] 33.78% | 8,629 | $76,640 |
[ 34.0% - 34.5% ] 34.32% | 37,524 | $65,686 |
[ 34.5% - 35.0% ] 34.88% | 12,005 | $67,616 |
[ 35.0% - 35.5% ] 35.35% | 6,373 | $70,091 |
[ 35.5% - 36.0% ] 35.71% | 18,534 | $60,652 |
[ 36.0% - 36.5% ] 36.33% | 4,305 | $59,401 |
[ 36.5% - 37.0% ] 36.90% | 2,000 | $67,175 |
[ 37.0% - 37.5% ] 37.08% | 10,549 | $61,186 |
[ 37.5% - 38.0% ] 37.76% | 12,349 | $62,645 |
[ 38.0% - 38.5% ] 38.23% | 11,283 | $63,565 |
[ 38.5% - 39.0% ] 38.69% | 10,018 | $68,702 |
[ 39.0% - 39.5% ] 39.21% | 7,680 | $59,973 |
[ 39.5% - 40.0% ] 39.91% | 4,377 | $87,560 |
[ 40.0% - 40.5% ] 40.19% | 5,168 | $52,915 |
[ 40.5% - 41.0% ] 40.72% | 1,444 | $84,138 |
[ 41.0% - 41.5% ] 41.14% | 4,429 | $79,953 |
[ 42.0% - 42.5% ] 42.29% | 1,783 | $62,277 |
[ 42.5% - 43.0% ] 42.69% | 6,409 | $70,651 |
[ 43.0% - 43.5% ] 43.28% | 2,181 | $38,067 |
[ 43.5% - 44.0% ] 43.77% | 3,128 | $62,986 |
[ 44.0% - 44.5% ] 44.32% | 1,180 | $92,929 |
[ 44.5% - 45.0% ] 44.90% | 7,143 | $54,148 |
[ 45.0% - 45.5% ] 45.27% | 1,986 | $69,887 |
[ 45.5% - 46.0% ] 45.69% | 348 | $37,083 |
[ 46.0% - 46.5% ] 46.36% | 770 | $76,250 |
[ 46.5% - 47.0% ] 46.55% | 14,957 | $45,243 |
[ 47.0% - 47.5% ] 47.29% | 4,060 | $77,343 |
[ 47.5% - 48.0% ] 47.68% | 23,306 | $63,607 |
[ 48.0% - 48.5% ] 48.19% | 7,190 | $60,099 |
[ 48.5% - 49.0% ] 48.69% | 1,877 | $70,013 |
[ 49.0% - 49.5% ] 49.17% | 28,147 | $63,770 |
[ 49.5% - 50.0% ] 49.73% | 4,997 | $49,023 |
[ 50.0% - 50.5% ] 50.32% | 1,393 | $78,578 |
[ 50.5% - 51.0% ] 50.81% | 6,140 | $43,834 |
[ 51.0% - 51.5% ] 51.25% | 2,642 | $61,274 |
[ 51.5% - 52.0% ] 51.70% | 5,598 | $61,953 |
[ 52.0% - 52.5% ] 52.27% | 2,797 | $94,441 |
[ 52.5% - 53.0% ] 52.90% | 794 | $51,094 |
[ 53.0% - 53.5% ] 53.19% | 15,015 | $57,733 |
[ 53.5% - 54.0% ] 53.70% | 16,825 | $68,757 |
[ 54.0% - 54.5% ] 54.25% | 1,329 | $68,208 |
[ 54.5% - 55.0% ] 54.90% | 5,621 | $52,851 |
[ 55.0% - 55.5% ] 55.43% | 9,900 | $83,439 |
[ 55.5% - 56.0% ] 55.72% | 10,236 | $105,692 |
[ 56.0% - 56.5% ] 56.22% | 2,362 | $61,340 |
[ 56.5% - 57.0% ] 56.80% | 2,391 | $91,157 |
[ 57.0% - 57.5% ] 57.14% | 28 | $36,250 |
[ 57.5% - 58.0% ] 57.73% | 291 | $36,250 |
[ 58.0% - 58.5% ] 58.27% | 5,902 | $61,713 |
[ 58.5% - 59.0% ] 58.57% | 1,103 | $61,023 |
[ 59.0% - 59.5% ] 59.18% | 490 | $38,899 |
[ 60.0% - 60.5% ] 60.00% | 270 | $81,324 |
[ 60.0% - 60.5% ] 60.37% | 5,846 | $73,193 |
[ 60.5% - 61.0% ] 60.62% | 8,294 | $70,581 |
[ 61.0% - 61.5% ] 61.26% | 14,494 | $53,587 |
[ 61.5% - 62.0% ] 61.94% | 3,263 | $30,508 |
[ 62.0% - 62.5% ] 62.12% | 2,117 | $58,892 |
[ 62.5% - 63.0% ] 62.62% | 4,339 | $96,978 |
[ 63.0% - 63.5% ] 63.15% | 2,171 | $61,535 |
[ 63.5% - 64.0% ] 63.80% | 11,359 | $101,881 |
[ 64.0% - 64.5% ] 64.21% | 3,677 | $48,931 |
[ 64.5% - 65.0% ] 64.77% | 12,190 | $98,190 |
[ 65.0% - 65.5% ] 65.24% | 13,874 | $65,964 |
[ 65.5% - 66.0% ] 65.78% | 2,031 | $61,117 |
[ 66.0% - 66.5% ] 66.13% | 2,380 | $49,018 |
[ 66.5% - 67.0% ] 66.79% | 1,310 | $75,460 |
[ 67.0% - 67.5% ] 67.17% | 5,680 | $55,685 |
[ 67.5% - 68.0% ] 67.71% | 11,170 | $95,349 |
[ 68.0% - 68.5% ] 68.34% | 338 | $48,807 |
[ 68.5% - 69.0% ] 68.90% | 14,947 | $54,999 |
[ 69.0% - 69.5% ] 69.36% | 5,275 | $51,885 |
[ 69.5% - 70.0% ] 69.91% | 1,399 | $46,497 |
[ 70.0% - 70.5% ] 70.38% | 574 | $36,250 |
[ 70.5% - 71.0% ] 70.65% | 1,530 | $88,683 |
[ 71.0% - 71.5% ] 71.18% | 4,143 | $73,496 |
[ 71.5% - 72.0% ] 71.83% | 2,943 | $59,897 |
[ 72.0% - 72.5% ] 72.39% | 11,661 | $87,529 |
[ 72.5% - 73.0% ] 72.80% | 930 | $92,674 |
[ 73.0% - 73.5% ] 73.30% | 19,295 | $54,776 |
[ 73.5% - 74.0% ] 73.64% | 755 | $55,218 |
[ 74.0% - 74.5% ] 74.06% | 3,632 | $60,504 |
[ 74.5% - 75.0% ] 74.76% | 7,061 | $52,082 |
[ 75.0% - 75.5% ] 75.22% | 3,248 | $53,030 |
[ 75.5% - 76.0% ] 75.59% | 299 | $28,542 |
[ 76.0% - 76.5% ] 76.28% | 6,193 | $62,694 |
[ 76.5% - 77.0% ] 76.67% | 9,084 | $43,795 |
[ 77.0% - 77.5% ] 77.18% | 7,441 | $40,435 |
[ 77.5% - 78.0% ] 77.68% | 1,546 | $55,931 |
[ 78.0% - 78.5% ] 78.19% | 2,646 | $47,575 |
[ 78.5% - 79.0% ] 78.63% | 2,209 | $63,486 |
[ 79.0% - 79.5% ] 79.26% | 11,584 | $58,829 |
[ 79.5% - 80.0% ] 79.73% | 12,198 | $58,016 |
[ 80.0% - 80.5% ] 80.17% | 8,079 | $52,333 |
[ 80.5% - 81.0% ] 80.88% | 4,100 | $58,516 |
[ 81.0% - 81.5% ] 81.32% | 2,629 | $42,789 |
[ 81.5% - 82.0% ] 81.78% | 4,352 | $54,127 |
[ 82.0% - 82.5% ] 82.38% | 1,402 | $66,191 |
[ 82.5% - 83.0% ] 82.67% | 7,056 | $52,723 |
[ 83.0% - 83.5% ] 83.39% | 14,134 | $50,082 |
[ 83.5% - 84.0% ] 83.80% | 6,709 | $51,722 |
[ 84.0% - 84.5% ] 84.28% | 4,993 | $69,354 |
[ 84.5% - 85.0% ] 84.84% | 25,017 | $48,936 |
[ 85.0% - 85.5% ] 85.31% | 7,530 | $62,379 |
[ 85.5% - 86.0% ] 85.70% | 9,537 | $60,589 |
[ 86.0% - 86.5% ] 86.27% | 2,228 | $53,856 |
[ 86.5% - 87.0% ] 86.61% | 7,078 | $39,469 |
[ 87.0% - 87.5% ] 87.29% | 2,109 | $51,969 |
[ 87.5% - 88.0% ] 87.86% | 6,968 | $50,886 |
[ 88.0% - 88.5% ] 88.16% | 7,303 | $59,272 |
[ 88.5% - 89.0% ] 88.65% | 15,633 | $43,938 |
[ 89.0% - 89.5% ] 89.36% | 10,016 | $46,692 |
[ 89.5% - 90.0% ] 89.87% | 2,832 | $64,285 |
[ 90.0% - 90.5% ] 90.28% | 10,091 | $48,322 |
[ 90.5% - 91.0% ] 90.64% | 21,434 | $43,038 |
[ 91.0% - 91.5% ] 91.17% | 16,237 | $50,453 |
[ 91.5% - 92.0% ] 91.68% | 9,544 | $40,402 |
[ 92.0% - 92.5% ] 92.28% | 17,757 | $53,523 |
[ 92.5% - 93.0% ] 92.84% | 39,643 | $42,668 |
[ 93.0% - 93.5% ] 93.17% | 21,117 | $49,121 |
[ 93.5% - 94.0% ] 93.79% | 27,579 | $54,535 |
[ 94.0% - 94.5% ] 94.17% | 16,722 | $42,215 |
[ 94.5% - 95.0% ] 94.75% | 36,678 | $45,562 |
[ 95.0% - 95.5% ] 95.19% | 21,903 | $46,614 |
[ 95.5% - 96.0% ] 95.70% | 32,853 | $44,419 |
[ 96.0% - 96.5% ] 96.24% | 21,642 | $48,558 |
[ 96.5% - 97.0% ] 96.59% | 24,631 | $43,612 |
[ 97.0% - 97.5% ] 97.26% | 13,768 | $37,672 |
[ 97.5% - 98.0% ] 97.75% | 32,793 | $39,177 |
[ 98.0% - 98.5% ] 98.27% | 19,295 | $43,966 |
[ 98.5% - 99.0% ] 98.80% | 16,796 | $43,008 |
[ 99.0% - 99.5% ] 99.26% | 21,129 | $38,978 |
[ 99.5% - 100.0% ] 100.00% | 23,937 | $38,199 |