Immigrants from Western Asia vs U.S. Virgin Islander Wage/Income Gap

COMPARE

Immigrants from Western Asia
Race
Ancestry
AfghanAfricanAlaska NativeAlaskan AthabascanAlbanianAleutAlsatianAmericanApacheArabArapahoArgentineanArmenianAssyrian/Chaldean/SyriacAustralianAustrianBahamianBangladeshiBarbadianBasqueBelgianBelizeanBermudanBhutaneseBlackfeetBolivianBrazilianBritishBritish West IndianBulgarianBurmeseCajunCambodianCanadianCape VerdeanCarpatho RusynCelticCentral AmericanCentral American IndianCherokeeCheyenneChickasawChileanChineseChippewaChoctawColombianColvilleComancheCosta RicanCreeCreekCroatianCrowCubanCypriotCzechCzechoslovakianDanishDelawareDominicanDutchDutch West IndianEastern EuropeanEcuadorianEgyptianEnglishEstonianEthiopianEuropeanFijianFilipinoFinnishFrenchFrench American IndianFrench CanadianGermanGerman RussianGhanaianGreekGuamanian/ChamorroGuatemalanGuyaneseHaitianHmongHonduranHopiHoumaHungarianIcelanderIndian (Asian)IndonesianInupiatIranianIraqiIrishIroquoisIsraeliItalianJamaicanJapaneseJordanianKenyanKiowaKoreanLaotianLatvianLebaneseLiberianLithuanianLumbeeLuxembourgerMacedonianMalaysianMalteseMarshalleseMenomineeMexicanMexican American IndianMongolianMoroccanNative HawaiianNavajoNepaleseNew ZealanderNicaraguanNigerianNorthern EuropeanNorwegianOkinawanOsageOttawaPaiutePakistaniPalestinianPanamanianParaguayanPennsylvania GermanPeruvianPimaPolishPortuguesePotawatomiPuebloPuerto RicanPuget Sound SalishRomanianRussianSalvadoranSamoanScandinavianScotch-IrishScottishSeminoleSenegaleseSerbianShoshoneSierra LeoneanSiouxSlavicSlovakSloveneSomaliSouth AfricanSouth AmericanSouth American IndianSoviet UnionSpaniardSpanishSpanish AmericanSpanish American IndianSri LankanSubsaharan AfricanSudaneseSwedishSwissSyrianTaiwaneseThaiTlingit-HaidaTohono O'OdhamTonganTrinidadian and TobagonianTsimshianTurkishUgandanUkrainianUruguayanUteVenezuelanVietnameseWelshWest IndianYakamaYaquiYugoslavianYumanYup'ikZimbabwean
Immigration
NonimmigrantsImmigrantsAfghanistanAfricaAlbaniaArgentinaArmeniaAsiaAustraliaAustriaBahamasBangladeshBarbadosBelarusBelgiumBelizeBoliviaBosnia and HerzegovinaBrazilBulgariaBurma/MyanmarCabo VerdeCambodiaCameroonCanadaCaribbeanCentral AmericaChileChinaColombiaCongoCosta RicaCroatiaCubaCzechoslovakiaDenmarkDominicaDominican RepublicEastern AfricaEastern AsiaEastern EuropeEcuadorEgyptEl SalvadorEnglandEritreaEthiopiaEuropeFijiFranceGermanyGhanaGreeceGrenadaGuatemalaGuyanaHaitiHondurasHong KongHungaryIndiaIndonesiaIranIraqIrelandIsraelItalyJamaicaJapanJordanKazakhstanKenyaKoreaKuwaitLaosLatin AmericaLatviaLebanonLiberiaLithuaniaMalaysiaMexicoMicronesiaMiddle AfricaMoldovaMoroccoNepalNetherlandsNicaraguaNigeriaNorth AmericaNorth MacedoniaNorthern AfricaNorthern EuropeNorwayOceaniaPakistanPanamaPeruPhilippinesPolandPortugalRomaniaRussiaSaudi ArabiaScotlandSenegalSerbiaSierra LeoneSingaporeSomaliaSouth AfricaSouth AmericaSouth Central AsiaSouth Eastern AsiaSouthern EuropeSpainSri LankaSt. Vincent and the GrenadinesSudanSwedenSwitzerlandSyriaTaiwanThailandTrinidad and TobagoTurkeyUgandaUkraineUruguayUzbekistanVenezuelaVietnamWest IndiesWestern AfricaWestern AsiaWestern EuropeYemenZaireZimbabweAzores
U.S. Virgin Islander
Race
Ancestry
AfghanAfricanAlaska NativeAlaskan AthabascanAlbanianAleutAlsatianAmericanApacheArabArapahoArgentineanArmenianAssyrian/Chaldean/SyriacAustralianAustrianBahamianBangladeshiBarbadianBasqueBelgianBelizeanBermudanBhutaneseBlackfeetBolivianBrazilianBritishBritish West IndianBulgarianBurmeseCajunCambodianCanadianCape VerdeanCarpatho RusynCelticCentral AmericanCentral American IndianCherokeeCheyenneChickasawChileanChineseChippewaChoctawColombianColvilleComancheCosta RicanCreeCreekCroatianCrowCubanCypriotCzechCzechoslovakianDanishDelawareDominicanDutchDutch West IndianEastern EuropeanEcuadorianEgyptianEnglishEstonianEthiopianEuropeanFijianFilipinoFinnishFrenchFrench American IndianFrench CanadianGermanGerman RussianGhanaianGreekGuamanian/ChamorroGuatemalanGuyaneseHaitianHmongHonduranHopiHoumaHungarianIcelanderIndian (Asian)IndonesianInupiatIranianIraqiIrishIroquoisIsraeliItalianJamaicanJapaneseJordanianKenyanKiowaKoreanLaotianLatvianLebaneseLiberianLithuanianLumbeeLuxembourgerMacedonianMalaysianMalteseMarshalleseMenomineeMexicanMexican American IndianMongolianMoroccanNative HawaiianNavajoNepaleseNew ZealanderNicaraguanNigerianNorthern EuropeanNorwegianOkinawanOsageOttawaPaiutePakistaniPalestinianPanamanianParaguayanPennsylvania GermanPeruvianPimaPolishPortuguesePotawatomiPuebloPuerto RicanPuget Sound SalishRomanianRussianSalvadoranSamoanScandinavianScotch-IrishScottishSeminoleSenegaleseSerbianShoshoneSierra LeoneanSiouxSlavicSlovakSloveneSomaliSouth AfricanSouth AmericanSouth American IndianSoviet UnionSpaniardSpanishSpanish AmericanSpanish American IndianSri LankanSubsaharan AfricanSudaneseSwedishSwissSyrianTaiwaneseThaiTlingit-HaidaTohono O'OdhamTonganTrinidadian and TobagonianTsimshianTurkishU.S. Virgin IslanderUgandanUkrainianUruguayanUteVenezuelanVietnameseWelshWest IndianYakamaYaquiYugoslavianYumanYup'ikZimbabwean
Immigration
NonimmigrantsImmigrantsAfghanistanAfricaAlbaniaArgentinaArmeniaAsiaAustraliaAustriaBahamasBangladeshBarbadosBelarusBelgiumBelizeBoliviaBosnia and HerzegovinaBrazilBulgariaBurma/MyanmarCabo VerdeCambodiaCameroonCanadaCaribbeanCentral AmericaChileChinaColombiaCongoCosta RicaCroatiaCubaCzechoslovakiaDenmarkDominicaDominican RepublicEastern AfricaEastern AsiaEastern EuropeEcuadorEgyptEl SalvadorEnglandEritreaEthiopiaEuropeFijiFranceGermanyGhanaGreeceGrenadaGuatemalaGuyanaHaitiHondurasHong KongHungaryIndiaIndonesiaIranIraqIrelandIsraelItalyJamaicaJapanJordanKazakhstanKenyaKoreaKuwaitLaosLatin AmericaLatviaLebanonLiberiaLithuaniaMalaysiaMexicoMicronesiaMiddle AfricaMoldovaMoroccoNepalNetherlandsNicaraguaNigeriaNorth AmericaNorth MacedoniaNorthern AfricaNorthern EuropeNorwayOceaniaPakistanPanamaPeruPhilippinesPolandPortugalRomaniaRussiaSaudi ArabiaScotlandSenegalSerbiaSierra LeoneSingaporeSomaliaSouth AfricaSouth AmericaSouth Central AsiaSouth Eastern AsiaSouthern EuropeSpainSri LankaSt. Vincent and the GrenadinesSudanSwedenSwitzerlandSyriaTaiwanThailandTrinidad and TobagoTurkeyUgandaUkraineUruguayUzbekistanVenezuelaVietnamWest IndiesWestern AfricaWestern EuropeYemenZaireZimbabweAzores
Wage/Income Gap
Income
Poverty
Unemployment
Labor Participation
Family Structure
Vehicle Availability
Education Level
Disability

Wage/Income Gap Comparison

Immigrants from Western Asia

U.S. Virgin Islanders

Fair
Exceptional
26.3%
WAGE/INCOME GAP
21.7/ 100
METRIC RATING
196th/ 347
METRIC RANK
21.5%
WAGE/INCOME GAP
100.0/ 100
METRIC RATING
45th/ 347
METRIC RANK

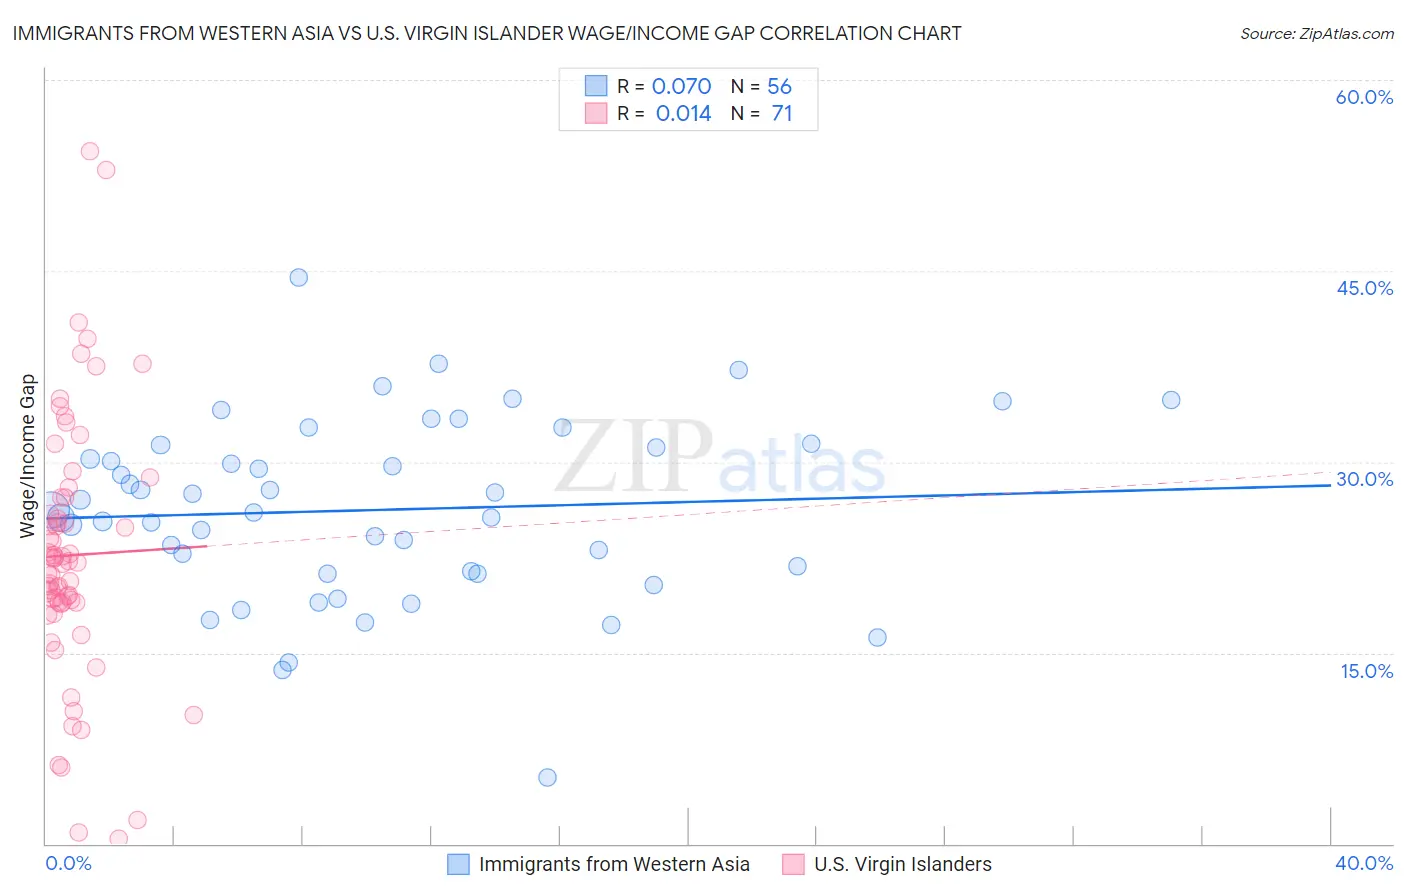
Immigrants from Western Asia vs U.S. Virgin Islander Wage/Income Gap Correlation Chart

The statistical analysis conducted on geographies consisting of 404,196,693 people shows a slight positive correlation between the proportion of Immigrants from Western Asia and wage/income gap percentage in the United States with a correlation coefficient (R) of 0.070 and weighted average of 26.3%. Similarly, the statistical analysis conducted on geographies consisting of 87,518,353 people shows no correlation between the proportion of U.S. Virgin Islanders and wage/income gap percentage in the United States with a correlation coefficient (R) of 0.014 and weighted average of 21.5%, a difference of 22.1%.
Immigrants from Western Asia vs U.S. Virgin Islander Wage/Income Gap

Wage/Income Gap Correlation Summary

MeasurementImmigrants from Western AsiaU.S. Virgin Islander
Minimum5.2%0.43%
Maximum44.5%54.4%
Range39.3%54.0%
Mean26.2%22.7%
Median26.2%22.1%
Interquartile 25% (IQ1)21.3%18.9%
Interquartile 75% (IQ3)31.2%27.2%
Interquartile Range (IQR)9.9%8.2%
Standard Deviation (Sample)7.1%10.2%
Standard Deviation (Population)7.1%10.1%

Similar Demographics by Wage/Income Gap

Demographics Similar to Immigrants from Western Asia by Wage/Income Gap

In terms of wage/income gap, the demographic groups most similar to Immigrants from Western Asia are Zimbabwean (26.3%, a difference of 0.010%), Venezuelan (26.3%, a difference of 0.020%), Immigrants from Malaysia (26.3%, a difference of 0.050%), Immigrants from Jordan (26.3%, a difference of 0.060%), and Chilean (26.3%, a difference of 0.060%).
DemographicsRating | RankWage/Income Gap
Immigrants | Moldova
26.6
/100
|
#189
Fair
26.2%
Immigrants | Croatia
24.8
/100
|
#190
Fair
26.2%
Immigrants | Venezuela
24.7
/100
|
#191
Fair
26.2%
Immigrants | Bulgaria
22.5
/100
|
#192
Fair
26.3%
Immigrants | Jordan
22.4
/100
|
#193
Fair
26.3%
Chileans
22.3
/100
|
#194
Fair
26.3%
Immigrants | Malaysia
22.2
/100
|
#195
Fair
26.3%
Immigrants | Western Asia
21.7
/100
|
#196
Fair
26.3%
Zimbabweans
21.6
/100
|
#197
Fair
26.3%
Venezuelans
21.5
/100
|
#198
Fair
26.3%
Dutch West Indians
21.0
/100
|
#199
Fair
26.3%
Delaware
20.9
/100
|
#200
Fair
26.3%
Immigrants | Syria
19.3
/100
|
#201
Poor
26.4%
Laotians
19.2
/100
|
#202
Poor
26.4%
Immigrants | Eastern Europe
19.2
/100
|
#203
Poor
26.4%

Demographics Similar to U.S. Virgin Islanders by Wage/Income Gap

In terms of wage/income gap, the demographic groups most similar to U.S. Virgin Islanders are Immigrants from Ethiopia (21.6%, a difference of 0.12%), Immigrants from Eritrea (21.4%, a difference of 0.44%), Sierra Leonean (21.4%, a difference of 0.46%), Liberian (21.4%, a difference of 0.52%), and Immigrants from Sierra Leone (21.4%, a difference of 0.52%).
DemographicsRating | RankWage/Income Gap
Immigrants | Belize
100.0
/100
|
#38
Exceptional
21.3%
Colville
100.0
/100
|
#39
Exceptional
21.3%
Lumbee
100.0
/100
|
#40
Exceptional
21.3%
Liberians
100.0
/100
|
#41
Exceptional
21.4%
Immigrants | Sierra Leone
100.0
/100
|
#42
Exceptional
21.4%
Sierra Leoneans
100.0
/100
|
#43
Exceptional
21.4%
Immigrants | Eritrea
100.0
/100
|
#44
Exceptional
21.4%
U.S. Virgin Islanders
100.0
/100
|
#45
Exceptional
21.5%
Immigrants | Ethiopia
100.0
/100
|
#46
Exceptional
21.6%
Immigrants | Congo
100.0
/100
|
#47
Exceptional
21.7%
Blacks/African Americans
100.0
/100
|
#48
Exceptional
21.7%
Ethiopians
100.0
/100
|
#49
Exceptional
21.8%
Immigrants | Western Africa
100.0
/100
|
#50
Exceptional
22.0%
Tohono O'odham
100.0
/100
|
#51
Exceptional
22.1%
Immigrants | Cameroon
100.0
/100
|
#52
Exceptional
22.2%