Immigrants from Asia vs Samoan Wage/Income Gap
COMPARE
Immigrants from Asia
Samoan
Wage/Income Gap
Wage/Income Gap Comparison
Immigrants from Asia
Samoans
27.0%
WAGE/INCOME GAP
5.5/ 100
METRIC RATING
229th/ 347
METRIC RANK
26.0%
WAGE/INCOME GAP
38.6/ 100
METRIC RATING
179th/ 347
METRIC RANK
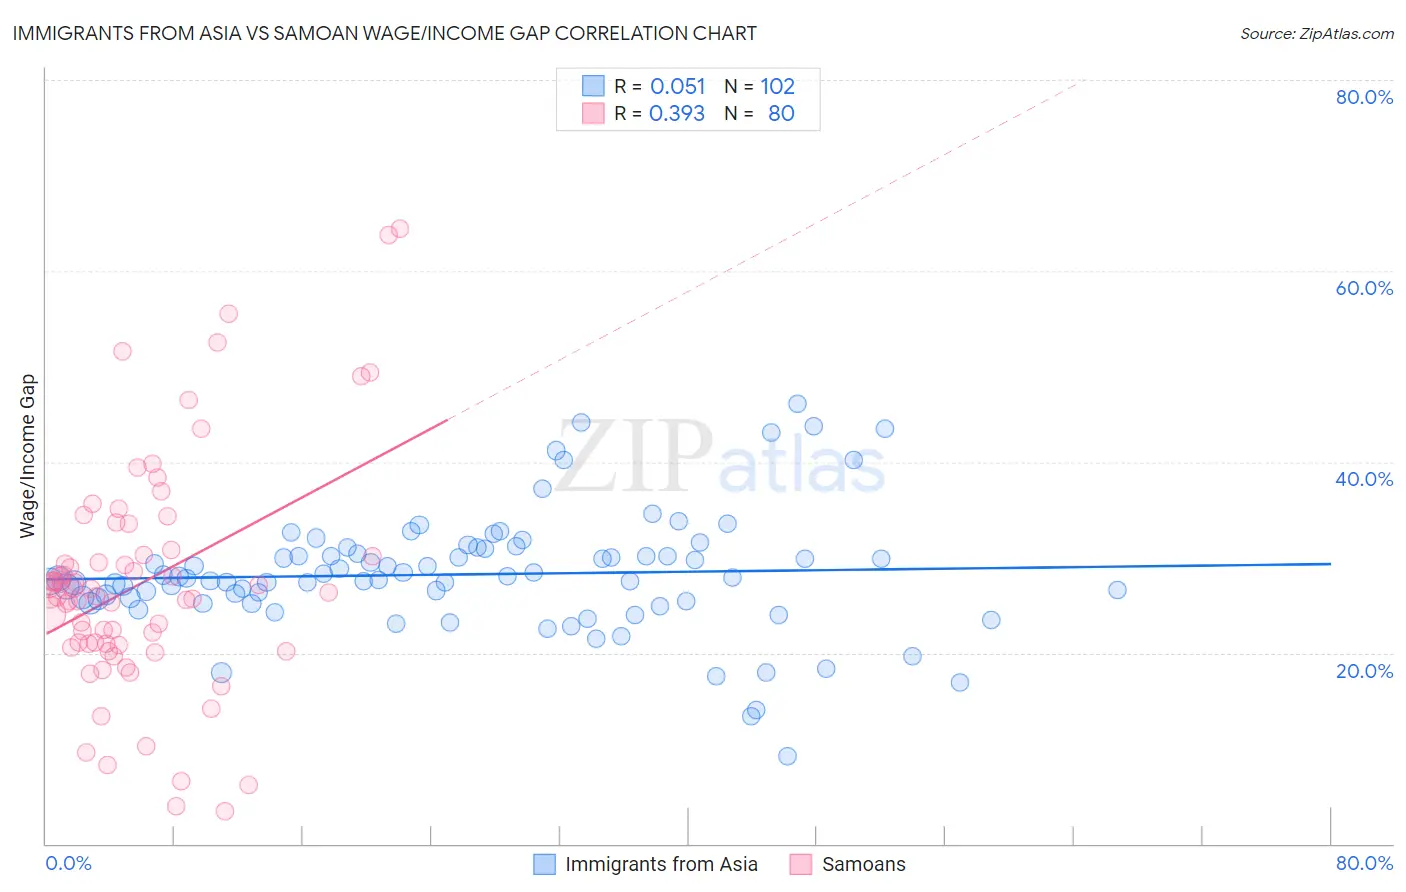
Immigrants from Asia vs Samoan Wage/Income Gap Correlation Chart
The statistical analysis conducted on geographies consisting of 547,716,290 people shows a slight positive correlation between the proportion of Immigrants from Asia and wage/income gap percentage in the United States with a correlation coefficient (R) of 0.051 and weighted average of 27.0%. Similarly, the statistical analysis conducted on geographies consisting of 225,082,264 people shows a mild positive correlation between the proportion of Samoans and wage/income gap percentage in the United States with a correlation coefficient (R) of 0.393 and weighted average of 26.0%, a difference of 3.8%.
Wage/Income Gap Correlation Summary
| Measurement | Immigrants from Asia | Samoan |
| Minimum | 9.2% | 3.4% |
| Maximum | 46.1% | 64.4% |
| Range | 36.9% | 61.0% |
| Mean | 28.2% | 27.4% |
| Median | 27.8% | 26.1% |
| Interquartile 25% (IQ1) | 25.4% | 20.9% |
| Interquartile 75% (IQ3) | 30.4% | 30.5% |
| Interquartile Range (IQR) | 4.9% | 9.6% |
| Standard Deviation (Sample) | 6.3% | 12.1% |
| Standard Deviation (Population) | 6.2% | 12.1% |
Similar Demographics by Wage/Income Gap
Demographics Similar to Immigrants from Asia by Wage/Income Gap
In terms of wage/income gap, the demographic groups most similar to Immigrants from Asia are Immigrants from Turkey (27.0%, a difference of 0.030%), Spaniard (27.0%, a difference of 0.040%), Ottawa (27.0%, a difference of 0.050%), Bhutanese (27.0%, a difference of 0.070%), and Argentinean (27.0%, a difference of 0.10%).
| Demographics | Rating | Rank | Wage/Income Gap |
| Bolivians | 8.3 /100 | #222 | Tragic 26.8% |
| Jordanians | 8.0 /100 | #223 | Tragic 26.8% |
| Immigrants | Argentina | 7.2 /100 | #224 | Tragic 26.8% |
| Immigrants | Ireland | 6.5 /100 | #225 | Tragic 26.9% |
| Asians | 5.9 /100 | #226 | Tragic 26.9% |
| Spaniards | 5.6 /100 | #227 | Tragic 27.0% |
| Immigrants | Turkey | 5.6 /100 | #228 | Tragic 27.0% |
| Immigrants | Asia | 5.5 /100 | #229 | Tragic 27.0% |
| Ottawa | 5.3 /100 | #230 | Tragic 27.0% |
| Bhutanese | 5.3 /100 | #231 | Tragic 27.0% |
| Argentineans | 5.2 /100 | #232 | Tragic 27.0% |
| Immigrants | Brazil | 5.0 /100 | #233 | Tragic 27.0% |
| Immigrants | Pakistan | 4.9 /100 | #234 | Tragic 27.0% |
| Immigrants | Hungary | 4.8 /100 | #235 | Tragic 27.0% |
| Immigrants | Romania | 4.8 /100 | #236 | Tragic 27.0% |
Demographics Similar to Samoans by Wage/Income Gap
In terms of wage/income gap, the demographic groups most similar to Samoans are Guamanian/Chamorro (26.0%, a difference of 0.040%), Immigrants from Bolivia (26.0%, a difference of 0.15%), Chinese (25.9%, a difference of 0.23%), Immigrants from Serbia (26.0%, a difference of 0.23%), and Immigrants from Kazakhstan (26.0%, a difference of 0.24%).
| Demographics | Rating | Rank | Wage/Income Gap |
| Immigrants | Chile | 53.2 /100 | #172 | Average 25.7% |
| Immigrants | Belarus | 52.9 /100 | #173 | Average 25.7% |
| Alaskan Athabascans | 50.0 /100 | #174 | Average 25.8% |
| Sri Lankans | 47.0 /100 | #175 | Average 25.8% |
| Paraguayans | 46.7 /100 | #176 | Average 25.8% |
| Cambodians | 45.1 /100 | #177 | Average 25.8% |
| Chinese | 42.0 /100 | #178 | Average 25.9% |
| Samoans | 38.6 /100 | #179 | Fair 26.0% |
| Guamanians/Chamorros | 38.0 /100 | #180 | Fair 26.0% |
| Immigrants | Bolivia | 36.4 /100 | #181 | Fair 26.0% |
| Immigrants | Serbia | 35.4 /100 | #182 | Fair 26.0% |
| Immigrants | Kazakhstan | 35.2 /100 | #183 | Fair 26.0% |
| Mexicans | 34.4 /100 | #184 | Fair 26.0% |
| Pakistanis | 33.7 /100 | #185 | Fair 26.1% |
| Immigrants | Indonesia | 32.5 /100 | #186 | Fair 26.1% |