Immigrants from Kazakhstan 3 or more Vehicles in Household
COMPARE
Immigrants from Kazakhstan
Select to Compare
3 or more Vehicles in Household
Immigrants from Kazakhstan 3 or more Vehicles in Household
17.4%
3+ VEHICLES AVAILABLE
0.3/ 100
METRIC RATING
279th/ 347
METRIC RANK
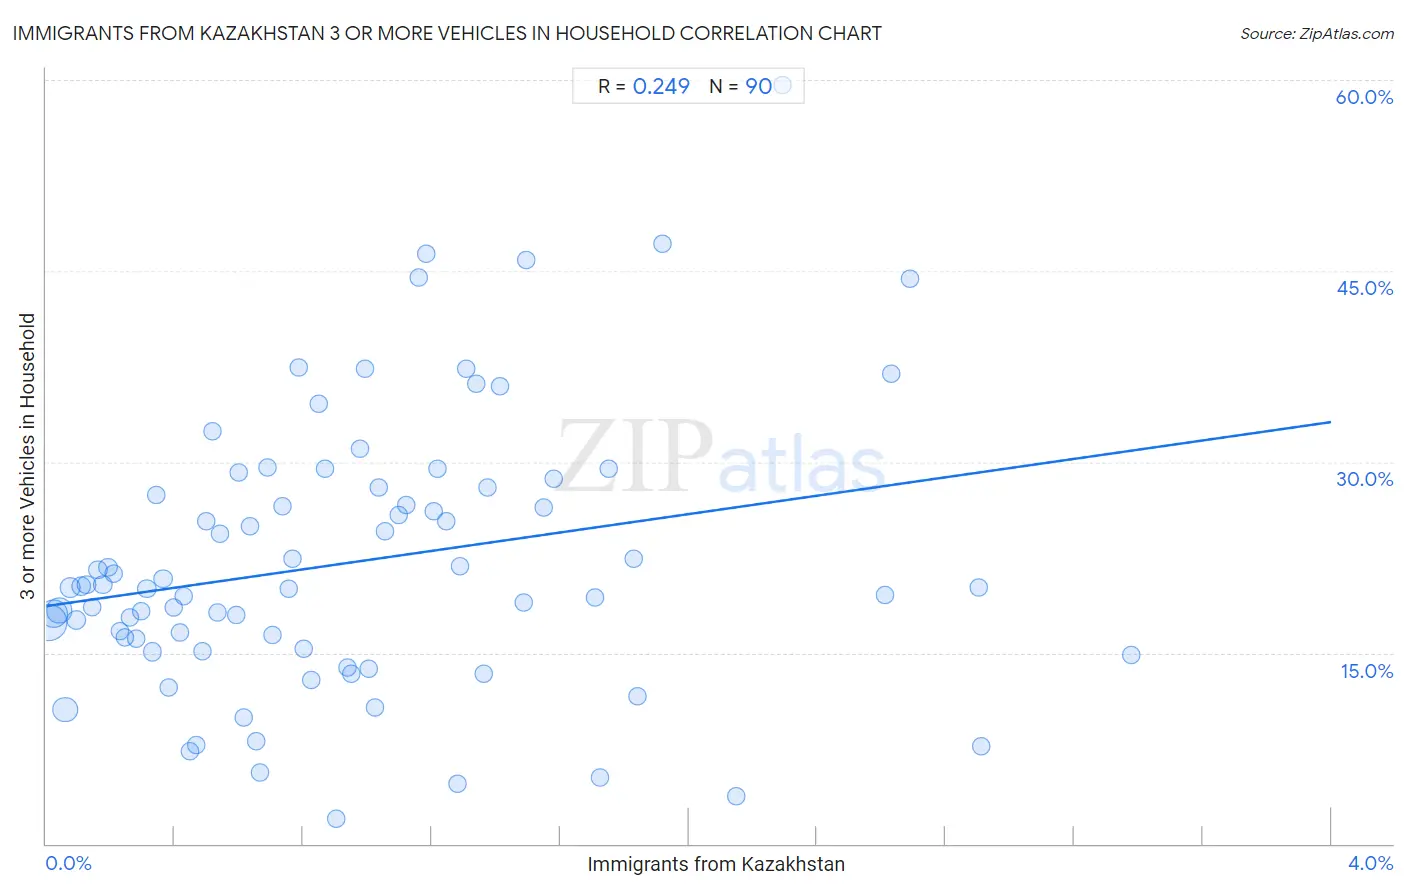
Immigrants from Kazakhstan 3 or more Vehicles in Household Correlation Chart
The statistical analysis conducted on geographies consisting of 124,422,099 people shows a weak positive correlation between the proportion of Immigrants from Kazakhstan and percentage of households with 3 or more vehicles available in the United States with a correlation coefficient (R) of 0.249 and weighted average of 17.4%. On average, for every 1% (one percent) increase in Immigrants from Kazakhstan within a typical geography, there is an increase of 3.6% in percentage of households with 3 or more vehicles available.
It is essential to understand that the correlation between the percentage of Immigrants from Kazakhstan and percentage of households with 3 or more vehicles available does not imply a direct cause-and-effect relationship. It remains uncertain whether the presence of Immigrants from Kazakhstan influences an upward or downward trend in the level of percentage of households with 3 or more vehicles available within an area, or if Immigrants from Kazakhstan simply ended up residing in those areas with higher or lower levels of percentage of households with 3 or more vehicles available due to other factors.
Demographics Similar to Immigrants from Kazakhstan by 3 or more Vehicles in Household
In terms of 3 or more vehicles in household, the demographic groups most similar to Immigrants from Kazakhstan are Immigrants from Bahamas (17.4%, a difference of 0.010%), Immigrants from Eastern Europe (17.4%, a difference of 0.040%), Immigrants from Latvia (17.4%, a difference of 0.080%), Brazilian (17.4%, a difference of 0.10%), and Okinawan (17.4%, a difference of 0.25%).
| Demographics | Rating | Rank | 3 or more Vehicles in Household |
| Immigrants from Africa | 0.5 /100 | #272 | Tragic 17.6% |
| Immigrants from Sudan | 0.5 /100 | #273 | Tragic 17.6% |
| Immigrants from Bosnia and Herzegovina | 0.5 /100 | #274 | Tragic 17.5% |
| Immigrants from Ukraine | 0.4 /100 | #275 | Tragic 17.5% |
| Okinawans | 0.4 /100 | #276 | Tragic 17.4% |
| Brazilians | 0.4 /100 | #277 | Tragic 17.4% |
| Immigrants from Bahamas | 0.3 /100 | #278 | Tragic 17.4% |
| Immigrants from Kazakhstan | 0.3 /100 | #279 | Tragic 17.4% |
| Immigrants from Eastern Europe | 0.3 /100 | #280 | Tragic 17.4% |
| Immigrants from Latvia | 0.3 /100 | #281 | Tragic 17.4% |
| Immigrants from Ireland | 0.3 /100 | #282 | Tragic 17.3% |
| Blacks/African Americans | 0.3 /100 | #283 | Tragic 17.3% |
| Immigrants from Colombia | 0.3 /100 | #284 | Tragic 17.3% |
| Immigrants from Croatia | 0.2 /100 | #285 | Tragic 17.2% |
| Menominee | 0.2 /100 | #286 | Tragic 17.2% |
Immigrants from Kazakhstan 3 or more Vehicles in Household Correlation Summary
| Measurement | Immigrants from Kazakhstan Data | 3 or more Vehicles in Household Data |
| Minimum | 0.0085% | 1.9% |
| Maximum | 3.4% | 59.6% |
| Range | 3.4% | 57.7% |
| Mean | 0.95% | 22.1% |
| Median | 0.79% | 20.1% |
| Interquartile 25% (IQ1) | 0.38% | 15.3% |
| Interquartile 75% (IQ3) | 1.3% | 27.9% |
| Interquartile Range (IQR) | 0.93% | 12.7% |
| Standard Deviation (Sample) | 0.74% | 10.8% |
| Standard Deviation (Population) | 0.74% | 10.7% |
Correlation Details
| Immigrants from Kazakhstan Percentile | Sample Size | 3 or more Vehicles in Household |
[ 0.0% - 0.5% ] 0.0085% | 44,549,186 | 17.4% |
[ 0.0% - 0.5% ] 0.024% | 24,146,891 | 18.0% |
[ 0.0% - 0.5% ] 0.041% | 15,574,964 | 18.3% |
[ 0.0% - 0.5% ] 0.058% | 16,738,616 | 10.5% |
[ 0.0% - 0.5% ] 0.075% | 5,387,266 | 20.1% |
[ 0.0% - 0.5% ] 0.093% | 2,927,688 | 17.6% |
[ 0.0% - 0.5% ] 0.11% | 3,257,380 | 20.2% |
[ 0.0% - 0.5% ] 0.13% | 1,522,056 | 20.3% |
[ 0.0% - 0.5% ] 0.14% | 1,522,347 | 18.6% |
[ 0.0% - 0.5% ] 0.16% | 1,022,316 | 21.5% |
[ 0.0% - 0.5% ] 0.18% | 1,470,864 | 20.4% |
[ 0.0% - 0.5% ] 0.19% | 688,596 | 21.7% |
[ 0.0% - 0.5% ] 0.21% | 511,577 | 21.2% |
[ 0.0% - 0.5% ] 0.23% | 590,647 | 16.7% |
[ 0.0% - 0.5% ] 0.24% | 430,066 | 16.2% |
[ 0.0% - 0.5% ] 0.26% | 417,135 | 17.8% |
[ 0.0% - 0.5% ] 0.28% | 371,115 | 16.1% |
[ 0.0% - 0.5% ] 0.29% | 308,814 | 18.3% |
[ 0.0% - 0.5% ] 0.31% | 240,585 | 20.0% |
[ 0.0% - 0.5% ] 0.33% | 362,414 | 15.1% |
[ 0.0% - 0.5% ] 0.34% | 45,663 | 27.4% |
[ 0.0% - 0.5% ] 0.36% | 120,696 | 20.9% |
[ 0.0% - 0.5% ] 0.38% | 233,312 | 12.3% |
[ 0.0% - 0.5% ] 0.40% | 213,842 | 18.5% |
[ 0.0% - 0.5% ] 0.41% | 158,717 | 16.6% |
[ 0.0% - 0.5% ] 0.43% | 176,461 | 19.5% |
[ 0.0% - 0.5% ] 0.45% | 167,453 | 7.3% |
[ 0.0% - 0.5% ] 0.47% | 110,922 | 7.7% |
[ 0.0% - 0.5% ] 0.49% | 133,795 | 15.1% |
[ 0.0% - 0.5% ] 0.50% | 21,892 | 25.4% |
[ 0.5% - 1.0% ] 0.52% | 28,846 | 32.4% |
[ 0.5% - 1.0% ] 0.53% | 51,951 | 18.2% |
[ 0.5% - 1.0% ] 0.54% | 56,767 | 24.4% |
[ 0.5% - 1.0% ] 0.59% | 63,599 | 17.9% |
[ 0.5% - 1.0% ] 0.60% | 6,664 | 29.2% |
[ 0.5% - 1.0% ] 0.61% | 1,466 | 9.9% |
[ 0.5% - 1.0% ] 0.63% | 60,252 | 24.9% |
[ 0.5% - 1.0% ] 0.65% | 134,010 | 8.0% |
[ 0.5% - 1.0% ] 0.67% | 15,893 | 5.6% |
[ 0.5% - 1.0% ] 0.69% | 49,263 | 29.5% |
[ 0.5% - 1.0% ] 0.71% | 3,827 | 16.4% |
[ 0.5% - 1.0% ] 0.73% | 13,210 | 26.6% |
[ 0.5% - 1.0% ] 0.75% | 6,901 | 20.0% |
[ 0.5% - 1.0% ] 0.77% | 28,083 | 22.4% |
[ 0.5% - 1.0% ] 0.79% | 18,675 | 37.4% |
[ 0.5% - 1.0% ] 0.80% | 29,673 | 15.3% |
[ 0.5% - 1.0% ] 0.83% | 969 | 12.9% |
[ 0.5% - 1.0% ] 0.85% | 4,602 | 34.5% |
[ 0.5% - 1.0% ] 0.87% | 4,383 | 29.5% |
[ 0.5% - 1.0% ] 0.90% | 85,377 | 1.9% |
[ 0.5% - 1.0% ] 0.94% | 24,174 | 13.9% |
[ 0.5% - 1.0% ] 0.95% | 6,952 | 13.4% |
[ 0.5% - 1.0% ] 0.98% | 41,667 | 31.0% |
[ 0.5% - 1.0% ] 0.99% | 10,583 | 37.3% |
[ 1.0% - 1.5% ] 1.01% | 199 | 13.8% |
[ 1.0% - 1.5% ] 1.02% | 30,108 | 10.7% |
[ 1.0% - 1.5% ] 1.04% | 14,291 | 28.0% |
[ 1.0% - 1.5% ] 1.06% | 14,216 | 24.5% |
[ 1.0% - 1.5% ] 1.10% | 2,096 | 25.8% |
[ 1.0% - 1.5% ] 1.12% | 12,863 | 26.6% |
[ 1.0% - 1.5% ] 1.16% | 691 | 44.5% |
[ 1.0% - 1.5% ] 1.18% | 6,592 | 46.3% |
[ 1.0% - 1.5% ] 1.20% | 13,778 | 26.1% |
[ 1.0% - 1.5% ] 1.22% | 6,648 | 29.4% |
[ 1.0% - 1.5% ] 1.24% | 6,914 | 25.4% |
[ 1.0% - 1.5% ] 1.28% | 38,430 | 4.7% |
[ 1.0% - 1.5% ] 1.29% | 466 | 21.8% |
[ 1.0% - 1.5% ] 1.31% | 611 | 37.3% |
[ 1.0% - 1.5% ] 1.34% | 597 | 36.2% |
[ 1.0% - 1.5% ] 1.36% | 8,962 | 13.4% |
[ 1.0% - 1.5% ] 1.38% | 5,162 | 27.9% |
[ 1.0% - 1.5% ] 1.41% | 8,065 | 35.9% |
[ 1.0% - 1.5% ] 1.49% | 202 | 19.0% |
[ 1.0% - 1.5% ] 1.49% | 3,014 | 45.9% |
[ 1.5% - 2.0% ] 1.55% | 3,424 | 26.4% |
[ 1.5% - 2.0% ] 1.58% | 25,729 | 28.6% |
[ 1.5% - 2.0% ] 1.71% | 13,696 | 19.3% |
[ 1.5% - 2.0% ] 1.72% | 116 | 5.2% |
[ 1.5% - 2.0% ] 1.75% | 15,130 | 29.4% |
[ 1.5% - 2.0% ] 1.83% | 3,224 | 22.4% |
[ 1.5% - 2.0% ] 1.84% | 543 | 11.6% |
[ 1.5% - 2.0% ] 1.92% | 417 | 47.1% |
[ 2.0% - 2.5% ] 2.15% | 2,280 | 3.7% |
[ 2.0% - 2.5% ] 2.29% | 1,397 | 59.6% |
[ 2.5% - 3.0% ] 2.61% | 7,662 | 19.6% |
[ 2.5% - 3.0% ] 2.63% | 1,216 | 37.0% |
[ 2.5% - 3.0% ] 2.69% | 446 | 44.4% |
[ 2.5% - 3.0% ] 2.90% | 792 | 20.1% |
[ 2.5% - 3.0% ] 2.91% | 378 | 7.6% |
[ 3.0% - 3.5% ] 3.38% | 681 | 14.8% |