Immigrants from Mexico 3 or more Vehicles in Household
COMPARE
Immigrants from Mexico
Select to Compare
3 or more Vehicles in Household
Immigrants from Mexico 3 or more Vehicles in Household
24.6%
3+ VEHICLES AVAILABLE
100.0/ 100
METRIC RATING
14th/ 347
METRIC RANK
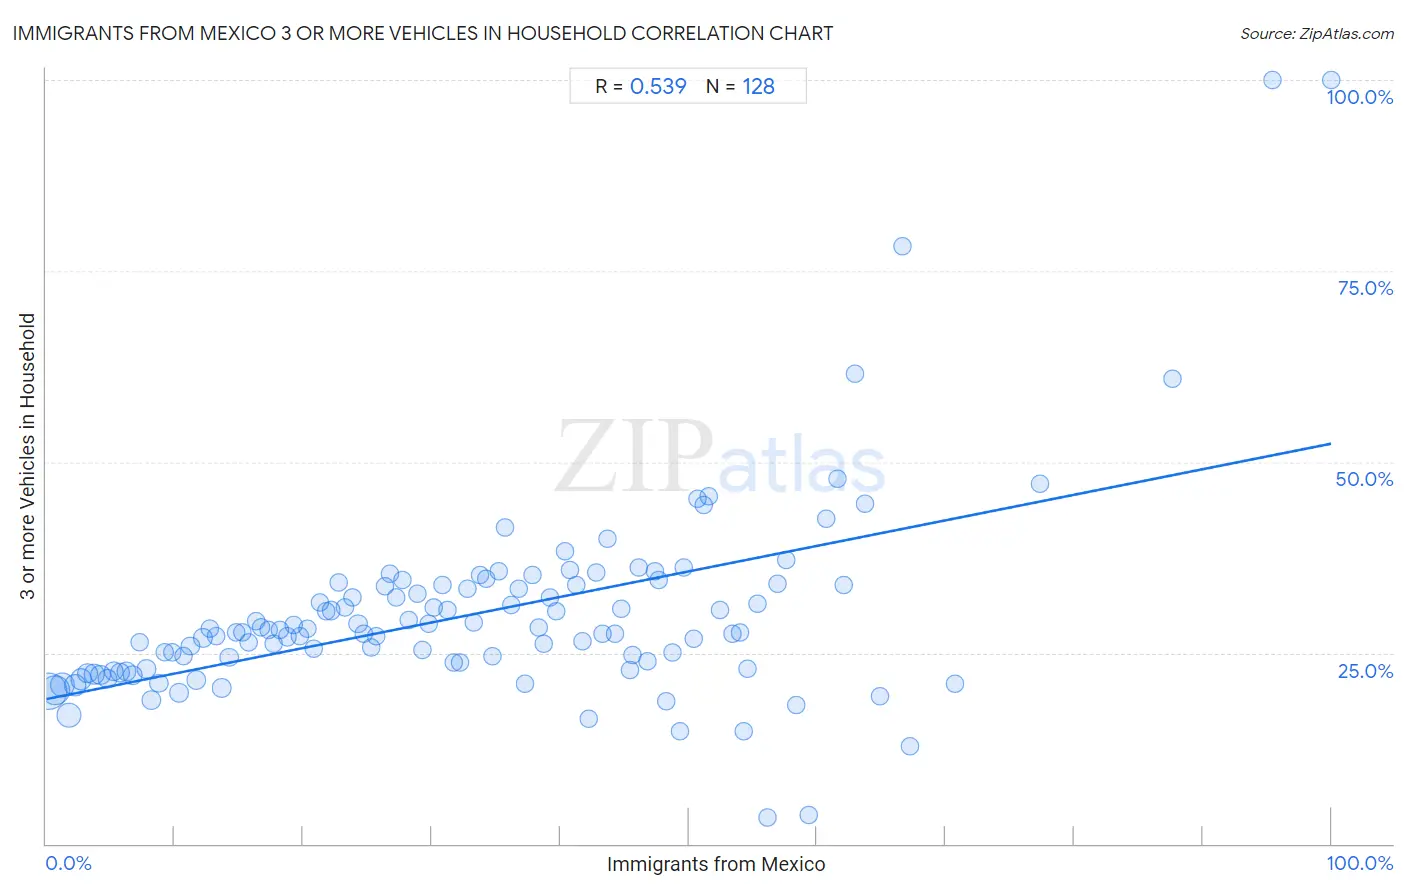
Immigrants from Mexico 3 or more Vehicles in Household Correlation Chart
The statistical analysis conducted on geographies consisting of 513,239,841 people shows a substantial positive correlation between the proportion of Immigrants from Mexico and percentage of households with 3 or more vehicles available in the United States with a correlation coefficient (R) of 0.539 and weighted average of 24.6%. On average, for every 1% (one percent) increase in Immigrants from Mexico within a typical geography, there is an increase of 0.33% in percentage of households with 3 or more vehicles available.
It is essential to understand that the correlation between the percentage of Immigrants from Mexico and percentage of households with 3 or more vehicles available does not imply a direct cause-and-effect relationship. It remains uncertain whether the presence of Immigrants from Mexico influences an upward or downward trend in the level of percentage of households with 3 or more vehicles available within an area, or if Immigrants from Mexico simply ended up residing in those areas with higher or lower levels of percentage of households with 3 or more vehicles available due to other factors.
Demographics Similar to Immigrants from Mexico by 3 or more Vehicles in Household
In terms of 3 or more vehicles in household, the demographic groups most similar to Immigrants from Mexico are Mexican (24.7%, a difference of 0.44%), Danish (24.7%, a difference of 0.52%), Shoshone (24.9%, a difference of 1.2%), Nepalese (24.9%, a difference of 1.3%), and Hawaiian (24.3%, a difference of 1.4%).
| Demographics | Rating | Rank | 3 or more Vehicles in Household |
| Colville | 100.0 /100 | #7 | Exceptional 25.8% |
| Samoans | 100.0 /100 | #8 | Exceptional 25.0% |
| Native Hawaiians | 100.0 /100 | #9 | Exceptional 24.9% |
| Nepalese | 100.0 /100 | #10 | Exceptional 24.9% |
| Shoshone | 100.0 /100 | #11 | Exceptional 24.9% |
| Danes | 100.0 /100 | #12 | Exceptional 24.7% |
| Mexicans | 100.0 /100 | #13 | Exceptional 24.7% |
| Immigrants from Mexico | 100.0 /100 | #14 | Exceptional 24.6% |
| Hawaiians | 100.0 /100 | #15 | Exceptional 24.3% |
| Basques | 100.0 /100 | #16 | Exceptional 24.3% |
| Koreans | 100.0 /100 | #17 | Exceptional 24.1% |
| Norwegians | 100.0 /100 | #18 | Exceptional 23.9% |
| Chinese | 100.0 /100 | #19 | Exceptional 23.9% |
| Paiute | 100.0 /100 | #20 | Exceptional 23.8% |
| Immigrants from Vietnam | 100.0 /100 | #21 | Exceptional 23.8% |
Immigrants from Mexico 3 or more Vehicles in Household Correlation Summary
| Measurement | Immigrants from Mexico Data | 3 or more Vehicles in Household Data |
| Minimum | 0.24% | 3.4% |
| Maximum | 100.0% | 100.0% |
| Range | 99.8% | 96.6% |
| Mean | 33.3% | 30.1% |
| Median | 32.0% | 27.7% |
| Interquartile 25% (IQ1) | 16.0% | 22.9% |
| Interquartile 75% (IQ3) | 47.9% | 33.9% |
| Interquartile Range (IQR) | 31.9% | 11.0% |
| Standard Deviation (Sample) | 21.1% | 13.1% |
| Standard Deviation (Population) | 21.0% | 13.0% |
Correlation Details
| Immigrants from Mexico Percentile | Sample Size | 3 or more Vehicles in Household |
[ 0.0% - 0.5% ] 0.24% | 134,104,084 | 19.9% |
[ 0.5% - 1.0% ] 0.73% | 77,585,630 | 20.1% |
[ 1.0% - 1.5% ] 1.22% | 46,312,375 | 20.8% |
[ 1.5% - 2.0% ] 1.77% | 41,490,509 | 16.9% |
[ 2.0% - 2.5% ] 2.24% | 24,167,966 | 20.8% |
[ 2.5% - 3.0% ] 2.75% | 19,709,208 | 21.5% |
[ 3.0% - 3.5% ] 3.24% | 16,591,559 | 22.3% |
[ 3.5% - 4.0% ] 3.73% | 11,387,471 | 22.2% |
[ 4.0% - 4.5% ] 4.23% | 9,987,606 | 22.1% |
[ 4.5% - 5.0% ] 4.74% | 8,670,873 | 21.6% |
[ 5.0% - 5.5% ] 5.22% | 9,158,364 | 22.7% |
[ 5.5% - 6.0% ] 5.75% | 7,635,105 | 22.4% |
[ 6.0% - 6.5% ] 6.23% | 6,274,357 | 22.6% |
[ 6.5% - 7.0% ] 6.75% | 5,838,701 | 22.1% |
[ 7.0% - 7.5% ] 7.27% | 4,484,917 | 26.4% |
[ 7.5% - 8.0% ] 7.82% | 5,460,901 | 22.9% |
[ 8.0% - 8.5% ] 8.20% | 7,145,753 | 18.7% |
[ 8.5% - 9.0% ] 8.79% | 7,202,527 | 21.0% |
[ 9.0% - 9.5% ] 9.21% | 3,880,201 | 25.1% |
[ 9.5% - 10.0% ] 9.79% | 2,643,647 | 25.1% |
[ 10.0% - 10.5% ] 10.32% | 4,578,619 | 19.7% |
[ 10.5% - 11.0% ] 10.71% | 2,728,460 | 24.6% |
[ 11.0% - 11.5% ] 11.23% | 3,317,977 | 25.9% |
[ 11.5% - 12.0% ] 11.69% | 8,266,897 | 21.4% |
[ 12.0% - 12.5% ] 12.20% | 2,797,366 | 26.9% |
[ 12.5% - 13.0% ] 12.73% | 2,233,205 | 28.1% |
[ 13.0% - 13.5% ] 13.26% | 1,679,081 | 27.2% |
[ 13.5% - 14.0% ] 13.65% | 2,729,300 | 20.4% |
[ 14.0% - 14.5% ] 14.23% | 2,405,717 | 24.4% |
[ 14.5% - 15.0% ] 14.76% | 1,576,160 | 27.6% |
[ 15.0% - 15.5% ] 15.28% | 1,805,748 | 27.7% |
[ 15.5% - 16.0% ] 15.74% | 1,479,361 | 26.4% |
[ 16.0% - 16.5% ] 16.30% | 1,611,555 | 29.1% |
[ 16.5% - 17.0% ] 16.73% | 2,375,262 | 28.3% |
[ 17.0% - 17.5% ] 17.28% | 1,368,105 | 28.1% |
[ 17.5% - 18.0% ] 17.73% | 1,145,429 | 26.2% |
[ 18.0% - 18.5% ] 18.21% | 1,139,104 | 28.0% |
[ 18.5% - 19.0% ] 18.74% | 1,260,994 | 27.1% |
[ 19.0% - 19.5% ] 19.24% | 748,762 | 28.7% |
[ 19.5% - 20.0% ] 19.77% | 1,846,653 | 27.2% |
[ 20.0% - 20.5% ] 20.29% | 1,050,370 | 28.2% |
[ 20.5% - 21.0% ] 20.78% | 585,123 | 25.5% |
[ 21.0% - 21.5% ] 21.30% | 830,158 | 31.6% |
[ 21.5% - 22.0% ] 21.75% | 676,791 | 30.5% |
[ 22.0% - 22.5% ] 22.21% | 734,820 | 30.5% |
[ 22.5% - 23.0% ] 22.75% | 896,714 | 34.2% |
[ 23.0% - 23.5% ] 23.27% | 1,169,033 | 30.9% |
[ 23.5% - 24.0% ] 23.79% | 601,551 | 32.2% |
[ 24.0% - 24.5% ] 24.27% | 463,085 | 28.8% |
[ 24.5% - 25.0% ] 24.72% | 329,238 | 27.5% |
[ 25.0% - 25.5% ] 25.30% | 715,136 | 25.7% |
[ 25.5% - 26.0% ] 25.69% | 673,766 | 27.1% |
[ 26.0% - 26.5% ] 26.35% | 335,554 | 33.7% |
[ 26.5% - 27.0% ] 26.78% | 527,694 | 35.3% |
[ 27.0% - 27.5% ] 27.22% | 726,019 | 32.3% |
[ 27.5% - 28.0% ] 27.70% | 466,916 | 34.6% |
[ 28.0% - 28.5% ] 28.20% | 383,598 | 29.3% |
[ 28.5% - 29.0% ] 28.85% | 698,783 | 32.7% |
[ 29.0% - 29.5% ] 29.24% | 777,952 | 25.3% |
[ 29.5% - 30.0% ] 29.72% | 264,187 | 28.9% |
[ 30.0% - 30.5% ] 30.14% | 283,570 | 30.9% |
[ 30.5% - 31.0% ] 30.80% | 271,422 | 33.8% |
[ 31.0% - 31.5% ] 31.26% | 134,230 | 30.6% |
[ 31.5% - 32.0% ] 31.74% | 263,123 | 23.7% |
[ 32.0% - 32.5% ] 32.20% | 188,655 | 23.8% |
[ 32.5% - 33.0% ] 32.81% | 537,627 | 33.4% |
[ 33.0% - 33.5% ] 33.22% | 128,113 | 29.0% |
[ 33.5% - 34.0% ] 33.72% | 51,606 | 35.2% |
[ 34.0% - 34.5% ] 34.26% | 239,833 | 34.7% |
[ 34.5% - 35.0% ] 34.76% | 403,710 | 24.6% |
[ 35.0% - 35.5% ] 35.19% | 59,763 | 35.7% |
[ 35.5% - 36.0% ] 35.66% | 9,807 | 41.4% |
[ 36.0% - 36.5% ] 36.21% | 82,578 | 31.2% |
[ 36.5% - 37.0% ] 36.73% | 52,009 | 33.4% |
[ 37.0% - 37.5% ] 37.26% | 5,920 | 20.9% |
[ 37.5% - 38.0% ] 37.86% | 43,338 | 35.2% |
[ 38.0% - 38.5% ] 38.29% | 93,616 | 28.3% |
[ 38.5% - 39.0% ] 38.70% | 9,769 | 26.3% |
[ 39.0% - 39.5% ] 39.22% | 116,559 | 32.2% |
[ 39.5% - 40.0% ] 39.72% | 55,968 | 30.4% |
[ 40.0% - 40.5% ] 40.35% | 8,337 | 38.2% |
[ 40.5% - 41.0% ] 40.79% | 98,502 | 35.8% |
[ 41.0% - 41.5% ] 41.27% | 82,954 | 33.9% |
[ 41.5% - 42.0% ] 41.74% | 4,015 | 26.5% |
[ 42.0% - 42.5% ] 42.23% | 14,188 | 16.4% |
[ 42.5% - 43.0% ] 42.83% | 31,885 | 35.6% |
[ 43.0% - 43.5% ] 43.31% | 28,942 | 27.5% |
[ 43.5% - 44.0% ] 43.68% | 5,902 | 40.0% |
[ 44.0% - 44.5% ] 44.29% | 63,429 | 27.5% |
[ 44.5% - 45.0% ] 44.71% | 4,974 | 30.8% |
[ 45.0% - 45.5% ] 45.40% | 23,736 | 22.7% |
[ 45.5% - 46.0% ] 45.57% | 29,477 | 24.7% |
[ 46.0% - 46.5% ] 46.15% | 1,534 | 36.2% |
[ 46.5% - 47.0% ] 46.78% | 9,618 | 23.9% |
[ 47.0% - 47.5% ] 47.36% | 6,676 | 35.7% |
[ 47.5% - 48.0% ] 47.62% | 504 | 34.6% |
[ 48.0% - 48.5% ] 48.26% | 1,061 | 18.7% |
[ 48.5% - 49.0% ] 48.71% | 10,108 | 25.1% |
[ 49.0% - 49.5% ] 49.33% | 892 | 14.8% |
[ 49.5% - 50.0% ] 49.61% | 3,241 | 36.1% |
[ 50.0% - 50.5% ] 50.37% | 3,480 | 26.8% |
[ 50.5% - 51.0% ] 50.68% | 1,543 | 45.2% |
[ 51.0% - 51.5% ] 51.16% | 2,416 | 44.4% |
[ 51.5% - 52.0% ] 51.53% | 1,238 | 45.4% |
[ 52.0% - 52.5% ] 52.40% | 1,540 | 30.6% |
[ 53.0% - 53.5% ] 53.45% | 3,422 | 27.5% |
[ 53.5% - 54.0% ] 53.99% | 9,412 | 27.7% |
[ 54.0% - 54.5% ] 54.31% | 1,414 | 14.7% |
[ 54.5% - 55.0% ] 54.55% | 132 | 22.9% |
[ 55.0% - 55.5% ] 55.33% | 13,279 | 31.5% |
[ 56.0% - 56.5% ] 56.13% | 1,404 | 3.4% |
[ 56.5% - 57.0% ] 56.94% | 497 | 34.1% |
[ 57.5% - 58.0% ] 57.58% | 1,023 | 37.2% |
[ 58.0% - 58.5% ] 58.35% | 922 | 18.1% |
[ 59.0% - 59.5% ] 59.29% | 113 | 3.8% |
[ 60.5% - 61.0% ] 60.71% | 425 | 42.5% |
[ 61.5% - 62.0% ] 61.54% | 130 | 47.8% |
[ 62.0% - 62.5% ] 62.09% | 153 | 33.9% |
[ 62.5% - 63.0% ] 62.93% | 1,748 | 61.6% |
[ 63.5% - 64.0% ] 63.71% | 248 | 44.4% |
[ 64.5% - 65.0% ] 64.84% | 1,061 | 19.3% |
[ 66.5% - 67.0% ] 66.67% | 114 | 78.3% |
[ 67.0% - 67.5% ] 67.19% | 128 | 12.8% |
[ 70.5% - 71.0% ] 70.71% | 140 | 20.9% |
[ 77.0% - 77.5% ] 77.38% | 84 | 47.1% |
[ 87.5% - 88.0% ] 87.63% | 97 | 60.9% |
[ 95.0% - 95.5% ] 95.43% | 197 | 100.0% |
[ 99.5% - 100.0% ] 100.00% | 293 | 100.0% |