Arapaho 3 or more Vehicles in Household

COMPARE

Arapaho
Race
Ancestry
AfghanAfricanAlaska NativeAlaskan AthabascanAlbanianAleutAlsatianAmericanApacheArabArapahoArgentineanArmenianAssyrian/Chaldean/SyriacAustralianAustrianBahamianBangladeshiBarbadianBasqueBelgianBelizeanBermudanBhutaneseBlackfeetBolivianBrazilianBritishBritish West IndianBulgarianBurmeseCajunCambodianCanadianCape VerdeanCarpatho RusynCelticCentral AmericanCentral American IndianCherokeeCheyenneChickasawChileanChineseChippewaChoctawColombianColvilleComancheCosta RicanCreeCreekCroatianCrowCubanCypriotCzechCzechoslovakianDanishDelawareDominicanDutchDutch West IndianEastern EuropeanEcuadorianEgyptianEnglishEstonianEthiopianEuropeanFijianFilipinoFinnishFrenchFrench American IndianFrench CanadianGermanGerman RussianGhanaianGreekGuamanian/ChamorroGuatemalanGuyaneseHaitianHmongHonduranHopiHoumaHungarianIcelanderIndian (Asian)IndonesianInupiatIranianIraqiIrishIroquoisIsraeliItalianJamaicanJapaneseJordanianKenyanKiowaKoreanLaotianLatvianLebaneseLiberianLithuanianLumbeeLuxembourgerMacedonianMalaysianMalteseMarshalleseMenomineeMexicanMexican American IndianMongolianMoroccanNative HawaiianNavajoNepaleseNew ZealanderNicaraguanNigerianNorthern EuropeanNorwegianOkinawanOsageOttawaPaiutePakistaniPalestinianPanamanianParaguayanPennsylvania GermanPeruvianPimaPolishPortuguesePotawatomiPuebloPuerto RicanPuget Sound SalishRomanianRussianSalvadoranSamoanScandinavianScotch-IrishScottishSeminoleSenegaleseSerbianShoshoneSierra LeoneanSiouxSlavicSlovakSloveneSomaliSouth AfricanSouth AmericanSouth American IndianSoviet UnionSpaniardSpanishSpanish AmericanSpanish American IndianSri LankanSubsaharan AfricanSudaneseSwedishSwissSyrianTaiwaneseThaiTlingit-HaidaTohono O'OdhamTonganTrinidadian and TobagonianTsimshianTurkishU.S. Virgin IslanderUgandanUkrainianUruguayanUteVenezuelanVietnameseWelshWest IndianYakamaYaquiYugoslavianYumanYup'ikZimbabwean
Immigration
NonimmigrantsImmigrantsAfghanistanAfricaAlbaniaArgentinaArmeniaAsiaAustraliaAustriaBahamasBangladeshBarbadosBelarusBelgiumBelizeBoliviaBosnia and HerzegovinaBrazilBulgariaBurma/MyanmarCabo VerdeCambodiaCameroonCanadaCaribbeanCentral AmericaChileChinaColombiaCongoCosta RicaCroatiaCubaCzechoslovakiaDenmarkDominicaDominican RepublicEastern AfricaEastern AsiaEastern EuropeEcuadorEgyptEl SalvadorEnglandEritreaEthiopiaEuropeFijiFranceGermanyGhanaGreeceGrenadaGuatemalaGuyanaHaitiHondurasHong KongHungaryIndiaIndonesiaIranIraqIrelandIsraelItalyJamaicaJapanJordanKazakhstanKenyaKoreaKuwaitLaosLatin AmericaLatviaLebanonLiberiaLithuaniaMalaysiaMexicoMicronesiaMiddle AfricaMoldovaMoroccoNepalNetherlandsNicaraguaNigeriaNorth AmericaNorth MacedoniaNorthern AfricaNorthern EuropeNorwayOceaniaPakistanPanamaPeruPhilippinesPolandPortugalRomaniaRussiaSaudi ArabiaScotlandSenegalSerbiaSierra LeoneSingaporeSomaliaSouth AfricaSouth AmericaSouth Central AsiaSouth Eastern AsiaSouthern EuropeSpainSri LankaSt. Vincent and the GrenadinesSudanSwedenSwitzerlandSyriaTaiwanThailandTrinidad and TobagoTurkeyUgandaUkraineUruguayUzbekistanVenezuelaVietnamWest IndiesWestern AfricaWestern AsiaWestern EuropeYemenZaireZimbabweAzores
Select to Compare
Race
Ancestry
AfghanAfricanAlaska NativeAlaskan AthabascanAlbanianAleutAlsatianAmericanApacheArabArgentineanArmenianAssyrian/Chaldean/SyriacAustralianAustrianBahamianBangladeshiBarbadianBasqueBelgianBelizeanBermudanBhutaneseBlackfeetBolivianBrazilianBritishBritish West IndianBulgarianBurmeseCajunCambodianCanadianCape VerdeanCarpatho RusynCelticCentral AmericanCentral American IndianCherokeeCheyenneChickasawChileanChineseChippewaChoctawColombianColvilleComancheCosta RicanCreeCreekCroatianCrowCubanCypriotCzechCzechoslovakianDanishDelawareDominicanDutchDutch West IndianEastern EuropeanEcuadorianEgyptianEnglishEstonianEthiopianEuropeanFijianFilipinoFinnishFrenchFrench American IndianFrench CanadianGermanGerman RussianGhanaianGreekGuamanian/ChamorroGuatemalanGuyaneseHaitianHmongHonduranHopiHoumaHungarianIcelanderIndian (Asian)IndonesianInupiatIranianIraqiIrishIroquoisIsraeliItalianJamaicanJapaneseJordanianKenyanKiowaKoreanLaotianLatvianLebaneseLiberianLithuanianLumbeeLuxembourgerMacedonianMalaysianMalteseMarshalleseMenomineeMexicanMexican American IndianMongolianMoroccanNative HawaiianNavajoNepaleseNew ZealanderNicaraguanNigerianNorthern EuropeanNorwegianOkinawanOsageOttawaPaiutePakistaniPalestinianPanamanianParaguayanPennsylvania GermanPeruvianPimaPolishPortuguesePotawatomiPuebloPuerto RicanPuget Sound SalishRomanianRussianSalvadoranSamoanScandinavianScotch-IrishScottishSeminoleSenegaleseSerbianShoshoneSierra LeoneanSiouxSlavicSlovakSloveneSomaliSouth AfricanSouth AmericanSouth American IndianSoviet UnionSpaniardSpanishSpanish AmericanSpanish American IndianSri LankanSubsaharan AfricanSudaneseSwedishSwissSyrianTaiwaneseThaiTlingit-HaidaTohono O'OdhamTonganTrinidadian and TobagonianTsimshianTurkishU.S. Virgin IslanderUgandanUkrainianUruguayanUteVenezuelanVietnameseWelshWest IndianYakamaYaquiYugoslavianYumanYup'ikZimbabwean
Immigration
NonimmigrantsImmigrantsAfghanistanAfricaAlbaniaArgentinaArmeniaAsiaAustraliaAustriaBahamasBangladeshBarbadosBelarusBelgiumBelizeBoliviaBosnia and HerzegovinaBrazilBulgariaBurma/MyanmarCabo VerdeCambodiaCameroonCanadaCaribbeanCentral AmericaChileChinaColombiaCongoCosta RicaCroatiaCubaCzechoslovakiaDenmarkDominicaDominican RepublicEastern AfricaEastern AsiaEastern EuropeEcuadorEgyptEl SalvadorEnglandEritreaEthiopiaEuropeFijiFranceGermanyGhanaGreeceGrenadaGuatemalaGuyanaHaitiHondurasHong KongHungaryIndiaIndonesiaIranIraqIrelandIsraelItalyJamaicaJapanJordanKazakhstanKenyaKoreaKuwaitLaosLatin AmericaLatviaLebanonLiberiaLithuaniaMalaysiaMexicoMicronesiaMiddle AfricaMoldovaMoroccoNepalNetherlandsNicaraguaNigeriaNorth AmericaNorth MacedoniaNorthern AfricaNorthern EuropeNorwayOceaniaPakistanPanamaPeruPhilippinesPolandPortugalRomaniaRussiaSaudi ArabiaScotlandSenegalSerbiaSierra LeoneSingaporeSomaliaSouth AfricaSouth AmericaSouth Central AsiaSouth Eastern AsiaSouthern EuropeSpainSri LankaSt. Vincent and the GrenadinesSudanSwedenSwitzerlandSyriaTaiwanThailandTrinidad and TobagoTurkeyUgandaUkraineUruguayUzbekistanVenezuelaVietnamWest IndiesWestern AfricaWestern AsiaWestern EuropeYemenZaireZimbabweAzores
3 or more Vehicles in Household
Income
Poverty
Unemployment
Labor Participation
Family Structure
Vehicle Availability
Education Level
Disability

Arapaho 3 or more Vehicles in Household
Exceptional

26.4%
3+ VEHICLES AVAILABLE
100.0/ 100
METRIC RATING
4th/ 347
METRIC RANK

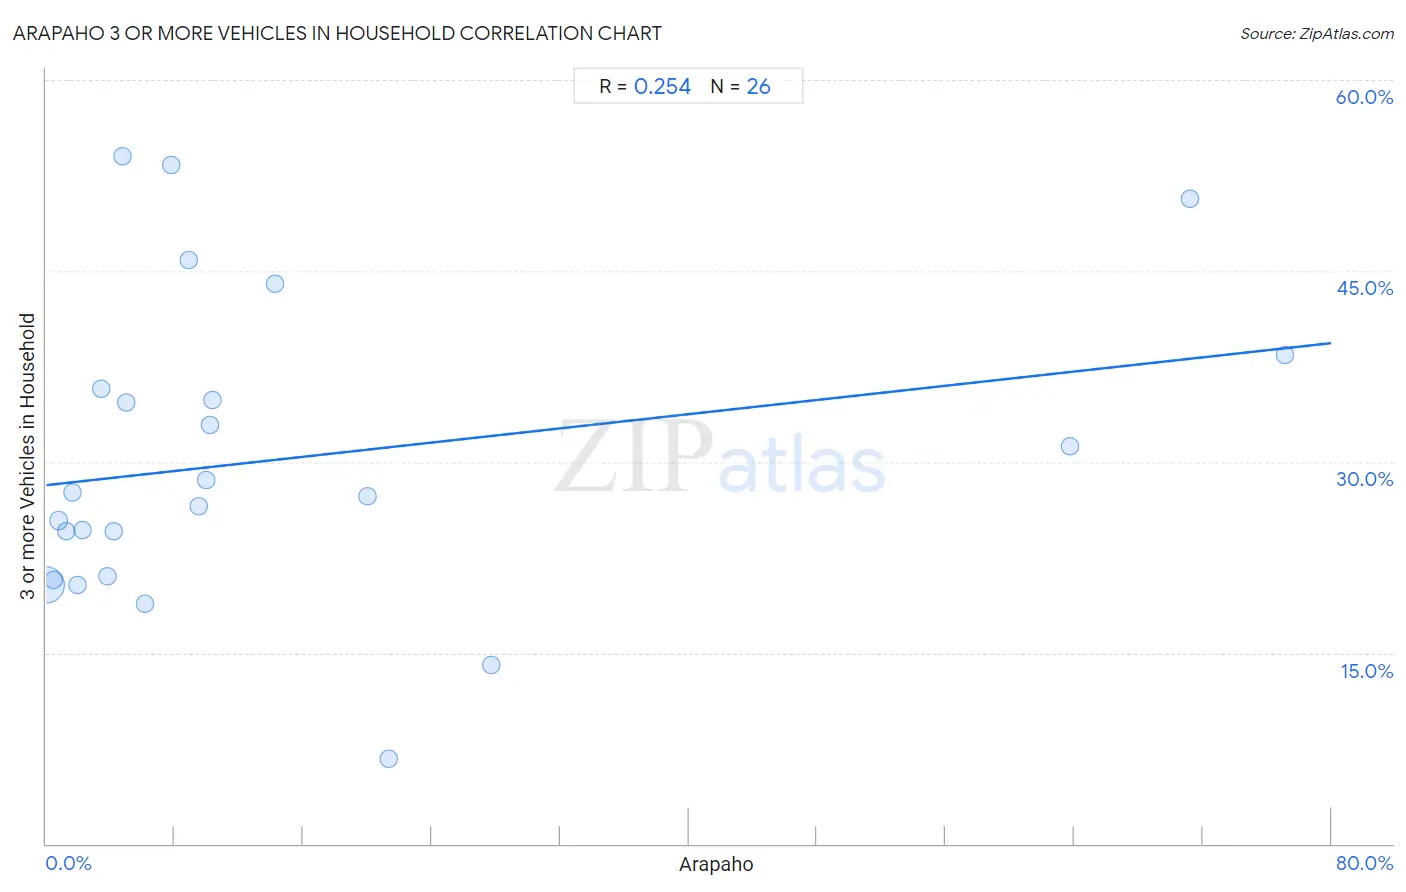
Arapaho 3 or more Vehicles in Household Correlation Chart

The statistical analysis conducted on geographies consisting of 29,776,111 people shows a weak positive correlation between the proportion of Arapaho and percentage of households with 3 or more vehicles available in the United States with a correlation coefficient (R) of 0.254 and weighted average of 26.4%. On average, for every 1% (one percent) increase in Arapaho within a typical geography, there is an increase of 0.14% in percentage of households with 3 or more vehicles available.
Arapaho 3 or more Vehicles in Household
It is essential to understand that the correlation between the percentage of Arapaho and percentage of households with 3 or more vehicles available does not imply a direct cause-and-effect relationship. It remains uncertain whether the presence of Arapaho influences an upward or downward trend in the level of percentage of households with 3 or more vehicles available within an area, or if Arapaho simply ended up residing in those areas with higher or lower levels of percentage of households with 3 or more vehicles available due to other factors.

Demographics Similar to Arapaho by 3 or more Vehicles in Household

In terms of 3 or more vehicles in household, the demographic groups most similar to Arapaho are Tongan (26.5%, a difference of 0.33%), Puget Sound Salish (26.4%, a difference of 0.34%), Immigrants from Fiji (26.1%, a difference of 1.5%), Spanish American Indian (26.9%, a difference of 1.8%), and Colville (25.8%, a difference of 2.7%).
DemographicsRating | Rank3 or more Vehicles in Household
Yakama
100.0
/100
|
#1
Exceptional
31.0%
Spanish American Indians
100.0
/100
|
#2
Exceptional
26.9%
Tongans
100.0
/100
|
#3
Exceptional
26.5%
Arapaho
100.0
/100
|
#4
Exceptional
26.4%
Puget Sound Salish
100.0
/100
|
#5
Exceptional
26.4%
Immigrants from Fiji
100.0
/100
|
#6
Exceptional
26.1%
Colville
100.0
/100
|
#7
Exceptional
25.8%
Samoans
100.0
/100
|
#8
Exceptional
25.0%
Native Hawaiians
100.0
/100
|
#9
Exceptional
24.9%
Nepalese
100.0
/100
|
#10
Exceptional
24.9%
Shoshone
100.0
/100
|
#11
Exceptional
24.9%
Danes
100.0
/100
|
#12
Exceptional
24.7%
Mexicans
100.0
/100
|
#13
Exceptional
24.7%
Immigrants from Mexico
100.0
/100
|
#14
Exceptional
24.6%
Hawaiians
100.0
/100
|
#15
Exceptional
24.3%

Arapaho 3 or more Vehicles in Household Correlation Summary

MeasurementArapaho Data3 or more Vehicles in Household Data
Minimum0.025%6.7%
Maximum77.1%54.0%
Range77.1%47.3%
Mean14.9%30.3%
Median7.0%27.4%
Interquartile 25% (IQ1)2.3%21.0%
Interquartile 75% (IQ3)14.2%35.7%
Interquartile Range (IQR)12.0%14.7%
Standard Deviation (Sample)21.7%11.9%
Standard Deviation (Population)21.3%11.7%

Correlation Details

Arapaho PercentileSample Size3 or more Vehicles in Household
[
0.0%
-
0.5%
]
0.025%
29,358,43620.3%
[
0.0%
-
0.5%
]
0.48%
194,63320.7%
[
0.5%
-
1.0%
]
0.81%
102,51825.4%
[
1.0%
-
1.5%
]
1.22%
21,64824.5%
[
1.5%
-
2.0%
]
1.62%
13,91527.6%
[
1.5%
-
2.0%
]
1.95%
9,82820.3%
[
2.0%
-
2.5%
]
2.28%
4,91824.6%
[
3.0%
-
3.5%
]
3.43%
5,51435.7%
[
3.5%
-
4.0%
]
3.83%
57421.0%
[
4.0%
-
4.5%
]
4.18%
8,01024.5%
[
4.5%
-
5.0%
]
4.73%
99354.0%
[
5.0%
-
5.5%
]
5.01%
3,09334.7%
[
6.0%
-
6.5%
]
6.17%
10,73318.9%
[
7.5%
-
8.0%
]
7.77%
28353.3%
[
8.5%
-
9.0%
]
8.89%
59645.8%
[
9.0%
-
9.5%
]
9.48%
3,12226.5%
[
9.5%
-
10.0%
]
9.96%
18,89828.5%
[
10.0%
-
10.5%
]
10.18%
13,24832.9%
[
10.0%
-
10.5%
]
10.34%
5834.9%
[
14.0%
-
14.5%
]
14.23%
51344.0%
[
20.0%
-
20.5%
]
20.00%
3027.3%
[
21.0%
-
21.5%
]
21.35%
896.7%
[
27.5%
-
28.0%
]
27.72%
28514.1%
[
63.5%
-
64.0%
]
63.72%
1,59631.3%
[
71.0%
-
71.5%
]
71.24%
1,47150.7%
[
77.0%
-
77.5%
]
77.10%
1,10938.4%