Aleut 3 or more Vehicles in Household

COMPARE

Aleut
Race
Ancestry
AfghanAfricanAlaska NativeAlaskan AthabascanAlbanianAleutAlsatianAmericanApacheArabArapahoArgentineanArmenianAssyrian/Chaldean/SyriacAustralianAustrianBahamianBangladeshiBarbadianBasqueBelgianBelizeanBermudanBhutaneseBlackfeetBolivianBrazilianBritishBritish West IndianBulgarianBurmeseCajunCambodianCanadianCape VerdeanCarpatho RusynCelticCentral AmericanCentral American IndianCherokeeCheyenneChickasawChileanChineseChippewaChoctawColombianColvilleComancheCosta RicanCreeCreekCroatianCrowCubanCypriotCzechCzechoslovakianDanishDelawareDominicanDutchDutch West IndianEastern EuropeanEcuadorianEgyptianEnglishEstonianEthiopianEuropeanFijianFilipinoFinnishFrenchFrench American IndianFrench CanadianGermanGerman RussianGhanaianGreekGuamanian/ChamorroGuatemalanGuyaneseHaitianHmongHonduranHopiHoumaHungarianIcelanderIndian (Asian)IndonesianInupiatIranianIraqiIrishIroquoisIsraeliItalianJamaicanJapaneseJordanianKenyanKiowaKoreanLaotianLatvianLebaneseLiberianLithuanianLumbeeLuxembourgerMacedonianMalaysianMalteseMarshalleseMenomineeMexicanMexican American IndianMongolianMoroccanNative HawaiianNavajoNepaleseNew ZealanderNicaraguanNigerianNorthern EuropeanNorwegianOkinawanOsageOttawaPaiutePakistaniPalestinianPanamanianParaguayanPennsylvania GermanPeruvianPimaPolishPortuguesePotawatomiPuebloPuerto RicanPuget Sound SalishRomanianRussianSalvadoranSamoanScandinavianScotch-IrishScottishSeminoleSenegaleseSerbianShoshoneSierra LeoneanSiouxSlavicSlovakSloveneSomaliSouth AfricanSouth AmericanSouth American IndianSoviet UnionSpaniardSpanishSpanish AmericanSpanish American IndianSri LankanSubsaharan AfricanSudaneseSwedishSwissSyrianTaiwaneseThaiTlingit-HaidaTohono O'OdhamTonganTrinidadian and TobagonianTsimshianTurkishU.S. Virgin IslanderUgandanUkrainianUruguayanUteVenezuelanVietnameseWelshWest IndianYakamaYaquiYugoslavianYumanYup'ikZimbabwean
Immigration
NonimmigrantsImmigrantsAfghanistanAfricaAlbaniaArgentinaArmeniaAsiaAustraliaAustriaBahamasBangladeshBarbadosBelarusBelgiumBelizeBoliviaBosnia and HerzegovinaBrazilBulgariaBurma/MyanmarCabo VerdeCambodiaCameroonCanadaCaribbeanCentral AmericaChileChinaColombiaCongoCosta RicaCroatiaCubaCzechoslovakiaDenmarkDominicaDominican RepublicEastern AfricaEastern AsiaEastern EuropeEcuadorEgyptEl SalvadorEnglandEritreaEthiopiaEuropeFijiFranceGermanyGhanaGreeceGrenadaGuatemalaGuyanaHaitiHondurasHong KongHungaryIndiaIndonesiaIranIraqIrelandIsraelItalyJamaicaJapanJordanKazakhstanKenyaKoreaKuwaitLaosLatin AmericaLatviaLebanonLiberiaLithuaniaMalaysiaMexicoMicronesiaMiddle AfricaMoldovaMoroccoNepalNetherlandsNicaraguaNigeriaNorth AmericaNorth MacedoniaNorthern AfricaNorthern EuropeNorwayOceaniaPakistanPanamaPeruPhilippinesPolandPortugalRomaniaRussiaSaudi ArabiaScotlandSenegalSerbiaSierra LeoneSingaporeSomaliaSouth AfricaSouth AmericaSouth Central AsiaSouth Eastern AsiaSouthern EuropeSpainSri LankaSt. Vincent and the GrenadinesSudanSwedenSwitzerlandSyriaTaiwanThailandTrinidad and TobagoTurkeyUgandaUkraineUruguayUzbekistanVenezuelaVietnamWest IndiesWestern AfricaWestern AsiaWestern EuropeYemenZaireZimbabweAzores
Select to Compare
Race
Ancestry
AfghanAfricanAlaska NativeAlaskan AthabascanAlbanianAlsatianAmericanApacheArabArapahoArgentineanArmenianAssyrian/Chaldean/SyriacAustralianAustrianBahamianBangladeshiBarbadianBasqueBelgianBelizeanBermudanBhutaneseBlackfeetBolivianBrazilianBritishBritish West IndianBulgarianBurmeseCajunCambodianCanadianCape VerdeanCarpatho RusynCelticCentral AmericanCentral American IndianCherokeeCheyenneChickasawChileanChineseChippewaChoctawColombianColvilleComancheCosta RicanCreeCreekCroatianCrowCubanCypriotCzechCzechoslovakianDanishDelawareDominicanDutchDutch West IndianEastern EuropeanEcuadorianEgyptianEnglishEstonianEthiopianEuropeanFijianFilipinoFinnishFrenchFrench American IndianFrench CanadianGermanGerman RussianGhanaianGreekGuamanian/ChamorroGuatemalanGuyaneseHaitianHmongHonduranHopiHoumaHungarianIcelanderIndian (Asian)IndonesianInupiatIranianIraqiIrishIroquoisIsraeliItalianJamaicanJapaneseJordanianKenyanKiowaKoreanLaotianLatvianLebaneseLiberianLithuanianLumbeeLuxembourgerMacedonianMalaysianMalteseMarshalleseMenomineeMexicanMexican American IndianMongolianMoroccanNative HawaiianNavajoNepaleseNew ZealanderNicaraguanNigerianNorthern EuropeanNorwegianOkinawanOsageOttawaPaiutePakistaniPalestinianPanamanianParaguayanPennsylvania GermanPeruvianPimaPolishPortuguesePotawatomiPuebloPuerto RicanPuget Sound SalishRomanianRussianSalvadoranSamoanScandinavianScotch-IrishScottishSeminoleSenegaleseSerbianShoshoneSierra LeoneanSiouxSlavicSlovakSloveneSomaliSouth AfricanSouth AmericanSouth American IndianSoviet UnionSpaniardSpanishSpanish AmericanSpanish American IndianSri LankanSubsaharan AfricanSudaneseSwedishSwissSyrianTaiwaneseThaiTlingit-HaidaTohono O'OdhamTonganTrinidadian and TobagonianTsimshianTurkishU.S. Virgin IslanderUgandanUkrainianUruguayanUteVenezuelanVietnameseWelshWest IndianYakamaYaquiYugoslavianYumanYup'ikZimbabwean
Immigration
NonimmigrantsImmigrantsAfghanistanAfricaAlbaniaArgentinaArmeniaAsiaAustraliaAustriaBahamasBangladeshBarbadosBelarusBelgiumBelizeBoliviaBosnia and HerzegovinaBrazilBulgariaBurma/MyanmarCabo VerdeCambodiaCameroonCanadaCaribbeanCentral AmericaChileChinaColombiaCongoCosta RicaCroatiaCubaCzechoslovakiaDenmarkDominicaDominican RepublicEastern AfricaEastern AsiaEastern EuropeEcuadorEgyptEl SalvadorEnglandEritreaEthiopiaEuropeFijiFranceGermanyGhanaGreeceGrenadaGuatemalaGuyanaHaitiHondurasHong KongHungaryIndiaIndonesiaIranIraqIrelandIsraelItalyJamaicaJapanJordanKazakhstanKenyaKoreaKuwaitLaosLatin AmericaLatviaLebanonLiberiaLithuaniaMalaysiaMexicoMicronesiaMiddle AfricaMoldovaMoroccoNepalNetherlandsNicaraguaNigeriaNorth AmericaNorth MacedoniaNorthern AfricaNorthern EuropeNorwayOceaniaPakistanPanamaPeruPhilippinesPolandPortugalRomaniaRussiaSaudi ArabiaScotlandSenegalSerbiaSierra LeoneSingaporeSomaliaSouth AfricaSouth AmericaSouth Central AsiaSouth Eastern AsiaSouthern EuropeSpainSri LankaSt. Vincent and the GrenadinesSudanSwedenSwitzerlandSyriaTaiwanThailandTrinidad and TobagoTurkeyUgandaUkraineUruguayUzbekistanVenezuelaVietnamWest IndiesWestern AfricaWestern AsiaWestern EuropeYemenZaireZimbabweAzores
3 or more Vehicles in Household
Income
Poverty
Unemployment
Labor Participation
Family Structure
Vehicle Availability
Education Level
Disability

Aleut 3 or more Vehicles in Household
Excellent

20.2%
3+ VEHICLES AVAILABLE
86.3/ 100
METRIC RATING
138th/ 347
METRIC RANK

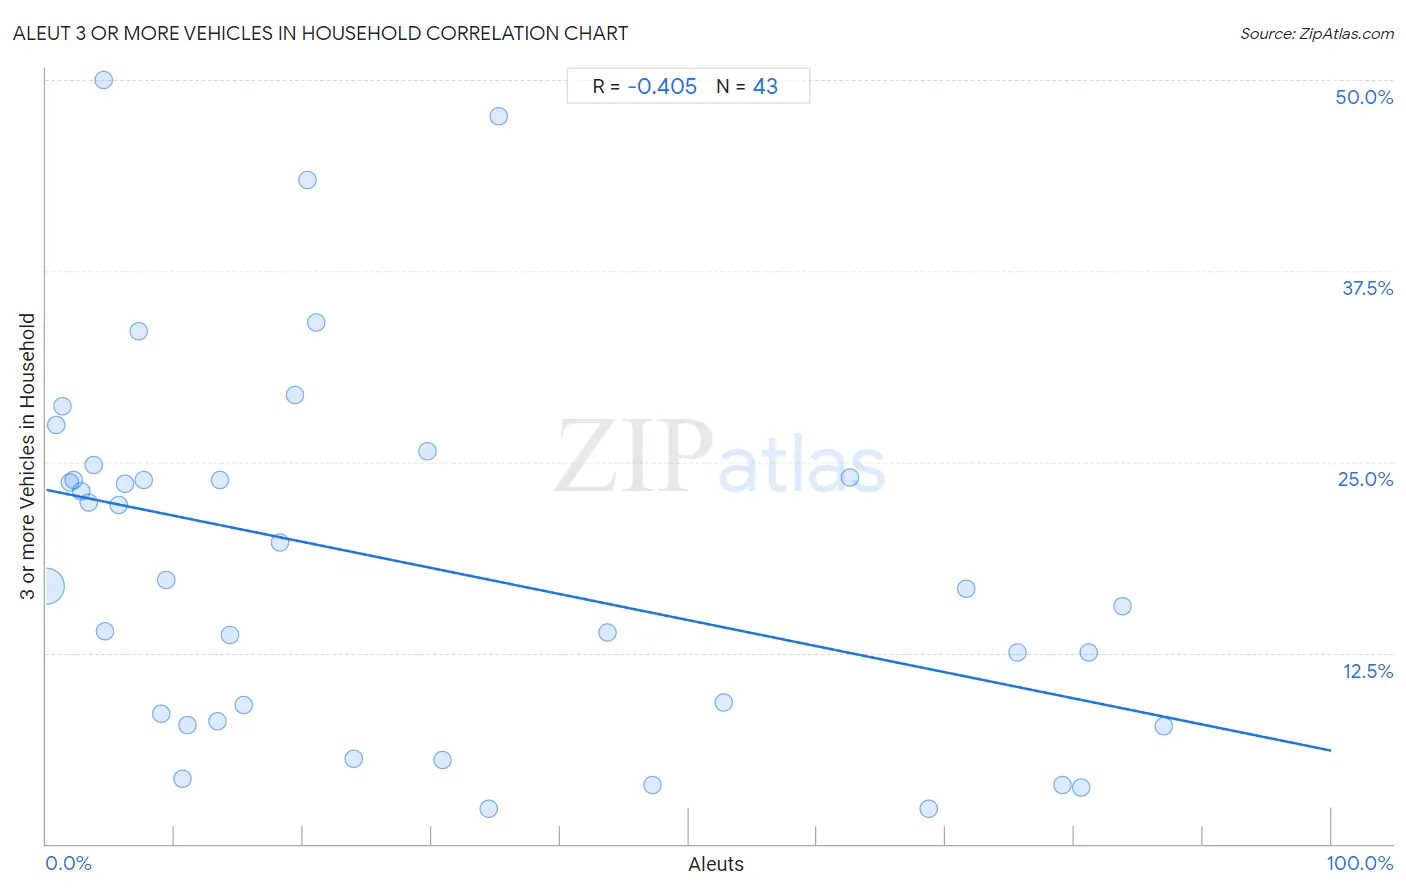
Aleut 3 or more Vehicles in Household Correlation Chart

The statistical analysis conducted on geographies consisting of 61,759,938 people shows a moderate negative correlation between the proportion of Aleuts and percentage of households with 3 or more vehicles available in the United States with a correlation coefficient (R) of -0.405 and weighted average of 20.2%. On average, for every 1% (one percent) increase in Aleuts within a typical geography, there is a decrease of 0.17% in percentage of households with 3 or more vehicles available.
Aleut 3 or more Vehicles in Household
It is essential to understand that the correlation between the percentage of Aleuts and percentage of households with 3 or more vehicles available does not imply a direct cause-and-effect relationship. It remains uncertain whether the presence of Aleuts influences an upward or downward trend in the level of percentage of households with 3 or more vehicles available within an area, or if Aleuts simply ended up residing in those areas with higher or lower levels of percentage of households with 3 or more vehicles available due to other factors.

Demographics Similar to Aleuts by 3 or more Vehicles in Household

In terms of 3 or more vehicles in household, the demographic groups most similar to Aleuts are Immigrants from Nicaragua (20.2%, a difference of 0.12%), Immigrants from Iraq (20.2%, a difference of 0.12%), Slovene (20.2%, a difference of 0.12%), Immigrants from India (20.2%, a difference of 0.13%), and French American Indian (20.1%, a difference of 0.15%).
DemographicsRating | Rank3 or more Vehicles in Household
Immigrants from Asia
88.1
/100
|
#131
Excellent
20.2%
Immigrants from Canada
87.8
/100
|
#132
Excellent
20.2%
Immigrants from North America
87.8
/100
|
#133
Excellent
20.2%
Poles
87.3
/100
|
#134
Excellent
20.2%
Immigrants from India
87.2
/100
|
#135
Excellent
20.2%
Immigrants from Nicaragua
87.1
/100
|
#136
Excellent
20.2%
Immigrants from Iraq
87.1
/100
|
#137
Excellent
20.2%
Aleuts
86.3
/100
|
#138
Excellent
20.2%
Slovenes
85.5
/100
|
#139
Excellent
20.2%
French American Indians
85.3
/100
|
#140
Excellent
20.1%
Ottawa
84.9
/100
|
#141
Excellent
20.1%
Jordanians
84.4
/100
|
#142
Excellent
20.1%
Lithuanians
84.4
/100
|
#143
Excellent
20.1%
Iranians
84.0
/100
|
#144
Excellent
20.1%
Palestinians
83.9
/100
|
#145
Excellent
20.1%

Aleut 3 or more Vehicles in Household Correlation Summary

MeasurementAleut Data3 or more Vehicles in Household Data
Minimum0.022%2.3%
Maximum87.0%50.0%
Range86.9%47.7%
Mean28.2%18.3%
Median15.3%16.8%
Interquartile 25% (IQ1)5.7%8.0%
Interquartile 75% (IQ3)47.2%24.0%
Interquartile Range (IQR)41.5%16.0%
Standard Deviation (Sample)28.4%12.0%
Standard Deviation (Population)28.1%11.8%

Correlation Details

Aleut PercentileSample Size3 or more Vehicles in Household
[
0.0%
-
0.5%
]
0.022%
60,512,83716.8%
[
0.5%
-
1.0%
]
0.74%
352,55127.4%
[
1.0%
-
1.5%
]
1.22%
189,83828.7%
[
1.5%
-
2.0%
]
1.80%
471,12823.7%
[
2.0%
-
2.5%
]
2.12%
88,75623.8%
[
2.5%
-
3.0%
]
2.72%
48,90623.1%
[
3.0%
-
3.5%
]
3.27%
15,54722.3%
[
3.5%
-
4.0%
]
3.68%
19,41924.8%
[
4.0%
-
4.5%
]
4.44%
4550.0%
[
4.5%
-
5.0%
]
4.59%
15,23513.9%
[
5.5%
-
6.0%
]
5.65%
2,77722.2%
[
6.0%
-
6.5%
]
6.17%
3,58023.6%
[
7.0%
-
7.5%
]
7.17%
96333.6%
[
7.5%
-
8.0%
]
7.61%
10,35123.8%
[
8.5%
-
9.0%
]
8.98%
4018.5%
[
9.0%
-
9.5%
]
9.38%
12,61817.3%
[
10.5%
-
11.0%
]
10.62%
2264.3%
[
11.0%
-
11.5%
]
11.00%
2097.8%
[
13.0%
-
13.5%
]
13.29%
1438.0%
[
13.5%
-
14.0%
]
13.51%
3723.8%
[
14.0%
-
14.5%
]
14.35%
23013.7%
[
15.0%
-
15.5%
]
15.32%
4969.1%
[
18.0%
-
18.5%
]
18.16%
4,68019.7%
[
19.0%
-
19.5%
]
19.32%
38329.4%
[
20.0%
-
20.5%
]
20.33%
12343.5%
[
21.0%
-
21.5%
]
21.05%
83634.1%
[
23.5%
-
24.0%
]
23.91%
925.6%
[
29.5%
-
30.0%
]
29.65%
45225.7%
[
30.5%
-
31.0%
]
30.80%
2375.5%
[
34.0%
-
34.5%
]
34.47%
2352.3%
[
35.0%
-
35.5%
]
35.19%
10847.6%
[
43.5%
-
44.0%
]
43.69%
2,34413.8%
[
47.0%
-
47.5%
]
47.17%
1063.8%
[
52.5%
-
53.0%
]
52.71%
2,2169.2%
[
62.5%
-
63.0%
]
62.58%
31024.0%
[
68.5%
-
69.0%
]
68.70%
1152.3%
[
71.5%
-
72.0%
]
71.58%
9516.7%
[
75.5%
-
76.0%
]
75.56%
9012.5%
[
79.0%
-
79.5%
]
79.08%
6983.8%
[
80.5%
-
81.0%
]
80.56%
1443.7%
[
81.0%
-
81.5%
]
81.18%
17012.5%
[
83.5%
-
84.0%
]
83.80%
14215.6%
[
86.5%
-
87.0%
]
86.96%
697.7%