European 3 or more Vehicles in Household
COMPARE
European
Select to Compare
3 or more Vehicles in Household
European 3 or more Vehicles in Household
22.9%
3+ VEHICLES AVAILABLE
100.0/ 100
METRIC RATING
40th/ 347
METRIC RANK
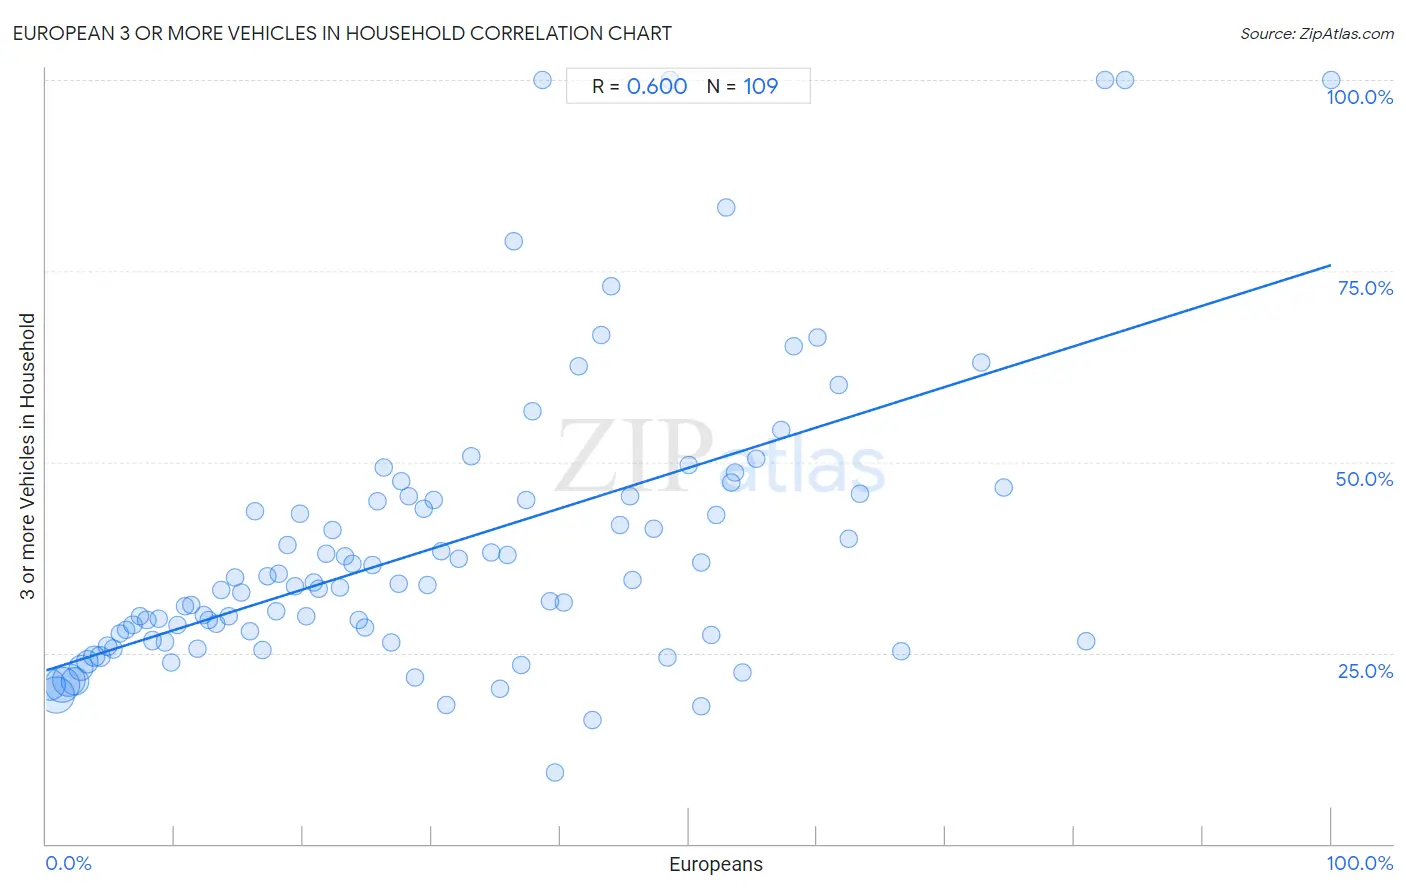
European 3 or more Vehicles in Household Correlation Chart
The statistical analysis conducted on geographies consisting of 560,995,008 people shows a substantial positive correlation between the proportion of Europeans and percentage of households with 3 or more vehicles available in the United States with a correlation coefficient (R) of 0.600 and weighted average of 22.9%. On average, for every 1% (one percent) increase in Europeans within a typical geography, there is an increase of 0.53% in percentage of households with 3 or more vehicles available.
It is essential to understand that the correlation between the percentage of Europeans and percentage of households with 3 or more vehicles available does not imply a direct cause-and-effect relationship. It remains uncertain whether the presence of Europeans influences an upward or downward trend in the level of percentage of households with 3 or more vehicles available within an area, or if Europeans simply ended up residing in those areas with higher or lower levels of percentage of households with 3 or more vehicles available due to other factors.
Demographics Similar to Europeans by 3 or more Vehicles in Household
In terms of 3 or more vehicles in household, the demographic groups most similar to Europeans are Yaqui (22.9%, a difference of 0.25%), Dutch (22.9%, a difference of 0.35%), German (22.7%, a difference of 0.47%), Native/Alaskan (22.7%, a difference of 0.47%), and Swedish (23.0%, a difference of 0.58%).
| Demographics | Rating | Rank | 3 or more Vehicles in Household |
| Spanish Americans | 100.0 /100 | #33 | Exceptional 23.0% |
| Swiss | 100.0 /100 | #34 | Exceptional 23.0% |
| Choctaw | 100.0 /100 | #35 | Exceptional 23.0% |
| Cherokee | 100.0 /100 | #36 | Exceptional 23.0% |
| Swedes | 100.0 /100 | #37 | Exceptional 23.0% |
| Dutch | 100.0 /100 | #38 | Exceptional 22.9% |
| Yaqui | 100.0 /100 | #39 | Exceptional 22.9% |
| Europeans | 100.0 /100 | #40 | Exceptional 22.9% |
| Germans | 100.0 /100 | #41 | Exceptional 22.7% |
| Natives/Alaskans | 100.0 /100 | #42 | Exceptional 22.7% |
| Osage | 100.0 /100 | #43 | Exceptional 22.7% |
| Cheyenne | 100.0 /100 | #44 | Exceptional 22.7% |
| Ute | 100.0 /100 | #45 | Exceptional 22.7% |
| Americans | 100.0 /100 | #46 | Exceptional 22.6% |
| Malaysians | 100.0 /100 | #47 | Exceptional 22.6% |
European 3 or more Vehicles in Household Correlation Summary
| Measurement | European Data | 3 or more Vehicles in Household Data |
| Minimum | 0.27% | 9.3% |
| Maximum | 100.0% | 100.0% |
| Range | 99.7% | 90.7% |
| Mean | 30.9% | 39.1% |
| Median | 27.4% | 33.9% |
| Interquartile 25% (IQ1) | 13.5% | 26.6% |
| Interquartile 75% (IQ3) | 45.5% | 45.2% |
| Interquartile Range (IQR) | 32.1% | 18.7% |
| Standard Deviation (Sample) | 21.5% | 19.0% |
| Standard Deviation (Population) | 21.4% | 18.9% |
Correlation Details
| European Percentile | Sample Size | 3 or more Vehicles in Household |
[ 0.0% - 0.5% ] 0.27% | 85,001,562 | 20.8% |
[ 0.5% - 1.0% ] 0.76% | 110,314,941 | 19.4% |
[ 1.0% - 1.5% ] 1.25% | 106,066,887 | 20.8% |
[ 1.5% - 2.0% ] 1.73% | 86,965,301 | 21.5% |
[ 2.0% - 2.5% ] 2.23% | 58,698,278 | 21.3% |
[ 2.5% - 3.0% ] 2.73% | 39,753,812 | 23.0% |
[ 3.0% - 3.5% ] 3.23% | 23,586,988 | 23.8% |
[ 3.5% - 4.0% ] 3.74% | 15,587,390 | 24.5% |
[ 4.0% - 4.5% ] 4.20% | 11,497,873 | 24.5% |
[ 4.5% - 5.0% ] 4.73% | 6,853,157 | 25.9% |
[ 5.0% - 5.5% ] 5.23% | 4,985,344 | 25.5% |
[ 5.5% - 6.0% ] 5.75% | 2,581,381 | 27.5% |
[ 6.0% - 6.5% ] 6.24% | 1,994,820 | 28.1% |
[ 6.5% - 7.0% ] 6.74% | 1,752,622 | 28.6% |
[ 7.0% - 7.5% ] 7.25% | 836,933 | 29.8% |
[ 7.5% - 8.0% ] 7.82% | 873,746 | 29.3% |
[ 8.0% - 8.5% ] 8.28% | 577,259 | 26.6% |
[ 8.5% - 9.0% ] 8.76% | 407,605 | 29.5% |
[ 9.0% - 9.5% ] 9.20% | 415,536 | 26.4% |
[ 9.5% - 10.0% ] 9.72% | 496,677 | 23.8% |
[ 10.0% - 10.5% ] 10.19% | 242,919 | 28.6% |
[ 10.5% - 11.0% ] 10.78% | 138,078 | 31.0% |
[ 11.0% - 11.5% ] 11.24% | 160,243 | 31.2% |
[ 11.5% - 12.0% ] 11.81% | 117,001 | 25.5% |
[ 12.0% - 12.5% ] 12.29% | 116,200 | 30.0% |
[ 12.5% - 13.0% ] 12.64% | 140,821 | 29.4% |
[ 13.0% - 13.5% ] 13.25% | 47,463 | 28.8% |
[ 13.5% - 14.0% ] 13.66% | 174,437 | 33.2% |
[ 14.0% - 14.5% ] 14.20% | 48,811 | 29.8% |
[ 14.5% - 15.0% ] 14.66% | 96,049 | 34.9% |
[ 15.0% - 15.5% ] 15.22% | 75,387 | 32.9% |
[ 15.5% - 16.0% ] 15.82% | 74,330 | 27.8% |
[ 16.0% - 16.5% ] 16.24% | 12,749 | 43.5% |
[ 16.5% - 17.0% ] 16.82% | 47,129 | 25.3% |
[ 17.0% - 17.5% ] 17.23% | 36,427 | 35.0% |
[ 17.5% - 18.0% ] 17.87% | 41,979 | 30.5% |
[ 18.0% - 18.5% ] 18.13% | 24,646 | 35.4% |
[ 18.5% - 19.0% ] 18.80% | 13,841 | 39.1% |
[ 19.0% - 19.5% ] 19.36% | 15,988 | 33.8% |
[ 19.5% - 20.0% ] 19.77% | 8,341 | 43.2% |
[ 20.0% - 20.5% ] 20.28% | 7,317 | 29.8% |
[ 20.5% - 21.0% ] 20.78% | 6,294 | 34.2% |
[ 21.0% - 21.5% ] 21.21% | 16,079 | 33.3% |
[ 21.5% - 22.0% ] 21.76% | 13,584 | 37.9% |
[ 22.0% - 22.5% ] 22.23% | 6,027 | 41.0% |
[ 22.5% - 23.0% ] 22.83% | 3,277 | 33.5% |
[ 23.0% - 23.5% ] 23.24% | 3,941 | 37.7% |
[ 23.5% - 24.0% ] 23.84% | 2,072 | 36.7% |
[ 24.0% - 24.5% ] 24.32% | 3,717 | 29.3% |
[ 24.5% - 25.0% ] 24.83% | 1,510 | 28.4% |
[ 25.0% - 25.5% ] 25.35% | 8,819 | 36.5% |
[ 25.5% - 26.0% ] 25.74% | 4,716 | 44.9% |
[ 26.0% - 26.5% ] 26.23% | 877 | 49.3% |
[ 26.5% - 27.0% ] 26.80% | 1,787 | 26.3% |
[ 27.0% - 27.5% ] 27.41% | 1,164 | 34.1% |
[ 27.5% - 28.0% ] 27.64% | 1,230 | 47.5% |
[ 28.0% - 28.5% ] 28.16% | 3,231 | 45.5% |
[ 28.5% - 29.0% ] 28.74% | 1,952 | 21.8% |
[ 29.0% - 29.5% ] 29.35% | 920 | 43.9% |
[ 29.5% - 30.0% ] 29.65% | 1,619 | 33.9% |
[ 30.0% - 30.5% ] 30.17% | 1,505 | 44.9% |
[ 30.5% - 31.0% ] 30.78% | 2,791 | 38.2% |
[ 31.0% - 31.5% ] 31.16% | 1,152 | 18.1% |
[ 32.0% - 32.5% ] 32.14% | 1,061 | 37.3% |
[ 33.0% - 33.5% ] 33.08% | 650 | 50.7% |
[ 34.5% - 35.0% ] 34.65% | 3,469 | 38.1% |
[ 35.0% - 35.5% ] 35.28% | 547 | 20.4% |
[ 35.5% - 36.0% ] 35.85% | 569 | 37.7% |
[ 36.0% - 36.5% ] 36.34% | 388 | 78.8% |
[ 36.5% - 37.0% ] 36.95% | 617 | 23.5% |
[ 37.0% - 37.5% ] 37.32% | 209 | 45.0% |
[ 37.5% - 38.0% ] 37.83% | 793 | 56.7% |
[ 38.5% - 39.0% ] 38.58% | 127 | 100.0% |
[ 39.0% - 39.5% ] 39.22% | 51 | 31.8% |
[ 39.5% - 40.0% ] 39.60% | 101 | 9.3% |
[ 40.0% - 40.5% ] 40.29% | 206 | 31.6% |
[ 41.0% - 41.5% ] 41.46% | 82 | 62.5% |
[ 42.5% - 43.0% ] 42.55% | 416 | 16.2% |
[ 43.0% - 43.5% ] 43.18% | 44 | 66.7% |
[ 43.5% - 44.0% ] 43.95% | 248 | 73.0% |
[ 44.5% - 45.0% ] 44.61% | 946 | 41.7% |
[ 45.0% - 45.5% ] 45.39% | 141 | 45.6% |
[ 45.5% - 46.0% ] 45.62% | 1,061 | 34.5% |
[ 47.0% - 47.5% ] 47.31% | 484 | 41.3% |
[ 48.0% - 48.5% ] 48.36% | 122 | 24.3% |
[ 48.5% - 49.0% ] 48.57% | 35 | 100.0% |
[ 50.0% - 50.5% ] 50.00% | 358 | 49.6% |
[ 50.5% - 51.0% ] 50.94% | 53 | 17.9% |
[ 51.0% - 51.5% ] 51.02% | 49 | 36.8% |
[ 51.5% - 52.0% ] 51.72% | 203 | 27.3% |
[ 52.0% - 52.5% ] 52.16% | 347 | 43.1% |
[ 52.5% - 53.0% ] 52.94% | 51 | 83.3% |
[ 53.0% - 53.5% ] 53.33% | 420 | 47.3% |
[ 53.5% - 54.0% ] 53.60% | 125 | 48.5% |
[ 54.0% - 54.5% ] 54.19% | 179 | 22.4% |
[ 55.0% - 55.5% ] 55.28% | 369 | 50.4% |
[ 57.0% - 57.5% ] 57.19% | 668 | 54.1% |
[ 58.0% - 58.5% ] 58.21% | 67 | 65.2% |
[ 60.0% - 60.5% ] 60.00% | 725 | 66.3% |
[ 61.5% - 62.0% ] 61.67% | 621 | 60.0% |
[ 62.0% - 62.5% ] 62.41% | 141 | 40.0% |
[ 63.0% - 63.5% ] 63.35% | 483 | 45.8% |
[ 66.5% - 67.0% ] 66.53% | 236 | 25.2% |
[ 72.5% - 73.0% ] 72.73% | 88 | 63.1% |
[ 74.0% - 74.5% ] 74.47% | 94 | 46.7% |
[ 80.5% - 81.0% ] 80.89% | 246 | 26.6% |
[ 82.0% - 82.5% ] 82.43% | 74 | 100.0% |
[ 83.5% - 84.0% ] 83.96% | 187 | 100.0% |
[ 99.5% - 100.0% ] 100.00% | 325 | 100.0% |