Immigrants from Ukraine 3 or more Vehicles in Household

COMPARE

Immigrants from Ukraine
Race
Ancestry
AfghanAfricanAlaska NativeAlaskan AthabascanAlbanianAleutAlsatianAmericanApacheArabArapahoArgentineanArmenianAssyrian/Chaldean/SyriacAustralianAustrianBahamianBangladeshiBarbadianBasqueBelgianBelizeanBermudanBhutaneseBlackfeetBolivianBrazilianBritishBritish West IndianBulgarianBurmeseCajunCambodianCanadianCape VerdeanCarpatho RusynCelticCentral AmericanCentral American IndianCherokeeCheyenneChickasawChileanChineseChippewaChoctawColombianColvilleComancheCosta RicanCreeCreekCroatianCrowCubanCypriotCzechCzechoslovakianDanishDelawareDominicanDutchDutch West IndianEastern EuropeanEcuadorianEgyptianEnglishEstonianEthiopianEuropeanFijianFilipinoFinnishFrenchFrench American IndianFrench CanadianGermanGerman RussianGhanaianGreekGuamanian/ChamorroGuatemalanGuyaneseHaitianHmongHonduranHopiHoumaHungarianIcelanderIndian (Asian)IndonesianInupiatIranianIraqiIrishIroquoisIsraeliItalianJamaicanJapaneseJordanianKenyanKiowaKoreanLaotianLatvianLebaneseLiberianLithuanianLumbeeLuxembourgerMacedonianMalaysianMalteseMarshalleseMenomineeMexicanMexican American IndianMongolianMoroccanNative HawaiianNavajoNepaleseNew ZealanderNicaraguanNigerianNorthern EuropeanNorwegianOkinawanOsageOttawaPaiutePakistaniPalestinianPanamanianParaguayanPennsylvania GermanPeruvianPimaPolishPortuguesePotawatomiPuebloPuerto RicanPuget Sound SalishRomanianRussianSalvadoranSamoanScandinavianScotch-IrishScottishSeminoleSenegaleseSerbianShoshoneSierra LeoneanSiouxSlavicSlovakSloveneSomaliSouth AfricanSouth AmericanSouth American IndianSoviet UnionSpaniardSpanishSpanish AmericanSpanish American IndianSri LankanSubsaharan AfricanSudaneseSwedishSwissSyrianTaiwaneseThaiTlingit-HaidaTohono O'OdhamTonganTrinidadian and TobagonianTsimshianTurkishU.S. Virgin IslanderUgandanUkrainianUruguayanUteVenezuelanVietnameseWelshWest IndianYakamaYaquiYugoslavianYumanYup'ikZimbabwean
Immigration
NonimmigrantsImmigrantsAfghanistanAfricaAlbaniaArgentinaArmeniaAsiaAustraliaAustriaBahamasBangladeshBarbadosBelarusBelgiumBelizeBoliviaBosnia and HerzegovinaBrazilBulgariaBurma/MyanmarCabo VerdeCambodiaCameroonCanadaCaribbeanCentral AmericaChileChinaColombiaCongoCosta RicaCroatiaCubaCzechoslovakiaDenmarkDominicaDominican RepublicEastern AfricaEastern AsiaEastern EuropeEcuadorEgyptEl SalvadorEnglandEritreaEthiopiaEuropeFijiFranceGermanyGhanaGreeceGrenadaGuatemalaGuyanaHaitiHondurasHong KongHungaryIndiaIndonesiaIranIraqIrelandIsraelItalyJamaicaJapanJordanKazakhstanKenyaKoreaKuwaitLaosLatin AmericaLatviaLebanonLiberiaLithuaniaMalaysiaMexicoMicronesiaMiddle AfricaMoldovaMoroccoNepalNetherlandsNicaraguaNigeriaNorth AmericaNorth MacedoniaNorthern AfricaNorthern EuropeNorwayOceaniaPakistanPanamaPeruPhilippinesPolandPortugalRomaniaRussiaSaudi ArabiaScotlandSenegalSerbiaSierra LeoneSingaporeSomaliaSouth AfricaSouth AmericaSouth Central AsiaSouth Eastern AsiaSouthern EuropeSpainSri LankaSt. Vincent and the GrenadinesSudanSwedenSwitzerlandSyriaTaiwanThailandTrinidad and TobagoTurkeyUgandaUkraineUruguayUzbekistanVenezuelaVietnamWest IndiesWestern AfricaWestern AsiaWestern EuropeYemenZaireZimbabweAzores
Select to Compare
Race
Ancestry
AfghanAfricanAlaska NativeAlaskan AthabascanAlbanianAleutAlsatianAmericanApacheArabArapahoArgentineanArmenianAssyrian/Chaldean/SyriacAustralianAustrianBahamianBangladeshiBarbadianBasqueBelgianBelizeanBermudanBhutaneseBlackfeetBolivianBrazilianBritishBritish West IndianBulgarianBurmeseCajunCambodianCanadianCape VerdeanCarpatho RusynCelticCentral AmericanCentral American IndianCherokeeCheyenneChickasawChileanChineseChippewaChoctawColombianColvilleComancheCosta RicanCreeCreekCroatianCrowCubanCypriotCzechCzechoslovakianDanishDelawareDominicanDutchDutch West IndianEastern EuropeanEcuadorianEgyptianEnglishEstonianEthiopianEuropeanFijianFilipinoFinnishFrenchFrench American IndianFrench CanadianGermanGerman RussianGhanaianGreekGuamanian/ChamorroGuatemalanGuyaneseHaitianHmongHonduranHopiHoumaHungarianIcelanderIndian (Asian)IndonesianInupiatIranianIraqiIrishIroquoisIsraeliItalianJamaicanJapaneseJordanianKenyanKiowaKoreanLaotianLatvianLebaneseLiberianLithuanianLumbeeLuxembourgerMacedonianMalaysianMalteseMarshalleseMenomineeMexicanMexican American IndianMongolianMoroccanNative HawaiianNavajoNepaleseNew ZealanderNicaraguanNigerianNorthern EuropeanNorwegianOkinawanOsageOttawaPaiutePakistaniPalestinianPanamanianParaguayanPennsylvania GermanPeruvianPimaPolishPortuguesePotawatomiPuebloPuerto RicanPuget Sound SalishRomanianRussianSalvadoranSamoanScandinavianScotch-IrishScottishSeminoleSenegaleseSerbianShoshoneSierra LeoneanSiouxSlavicSlovakSloveneSomaliSouth AfricanSouth AmericanSouth American IndianSoviet UnionSpaniardSpanishSpanish AmericanSpanish American IndianSri LankanSubsaharan AfricanSudaneseSwedishSwissSyrianTaiwaneseThaiTlingit-HaidaTohono O'OdhamTonganTrinidadian and TobagonianTsimshianTurkishU.S. Virgin IslanderUgandanUkrainianUruguayanUteVenezuelanVietnameseWelshWest IndianYakamaYaquiYugoslavianYumanYup'ikZimbabwean
Immigration
NonimmigrantsImmigrantsAfghanistanAfricaAlbaniaArgentinaArmeniaAsiaAustraliaAustriaBahamasBangladeshBarbadosBelarusBelgiumBelizeBoliviaBosnia and HerzegovinaBrazilBulgariaBurma/MyanmarCabo VerdeCambodiaCameroonCanadaCaribbeanCentral AmericaChileChinaColombiaCongoCosta RicaCroatiaCubaCzechoslovakiaDenmarkDominicaDominican RepublicEastern AfricaEastern AsiaEastern EuropeEcuadorEgyptEl SalvadorEnglandEritreaEthiopiaEuropeFijiFranceGermanyGhanaGreeceGrenadaGuatemalaGuyanaHaitiHondurasHong KongHungaryIndiaIndonesiaIranIraqIrelandIsraelItalyJamaicaJapanJordanKazakhstanKenyaKoreaKuwaitLaosLatin AmericaLatviaLebanonLiberiaLithuaniaMalaysiaMexicoMicronesiaMiddle AfricaMoldovaMoroccoNepalNetherlandsNicaraguaNigeriaNorth AmericaNorth MacedoniaNorthern AfricaNorthern EuropeNorwayOceaniaPakistanPanamaPeruPhilippinesPolandPortugalRomaniaRussiaSaudi ArabiaScotlandSenegalSerbiaSierra LeoneSingaporeSomaliaSouth AfricaSouth AmericaSouth Central AsiaSouth Eastern AsiaSouthern EuropeSpainSri LankaSt. Vincent and the GrenadinesSudanSwedenSwitzerlandSyriaTaiwanThailandTrinidad and TobagoTurkeyUgandaUruguayUzbekistanVenezuelaVietnamWest IndiesWestern AfricaWestern AsiaWestern EuropeYemenZaireZimbabweAzores
3 or more Vehicles in Household
Income
Poverty
Unemployment
Labor Participation
Family Structure
Vehicle Availability
Education Level
Disability

Immigrants from Ukraine 3 or more Vehicles in Household
Tragic

17.5%
3+ VEHICLES AVAILABLE
0.4/ 100
METRIC RATING
275th/ 347
METRIC RANK

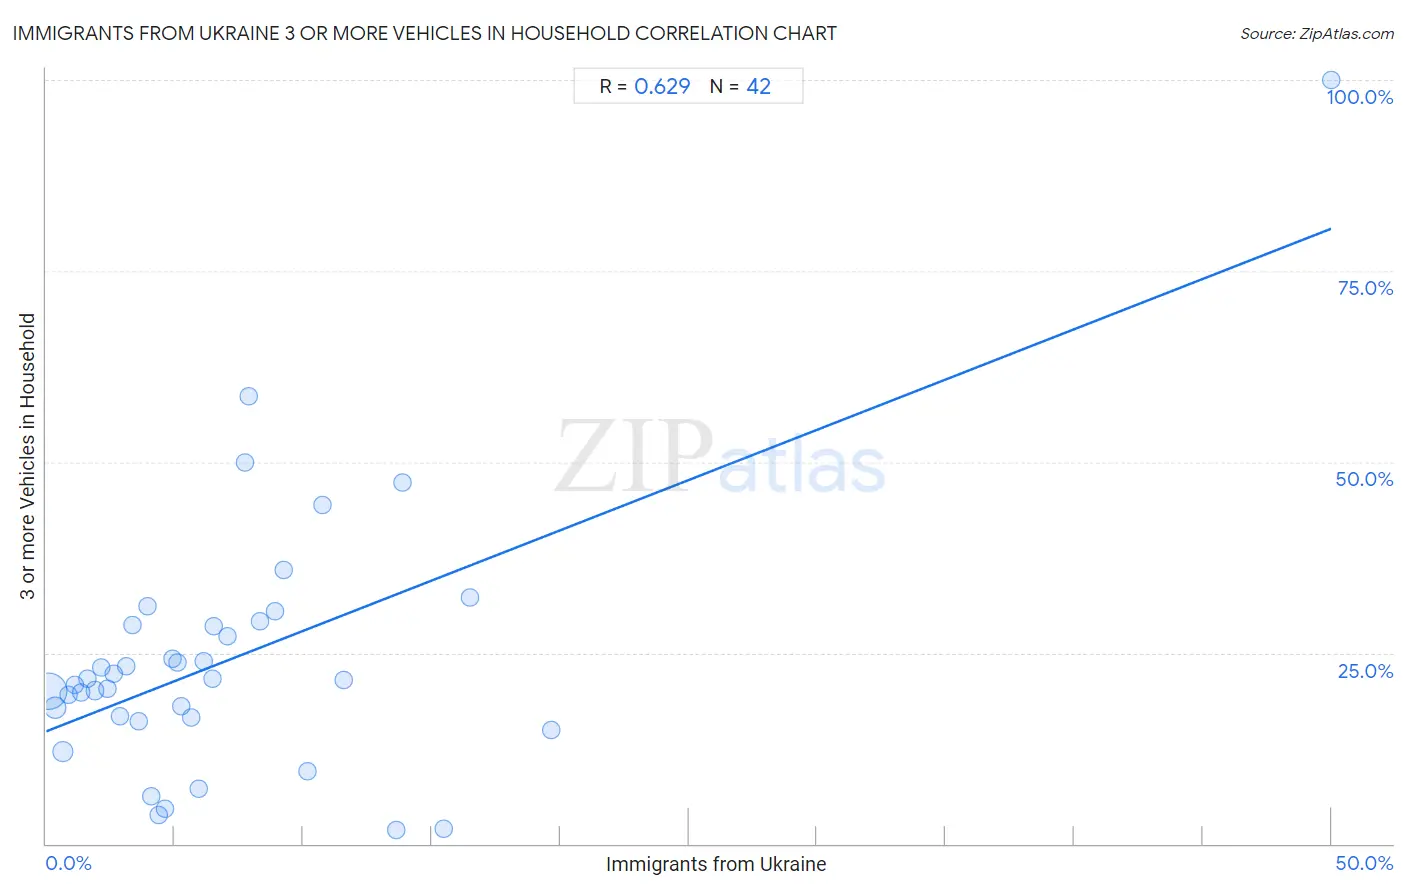
Immigrants from Ukraine 3 or more Vehicles in Household Correlation Chart

The statistical analysis conducted on geographies consisting of 289,525,273 people shows a significant positive correlation between the proportion of Immigrants from Ukraine and percentage of households with 3 or more vehicles available in the United States with a correlation coefficient (R) of 0.629 and weighted average of 17.5%. On average, for every 1% (one percent) increase in Immigrants from Ukraine within a typical geography, there is an increase of 1.3% in percentage of households with 3 or more vehicles available.
Immigrants from Ukraine 3 or more Vehicles in Household
It is essential to understand that the correlation between the percentage of Immigrants from Ukraine and percentage of households with 3 or more vehicles available does not imply a direct cause-and-effect relationship. It remains uncertain whether the presence of Immigrants from Ukraine influences an upward or downward trend in the level of percentage of households with 3 or more vehicles available within an area, or if Immigrants from Ukraine simply ended up residing in those areas with higher or lower levels of percentage of households with 3 or more vehicles available due to other factors.

Demographics Similar to Immigrants from Ukraine by 3 or more Vehicles in Household

In terms of 3 or more vehicles in household, the demographic groups most similar to Immigrants from Ukraine are Okinawan (17.4%, a difference of 0.16%), Immigrants from Bosnia and Herzegovina (17.5%, a difference of 0.29%), Brazilian (17.4%, a difference of 0.30%), Immigrants from Bahamas (17.4%, a difference of 0.39%), and Immigrants from Kazakhstan (17.4%, a difference of 0.41%).
DemographicsRating | Rank3 or more Vehicles in Household
Immigrants from Bulgaria
0.8
/100
|
#268
Tragic
17.7%
Immigrants from France
0.6
/100
|
#269
Tragic
17.6%
Immigrants from Nepal
0.6
/100
|
#270
Tragic
17.6%
South Americans
0.6
/100
|
#271
Tragic
17.6%
Immigrants from Africa
0.5
/100
|
#272
Tragic
17.6%
Immigrants from Sudan
0.5
/100
|
#273
Tragic
17.6%
Immigrants from Bosnia and Herzegovina
0.5
/100
|
#274
Tragic
17.5%
Immigrants from Ukraine
0.4
/100
|
#275
Tragic
17.5%
Okinawans
0.4
/100
|
#276
Tragic
17.4%
Brazilians
0.4
/100
|
#277
Tragic
17.4%
Immigrants from Bahamas
0.3
/100
|
#278
Tragic
17.4%
Immigrants from Kazakhstan
0.3
/100
|
#279
Tragic
17.4%
Immigrants from Eastern Europe
0.3
/100
|
#280
Tragic
17.4%
Immigrants from Latvia
0.3
/100
|
#281
Tragic
17.4%
Immigrants from Ireland
0.3
/100
|
#282
Tragic
17.3%

Immigrants from Ukraine 3 or more Vehicles in Household Correlation Summary

MeasurementImmigrants from Ukraine Data3 or more Vehicles in Household Data
Minimum0.080%1.8%
Maximum50.0%100.0%
Range49.9%98.2%
Mean7.2%24.2%
Median5.2%21.5%
Interquartile 25% (IQ1)2.6%16.6%
Interquartile 75% (IQ3)8.9%28.7%
Interquartile Range (IQR)6.3%12.1%
Standard Deviation (Sample)8.2%17.2%
Standard Deviation (Population)8.1%17.0%

Correlation Details

Immigrants from Ukraine PercentileSample Size3 or more Vehicles in Household
[
0.0%
-
0.5%
]
0.080%
215,855,52219.9%
[
0.0%
-
0.5%
]
0.35%
38,145,97417.8%
[
0.5%
-
1.0%
]
0.66%
20,471,95712.0%
[
0.5%
-
1.0%
]
0.86%
4,315,03619.5%
[
1.0%
-
1.5%
]
1.12%
3,249,18720.8%
[
1.0%
-
1.5%
]
1.36%
1,563,30219.8%
[
1.5%
-
2.0%
]
1.62%
1,343,88221.6%
[
1.5%
-
2.0%
]
1.88%
1,082,20720.1%
[
2.0%
-
2.5%
]
2.16%
613,80223.1%
[
2.0%
-
2.5%
]
2.37%
485,25220.3%
[
2.5%
-
3.0%
]
2.61%
366,35122.2%
[
2.5%
-
3.0%
]
2.89%
228,39416.7%
[
3.0%
-
3.5%
]
3.10%
386,89723.2%
[
3.0%
-
3.5%
]
3.35%
104,15528.7%
[
3.5%
-
4.0%
]
3.59%
75,88016.1%
[
3.5%
-
4.0%
]
3.92%
74,39531.2%
[
4.0%
-
4.5%
]
4.11%
128,2626.2%
[
4.0%
-
4.5%
]
4.38%
119,6863.8%
[
4.5%
-
5.0%
]
4.60%
106,6224.6%
[
4.5%
-
5.0%
]
4.93%
55,61524.2%
[
5.0%
-
5.5%
]
5.12%
116,29623.7%
[
5.0%
-
5.5%
]
5.27%
83,45218.1%
[
5.5%
-
6.0%
]
5.62%
169,69016.6%
[
5.5%
-
6.0%
]
5.91%
91,6357.1%
[
6.0%
-
6.5%
]
6.14%
4,47924.0%
[
6.0%
-
6.5%
]
6.46%
89,42421.5%
[
6.5%
-
7.0%
]
6.52%
47,69828.5%
[
7.0%
-
7.5%
]
7.05%
1,00727.1%
[
7.5%
-
8.0%
]
7.72%
1,46350.0%
[
7.5%
-
8.0%
]
7.88%
1,37058.6%
[
8.0%
-
8.5%
]
8.31%
8,38829.1%
[
8.5%
-
9.0%
]
8.90%
1,16830.4%
[
9.0%
-
9.5%
]
9.22%
90035.9%
[
10.0%
-
10.5%
]
10.19%
6489.5%
[
10.5%
-
11.0%
]
10.77%
49244.3%
[
11.5%
-
12.0%
]
11.56%
74421.4%
[
13.5%
-
14.0%
]
13.63%
47,8931.8%
[
13.5%
-
14.0%
]
13.87%
38247.3%
[
15.0%
-
15.5%
]
15.48%
84,9331.9%
[
16.0%
-
16.5%
]
16.50%
49132.2%
[
19.5%
-
20.0%
]
19.67%
30014.8%
[
50.0%
-
50.5%
]
50.00%
42100.0%