Italian 3 or more Vehicles in Household
COMPARE
Italian
Select to Compare
3 or more Vehicles in Household
Italian 3 or more Vehicles in Household
20.6%
3+ VEHICLES AVAILABLE
94.9/ 100
METRIC RATING
116th/ 347
METRIC RANK
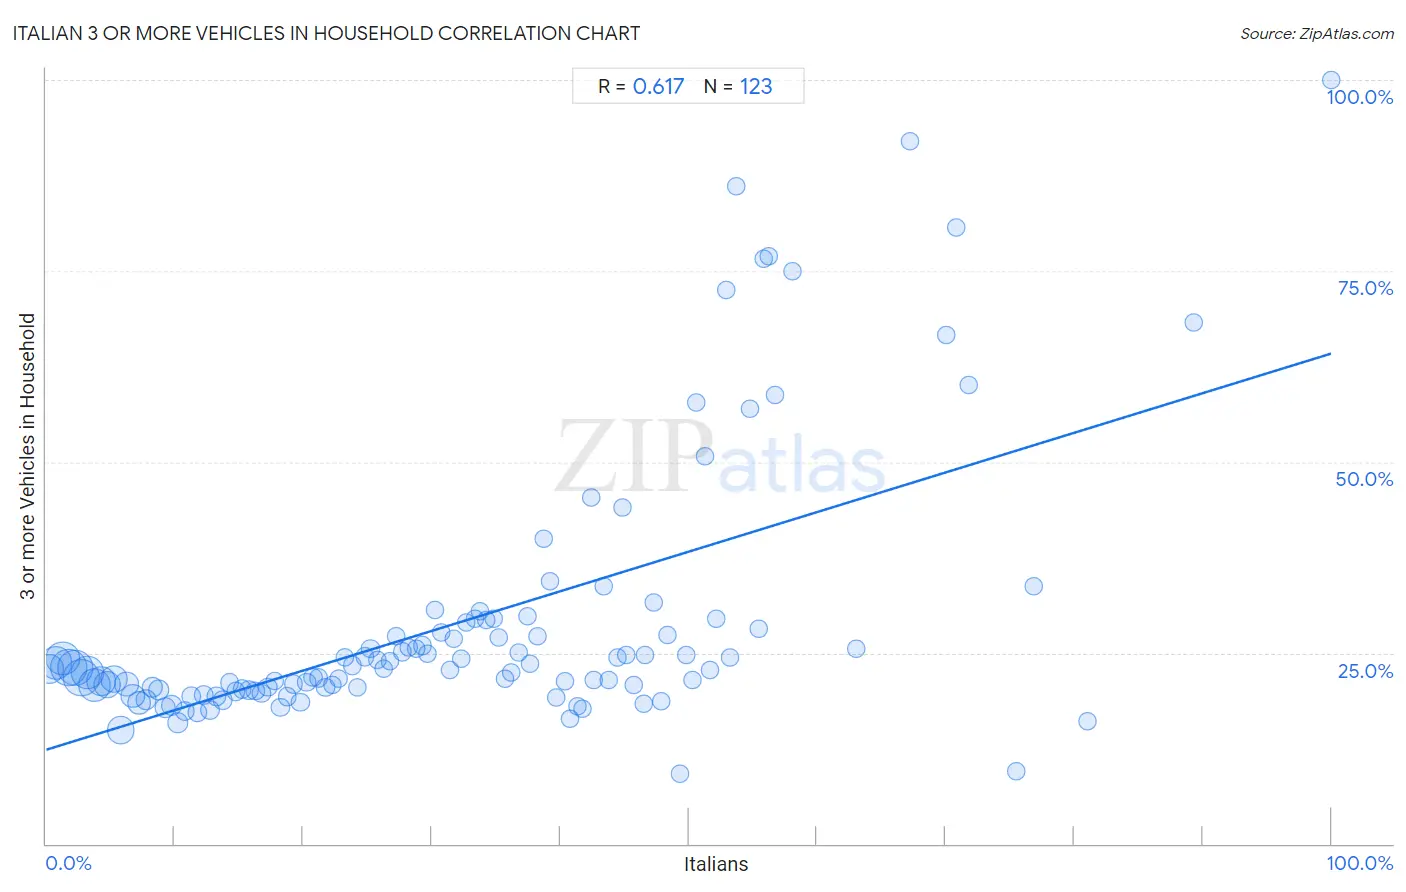
Italian 3 or more Vehicles in Household Correlation Chart
The statistical analysis conducted on geographies consisting of 574,109,348 people shows a significant positive correlation between the proportion of Italians and percentage of households with 3 or more vehicles available in the United States with a correlation coefficient (R) of 0.617 and weighted average of 20.6%. On average, for every 1% (one percent) increase in Italians within a typical geography, there is an increase of 0.52% in percentage of households with 3 or more vehicles available.
It is essential to understand that the correlation between the percentage of Italians and percentage of households with 3 or more vehicles available does not imply a direct cause-and-effect relationship. It remains uncertain whether the presence of Italians influences an upward or downward trend in the level of percentage of households with 3 or more vehicles available within an area, or if Italians simply ended up residing in those areas with higher or lower levels of percentage of households with 3 or more vehicles available due to other factors.
Demographics Similar to Italians by 3 or more Vehicles in Household
In terms of 3 or more vehicles in household, the demographic groups most similar to Italians are Croatian (20.6%, a difference of 0.020%), French Canadian (20.6%, a difference of 0.030%), Costa Rican (20.6%, a difference of 0.13%), Immigrants from Latin America (20.5%, a difference of 0.17%), and Burmese (20.6%, a difference of 0.34%).
| Demographics | Rating | Rank | 3 or more Vehicles in Household |
| Filipinos | 97.0 /100 | #109 | Exceptional 20.8% |
| Asians | 96.8 /100 | #110 | Exceptional 20.8% |
| Immigrants from Micronesia | 96.7 /100 | #111 | Exceptional 20.7% |
| Nicaraguans | 96.2 /100 | #112 | Exceptional 20.7% |
| Immigrants from England | 96.2 /100 | #113 | Exceptional 20.7% |
| Burmese | 95.8 /100 | #114 | Exceptional 20.6% |
| French Canadians | 95.0 /100 | #115 | Exceptional 20.6% |
| Italians | 94.9 /100 | #116 | Exceptional 20.6% |
| Croatians | 94.9 /100 | #117 | Exceptional 20.6% |
| Costa Ricans | 94.6 /100 | #118 | Exceptional 20.6% |
| Immigrants from Latin America | 94.5 /100 | #119 | Exceptional 20.5% |
| Maltese | 93.9 /100 | #120 | Exceptional 20.5% |
| Immigrants from Thailand | 93.8 /100 | #121 | Exceptional 20.5% |
| German Russians | 93.7 /100 | #122 | Exceptional 20.5% |
| Immigrants from Korea | 93.7 /100 | #123 | Exceptional 20.5% |
Italian 3 or more Vehicles in Household Correlation Summary
| Measurement | Italian Data | 3 or more Vehicles in Household Data |
| Minimum | 0.27% | 9.2% |
| Maximum | 100.0% | 100.0% |
| Range | 99.7% | 90.8% |
| Mean | 32.3% | 29.1% |
| Median | 30.8% | 23.0% |
| Interquartile 25% (IQ1) | 15.2% | 20.2% |
| Interquartile 75% (IQ3) | 46.5% | 28.2% |
| Interquartile Range (IQR) | 31.2% | 8.1% |
| Standard Deviation (Sample) | 20.9% | 17.5% |
| Standard Deviation (Population) | 20.8% | 17.5% |
Correlation Details
| Italian Percentile | Sample Size | 3 or more Vehicles in Household |
[ 0.0% - 0.5% ] 0.27% | 28,792,253 | 22.9% |
[ 0.5% - 1.0% ] 0.77% | 38,070,037 | 23.7% |
[ 1.0% - 1.5% ] 1.26% | 41,864,018 | 24.3% |
[ 1.5% - 2.0% ] 1.74% | 50,067,134 | 23.1% |
[ 2.0% - 2.5% ] 2.25% | 45,182,122 | 23.1% |
[ 2.5% - 3.0% ] 2.74% | 49,281,577 | 21.7% |
[ 3.0% - 3.5% ] 3.25% | 40,231,060 | 22.4% |
[ 3.5% - 4.0% ] 3.76% | 39,538,342 | 20.8% |
[ 4.0% - 4.5% ] 4.25% | 30,515,656 | 21.2% |
[ 4.5% - 5.0% ] 4.73% | 25,268,095 | 20.9% |
[ 5.0% - 5.5% ] 5.25% | 21,892,826 | 21.6% |
[ 5.5% - 6.0% ] 5.79% | 26,092,788 | 14.8% |
[ 6.0% - 6.5% ] 6.24% | 14,815,087 | 20.9% |
[ 6.5% - 7.0% ] 6.75% | 14,956,269 | 19.3% |
[ 7.0% - 7.5% ] 7.23% | 11,434,100 | 18.4% |
[ 7.5% - 8.0% ] 7.74% | 7,744,178 | 18.9% |
[ 8.0% - 8.5% ] 8.25% | 7,619,527 | 20.5% |
[ 8.5% - 9.0% ] 8.73% | 6,842,781 | 20.1% |
[ 9.0% - 9.5% ] 9.23% | 5,840,723 | 17.8% |
[ 9.5% - 10.0% ] 9.75% | 4,656,089 | 18.1% |
[ 10.0% - 10.5% ] 10.25% | 5,313,511 | 15.8% |
[ 10.5% - 11.0% ] 10.77% | 4,328,816 | 17.4% |
[ 11.0% - 11.5% ] 11.27% | 3,468,417 | 19.3% |
[ 11.5% - 12.0% ] 11.75% | 4,071,702 | 17.2% |
[ 12.0% - 12.5% ] 12.23% | 3,490,012 | 19.5% |
[ 12.5% - 13.0% ] 12.74% | 3,194,326 | 17.4% |
[ 13.0% - 13.5% ] 13.23% | 2,619,435 | 19.3% |
[ 13.5% - 14.0% ] 13.76% | 2,263,709 | 18.8% |
[ 14.0% - 14.5% ] 14.26% | 2,095,001 | 21.1% |
[ 14.5% - 15.0% ] 14.74% | 2,282,677 | 20.0% |
[ 15.0% - 15.5% ] 15.24% | 1,767,207 | 20.3% |
[ 15.5% - 16.0% ] 15.77% | 2,481,282 | 20.2% |
[ 16.0% - 16.5% ] 16.25% | 1,769,307 | 20.0% |
[ 16.5% - 17.0% ] 16.74% | 2,083,992 | 19.7% |
[ 17.0% - 17.5% ] 17.25% | 1,653,560 | 20.5% |
[ 17.5% - 18.0% ] 17.76% | 1,426,906 | 21.3% |
[ 18.0% - 18.5% ] 18.24% | 996,804 | 17.8% |
[ 18.5% - 19.0% ] 18.74% | 1,296,423 | 19.2% |
[ 19.0% - 19.5% ] 19.22% | 1,587,562 | 20.9% |
[ 19.5% - 20.0% ] 19.77% | 1,394,003 | 18.5% |
[ 20.0% - 20.5% ] 20.25% | 1,264,008 | 21.2% |
[ 20.5% - 21.0% ] 20.76% | 706,614 | 21.8% |
[ 21.0% - 21.5% ] 21.17% | 896,580 | 21.7% |
[ 21.5% - 22.0% ] 21.73% | 676,730 | 20.5% |
[ 22.0% - 22.5% ] 22.27% | 629,661 | 20.8% |
[ 22.5% - 23.0% ] 22.73% | 592,672 | 21.6% |
[ 23.0% - 23.5% ] 23.22% | 803,851 | 24.3% |
[ 23.5% - 24.0% ] 23.79% | 632,345 | 23.3% |
[ 24.0% - 24.5% ] 24.19% | 608,274 | 20.4% |
[ 24.5% - 25.0% ] 24.78% | 695,508 | 24.5% |
[ 25.0% - 25.5% ] 25.24% | 661,158 | 25.6% |
[ 25.5% - 26.0% ] 25.77% | 494,854 | 24.0% |
[ 26.0% - 26.5% ] 26.25% | 411,679 | 23.0% |
[ 26.5% - 27.0% ] 26.73% | 395,889 | 23.9% |
[ 27.0% - 27.5% ] 27.23% | 516,658 | 27.2% |
[ 27.5% - 28.0% ] 27.75% | 664,503 | 25.2% |
[ 28.0% - 28.5% ] 28.21% | 243,177 | 25.8% |
[ 28.5% - 29.0% ] 28.75% | 297,108 | 25.5% |
[ 29.0% - 29.5% ] 29.24% | 335,901 | 26.0% |
[ 29.5% - 30.0% ] 29.70% | 241,273 | 25.0% |
[ 30.0% - 30.5% ] 30.25% | 208,480 | 30.6% |
[ 30.5% - 31.0% ] 30.76% | 189,964 | 27.7% |
[ 31.0% - 31.5% ] 31.41% | 192,786 | 22.8% |
[ 31.5% - 32.0% ] 31.74% | 110,321 | 26.8% |
[ 32.0% - 32.5% ] 32.33% | 136,331 | 24.2% |
[ 32.5% - 33.0% ] 32.72% | 119,984 | 28.9% |
[ 33.0% - 33.5% ] 33.35% | 89,333 | 29.5% |
[ 33.5% - 34.0% ] 33.76% | 60,658 | 30.5% |
[ 34.0% - 34.5% ] 34.22% | 73,981 | 29.2% |
[ 34.5% - 35.0% ] 34.86% | 54,642 | 29.4% |
[ 35.0% - 35.5% ] 35.22% | 75,265 | 27.0% |
[ 35.5% - 36.0% ] 35.74% | 89,111 | 21.6% |
[ 36.0% - 36.5% ] 36.16% | 91,983 | 22.4% |
[ 36.5% - 37.0% ] 36.74% | 78,619 | 25.0% |
[ 37.0% - 37.5% ] 37.42% | 64,994 | 29.8% |
[ 37.5% - 38.0% ] 37.66% | 13,360 | 23.6% |
[ 38.0% - 38.5% ] 38.28% | 42,122 | 27.2% |
[ 38.5% - 39.0% ] 38.70% | 8,060 | 39.9% |
[ 39.0% - 39.5% ] 39.21% | 40,715 | 34.4% |
[ 39.5% - 40.0% ] 39.69% | 93,810 | 19.2% |
[ 40.0% - 40.5% ] 40.34% | 32,938 | 21.2% |
[ 40.5% - 41.0% ] 40.77% | 3,201 | 16.4% |
[ 41.0% - 41.5% ] 41.36% | 1,562 | 18.1% |
[ 41.5% - 42.0% ] 41.70% | 1,964 | 17.7% |
[ 42.0% - 42.5% ] 42.44% | 344 | 45.4% |
[ 42.5% - 43.0% ] 42.64% | 54,970 | 21.5% |
[ 43.0% - 43.5% ] 43.36% | 11,894 | 33.7% |
[ 43.5% - 44.0% ] 43.80% | 1,507 | 21.4% |
[ 44.0% - 44.5% ] 44.41% | 54,015 | 24.4% |
[ 44.5% - 45.0% ] 44.89% | 2,007 | 44.0% |
[ 45.0% - 45.5% ] 45.15% | 536 | 24.7% |
[ 45.5% - 46.0% ] 45.71% | 1,853 | 20.9% |
[ 46.0% - 46.5% ] 46.47% | 15,691 | 18.3% |
[ 46.5% - 47.0% ] 46.61% | 6,179 | 24.7% |
[ 47.0% - 47.5% ] 47.31% | 520 | 31.6% |
[ 47.5% - 48.0% ] 47.81% | 3,384 | 18.7% |
[ 48.0% - 48.5% ] 48.39% | 155 | 27.3% |
[ 49.0% - 49.5% ] 49.27% | 619 | 9.2% |
[ 49.5% - 50.0% ] 49.85% | 680 | 24.7% |
[ 50.0% - 50.5% ] 50.26% | 380 | 21.4% |
[ 50.5% - 51.0% ] 50.61% | 164 | 57.8% |
[ 51.0% - 51.5% ] 51.22% | 123 | 50.8% |
[ 51.5% - 52.0% ] 51.63% | 153 | 22.7% |
[ 52.0% - 52.5% ] 52.16% | 8,114 | 29.4% |
[ 52.5% - 53.0% ] 52.90% | 310 | 72.4% |
[ 53.0% - 53.5% ] 53.18% | 8,165 | 24.3% |
[ 53.5% - 54.0% ] 53.73% | 335 | 86.1% |
[ 54.5% - 55.0% ] 54.80% | 323 | 57.0% |
[ 55.0% - 55.5% ] 55.41% | 1,785 | 28.2% |
[ 55.5% - 56.0% ] 55.88% | 136 | 76.7% |
[ 56.0% - 56.5% ] 56.19% | 105 | 76.9% |
[ 56.5% - 57.0% ] 56.67% | 60 | 58.8% |
[ 58.0% - 58.5% ] 58.09% | 272 | 75.0% |
[ 63.0% - 63.5% ] 63.04% | 92 | 25.5% |
[ 67.0% - 67.5% ] 67.24% | 406 | 92.0% |
[ 70.0% - 70.5% ] 70.00% | 30 | 66.7% |
[ 70.5% - 71.0% ] 70.81% | 298 | 80.7% |
[ 71.5% - 72.0% ] 71.83% | 71 | 60.0% |
[ 75.0% - 75.5% ] 75.45% | 220 | 9.5% |
[ 76.5% - 77.0% ] 76.87% | 640 | 33.6% |
[ 80.5% - 81.0% ] 80.99% | 605 | 16.0% |
[ 89.0% - 89.5% ] 89.30% | 187 | 68.3% |
[ 99.5% - 100.0% ] 100.00% | 79 | 100.0% |