Immigrants from Poland 3 or more Vehicles in Household
COMPARE
Immigrants from Poland
Select to Compare
3 or more Vehicles in Household
Immigrants from Poland 3 or more Vehicles in Household
18.6%
3+ VEHICLES AVAILABLE
7.5/ 100
METRIC RATING
221st/ 347
METRIC RANK
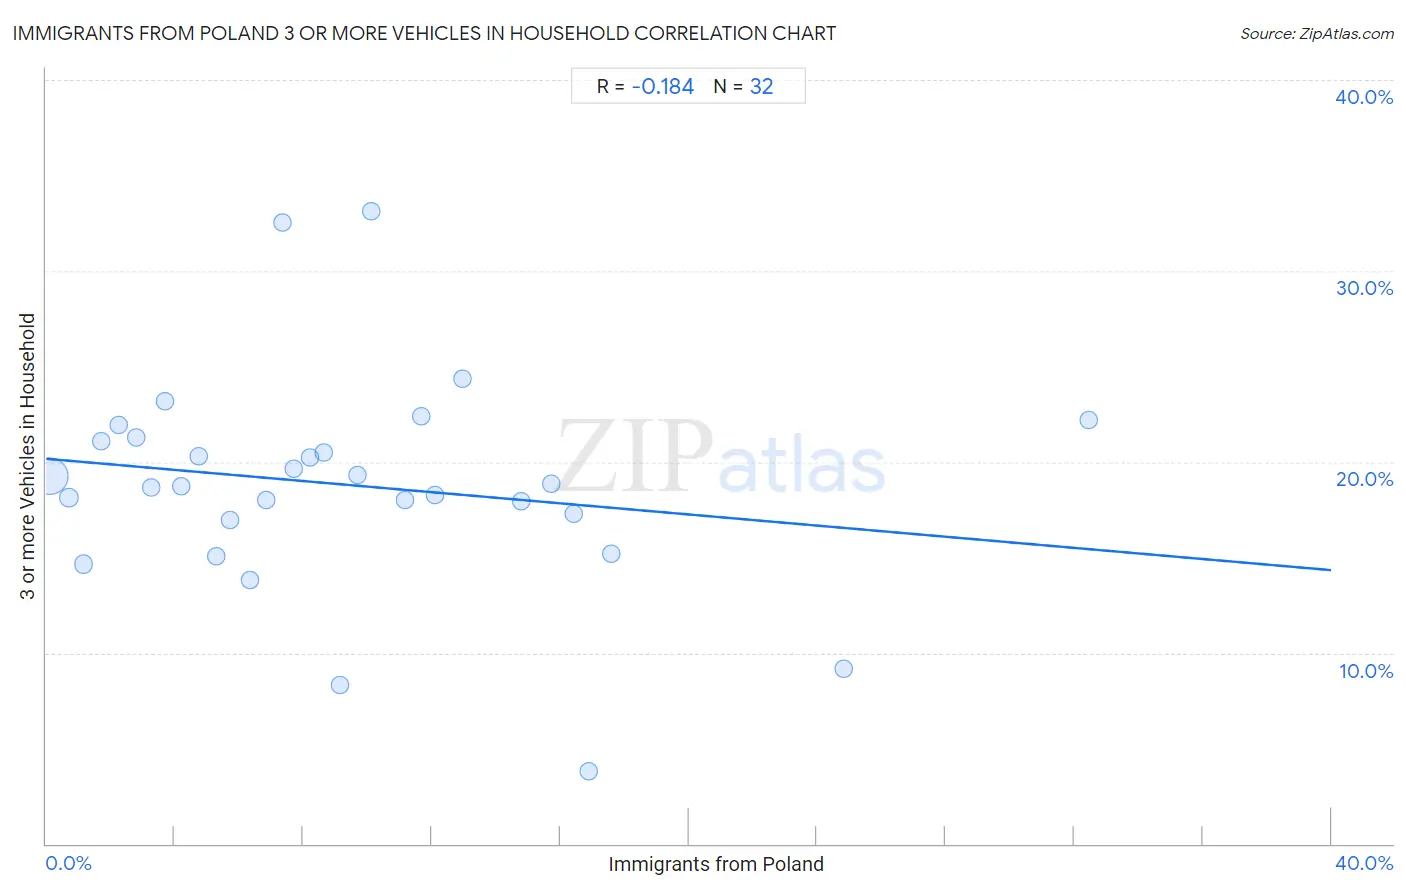
Immigrants from Poland 3 or more Vehicles in Household Correlation Chart
The statistical analysis conducted on geographies consisting of 304,731,133 people shows a poor negative correlation between the proportion of Immigrants from Poland and percentage of households with 3 or more vehicles available in the United States with a correlation coefficient (R) of -0.184 and weighted average of 18.6%. On average, for every 1% (one percent) increase in Immigrants from Poland within a typical geography, there is a decrease of 0.15% in percentage of households with 3 or more vehicles available.
It is essential to understand that the correlation between the percentage of Immigrants from Poland and percentage of households with 3 or more vehicles available does not imply a direct cause-and-effect relationship. It remains uncertain whether the presence of Immigrants from Poland influences an upward or downward trend in the level of percentage of households with 3 or more vehicles available within an area, or if Immigrants from Poland simply ended up residing in those areas with higher or lower levels of percentage of households with 3 or more vehicles available due to other factors.
Demographics Similar to Immigrants from Poland by 3 or more Vehicles in Household
In terms of 3 or more vehicles in household, the demographic groups most similar to Immigrants from Poland are Belizean (18.6%, a difference of 0.050%), Nigerian (18.6%, a difference of 0.090%), Immigrants from Armenia (18.6%, a difference of 0.29%), Immigrants from Portugal (18.6%, a difference of 0.37%), and Immigrants from Czechoslovakia (18.5%, a difference of 0.52%).
| Demographics | Rating | Rank | 3 or more Vehicles in Household |
| Immigrants from Sierra Leone | 10.8 /100 | #214 | Poor 18.7% |
| Eastern Europeans | 10.6 /100 | #215 | Poor 18.7% |
| Immigrants from Nigeria | 10.3 /100 | #216 | Poor 18.7% |
| Immigrants from Italy | 10.2 /100 | #217 | Poor 18.7% |
| Immigrants from Portugal | 8.9 /100 | #218 | Tragic 18.6% |
| Immigrants from Armenia | 8.6 /100 | #219 | Tragic 18.6% |
| Nigerians | 7.9 /100 | #220 | Tragic 18.6% |
| Immigrants from Poland | 7.5 /100 | #221 | Tragic 18.6% |
| Belizeans | 7.3 /100 | #222 | Tragic 18.6% |
| Immigrants from Czechoslovakia | 5.9 /100 | #223 | Tragic 18.5% |
| Immigrants from Argentina | 5.6 /100 | #224 | Tragic 18.5% |
| Immigrants from Lithuania | 5.6 /100 | #225 | Tragic 18.5% |
| Immigrants from Hungary | 5.5 /100 | #226 | Tragic 18.5% |
| Immigrants from Singapore | 5.4 /100 | #227 | Tragic 18.4% |
| Turks | 5.4 /100 | #228 | Tragic 18.4% |
Immigrants from Poland 3 or more Vehicles in Household Correlation Summary
| Measurement | Immigrants from Poland Data | 3 or more Vehicles in Household Data |
| Minimum | 0.11% | 3.8% |
| Maximum | 32.4% | 33.1% |
| Range | 32.3% | 29.3% |
| Mean | 9.3% | 18.8% |
| Median | 8.0% | 18.8% |
| Interquartile 25% (IQ1) | 4.0% | 17.1% |
| Interquartile 75% (IQ3) | 12.5% | 21.2% |
| Interquartile Range (IQR) | 8.6% | 4.0% |
| Standard Deviation (Sample) | 7.2% | 5.7% |
| Standard Deviation (Population) | 7.1% | 5.6% |
Correlation Details
| Immigrants from Poland Percentile | Sample Size | 3 or more Vehicles in Household |
[ 0.0% - 0.5% ] 0.11% | 276,985,578 | 19.3% |
[ 0.5% - 1.0% ] 0.69% | 14,771,365 | 18.1% |
[ 1.0% - 1.5% ] 1.15% | 6,722,792 | 14.6% |
[ 1.5% - 2.0% ] 1.72% | 1,489,712 | 21.1% |
[ 2.0% - 2.5% ] 2.26% | 910,674 | 21.9% |
[ 2.5% - 3.0% ] 2.81% | 870,509 | 21.3% |
[ 3.0% - 3.5% ] 3.27% | 546,314 | 18.7% |
[ 3.5% - 4.0% ] 3.69% | 318,570 | 23.2% |
[ 4.0% - 4.5% ] 4.22% | 509,519 | 18.7% |
[ 4.5% - 5.0% ] 4.76% | 120,672 | 20.3% |
[ 5.0% - 5.5% ] 5.30% | 211,756 | 15.0% |
[ 5.5% - 6.0% ] 5.72% | 271,367 | 17.0% |
[ 6.0% - 6.5% ] 6.33% | 120,280 | 13.8% |
[ 6.5% - 7.0% ] 6.85% | 72,841 | 18.0% |
[ 7.0% - 7.5% ] 7.35% | 26,011 | 32.5% |
[ 7.5% - 8.0% ] 7.70% | 77,897 | 19.7% |
[ 8.0% - 8.5% ] 8.20% | 71,753 | 20.2% |
[ 8.5% - 9.0% ] 8.62% | 168,637 | 20.5% |
[ 9.0% - 9.5% ] 9.14% | 59,530 | 8.3% |
[ 9.5% - 10.0% ] 9.70% | 48,308 | 19.3% |
[ 10.0% - 10.5% ] 10.11% | 1,702 | 33.1% |
[ 11.0% - 11.5% ] 11.15% | 208,356 | 18.0% |
[ 11.5% - 12.0% ] 11.68% | 36,556 | 22.4% |
[ 12.0% - 12.5% ] 12.09% | 1,712 | 18.3% |
[ 12.5% - 13.0% ] 12.96% | 12,525 | 24.3% |
[ 14.5% - 15.0% ] 14.78% | 23,200 | 18.0% |
[ 15.5% - 16.0% ] 15.72% | 15,469 | 18.8% |
[ 16.0% - 16.5% ] 16.40% | 24,233 | 17.3% |
[ 16.5% - 17.0% ] 16.91% | 556 | 3.8% |
[ 17.5% - 18.0% ] 17.58% | 9,026 | 15.2% |
[ 24.5% - 25.0% ] 24.82% | 23,676 | 9.2% |
[ 32.0% - 32.5% ] 32.43% | 37 | 22.2% |