Nonimmigrants 3 or more Vehicles in Household
COMPARE
Nonimmigrants
Select to Compare
3 or more Vehicles in Household
Nonimmigrants 3 or more Vehicles in Household
21.8%
3+ VEHICLES AVAILABLE
99.8/ 100
METRIC RATING
76th/ 347
METRIC RANK
Nonimmigrants 3 or more Vehicles in Household Correlation Chart
The statistical analysis conducted on geographies consisting of 584,058,560 people shows a mild positive correlation between the proportion of Nonimmigrants and percentage of households with 3 or more vehicles available in the United States with a correlation coefficient (R) of 0.346 and weighted average of 21.8%. On average, for every 1% (one percent) increase in Nonimmigrants within a typical geography, there is an increase of 0.090% in percentage of households with 3 or more vehicles available.
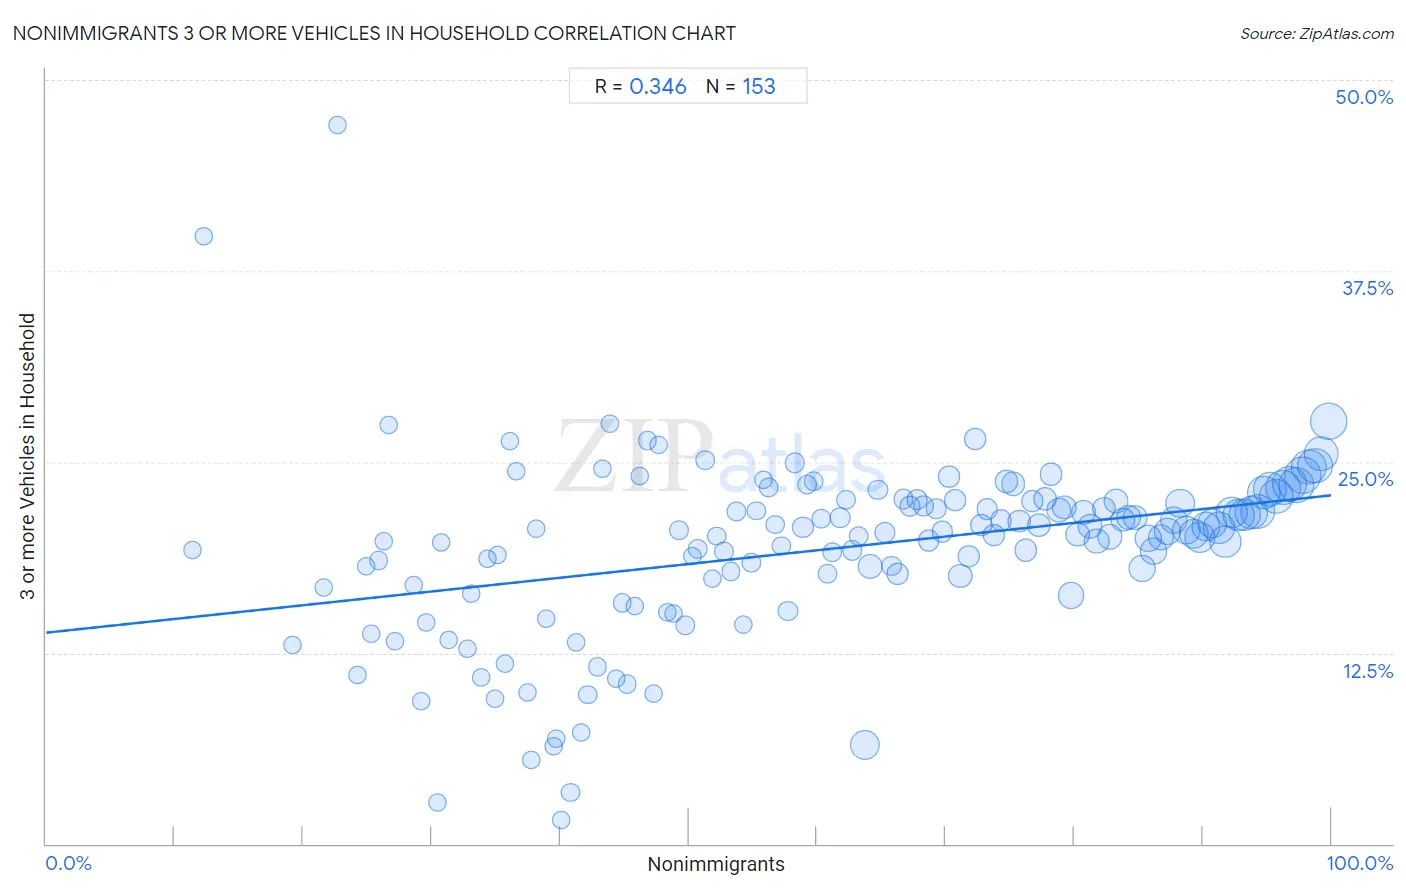
It is essential to understand that the correlation between the percentage of Nonimmigrants and percentage of households with 3 or more vehicles available does not imply a direct cause-and-effect relationship. It remains uncertain whether the presence of Nonimmigrants influences an upward or downward trend in the level of percentage of households with 3 or more vehicles available within an area, or if Nonimmigrants simply ended up residing in those areas with higher or lower levels of percentage of households with 3 or more vehicles available due to other factors.
Demographics Similar to Nonimmigrants by 3 or more Vehicles in Household
In terms of 3 or more vehicles in household, the demographic groups most similar to Nonimmigrants are Japanese (21.8%, a difference of 0.040%), Irish (21.8%, a difference of 0.070%), Immigrants from Oceania (21.8%, a difference of 0.15%), Salvadoran (21.8%, a difference of 0.16%), and Czechoslovakian (21.7%, a difference of 0.20%).
| Demographics | Rating | Rank | 3 or more Vehicles in Household |
| Creek | 99.9 /100 | #69 | Exceptional 21.9% |
| Bangladeshis | 99.8 /100 | #70 | Exceptional 21.9% |
| Potawatomi | 99.8 /100 | #71 | Exceptional 21.9% |
| Portuguese | 99.8 /100 | #72 | Exceptional 21.8% |
| Salvadorans | 99.8 /100 | #73 | Exceptional 21.8% |
| Immigrants from Oceania | 99.8 /100 | #74 | Exceptional 21.8% |
| Japanese | 99.8 /100 | #75 | Exceptional 21.8% |
| Nonimmigrants | 99.8 /100 | #76 | Exceptional 21.8% |
| Irish | 99.8 /100 | #77 | Exceptional 21.8% |
| Czechoslovakians | 99.8 /100 | #78 | Exceptional 21.7% |
| Assyrians/Chaldeans/Syriacs | 99.8 /100 | #79 | Exceptional 21.7% |
| Afghans | 99.7 /100 | #80 | Exceptional 21.7% |
| Celtics | 99.7 /100 | #81 | Exceptional 21.7% |
| Immigrants from El Salvador | 99.6 /100 | #82 | Exceptional 21.5% |
| Chippewa | 99.6 /100 | #83 | Exceptional 21.5% |
Nonimmigrants 3 or more Vehicles in Household Correlation Summary
| Measurement | Nonimmigrants Data | 3 or more Vehicles in Household Data |
| Minimum | 11.3% | 1.6% |
| Maximum | 99.8% | 47.1% |
| Range | 88.5% | 45.5% |
| Mean | 61.4% | 19.3% |
| Median | 61.8% | 20.4% |
| Interquartile 25% (IQ1) | 42.5% | 17.2% |
| Interquartile 75% (IQ3) | 81.0% | 22.5% |
| Interquartile Range (IQR) | 38.5% | 5.3% |
| Standard Deviation (Sample) | 22.8% | 5.9% |
| Standard Deviation (Population) | 22.7% | 5.9% |
Correlation Details
| Nonimmigrants Percentile | Sample Size | 3 or more Vehicles in Household |
[ 11.0% - 11.5% ] 11.35% | 141 | 19.2% |
[ 12.0% - 12.5% ] 12.28% | 171 | 39.8% |
[ 19.0% - 19.5% ] 19.17% | 240 | 13.0% |
[ 21.5% - 22.0% ] 21.63% | 42,081 | 16.8% |
[ 22.5% - 23.0% ] 22.62% | 84 | 47.1% |
[ 24.0% - 24.5% ] 24.26% | 1,018 | 11.1% |
[ 24.5% - 25.0% ] 24.90% | 71,088 | 18.2% |
[ 25.0% - 25.5% ] 25.32% | 46,798 | 13.7% |
[ 25.5% - 26.0% ] 25.85% | 257,738 | 18.6% |
[ 26.0% - 26.5% ] 26.25% | 19,399 | 19.8% |
[ 26.5% - 27.0% ] 26.69% | 29,830 | 27.4% |
[ 27.0% - 27.5% ] 27.15% | 57,226 | 13.3% |
[ 28.5% - 29.0% ] 28.63% | 45,620 | 16.9% |
[ 29.0% - 29.5% ] 29.21% | 138,182 | 9.3% |
[ 29.5% - 30.0% ] 29.61% | 115,169 | 14.5% |
[ 30.0% - 30.5% ] 30.42% | 766 | 2.7% |
[ 30.5% - 31.0% ] 30.74% | 90,791 | 19.7% |
[ 31.0% - 31.5% ] 31.32% | 119,624 | 13.3% |
[ 32.5% - 33.0% ] 32.81% | 128 | 12.8% |
[ 33.0% - 33.5% ] 33.09% | 109,332 | 16.4% |
[ 33.5% - 34.0% ] 33.83% | 152,851 | 10.9% |
[ 34.0% - 34.5% ] 34.34% | 99 | 18.7% |
[ 34.5% - 35.0% ] 34.90% | 52,687 | 9.5% |
[ 35.0% - 35.5% ] 35.12% | 105,802 | 18.9% |
[ 35.5% - 36.0% ] 35.67% | 109,357 | 11.8% |
[ 36.0% - 36.5% ] 36.09% | 115,768 | 26.3% |
[ 36.5% - 37.0% ] 36.57% | 24,681 | 24.4% |
[ 37.0% - 37.5% ] 37.42% | 26,268 | 9.9% |
[ 37.5% - 38.0% ] 37.72% | 94,090 | 5.5% |
[ 38.0% - 38.5% ] 38.12% | 128,876 | 20.6% |
[ 38.5% - 39.0% ] 38.87% | 58,079 | 14.7% |
[ 39.0% - 39.5% ] 39.47% | 36,392 | 6.4% |
[ 39.5% - 40.0% ] 39.70% | 154,064 | 6.9% |
[ 40.0% - 40.5% ] 40.08% | 14,740 | 1.6% |
[ 40.5% - 41.0% ] 40.81% | 86,873 | 3.3% |
[ 41.0% - 41.5% ] 41.20% | 221,533 | 13.2% |
[ 41.5% - 42.0% ] 41.66% | 98,862 | 7.3% |
[ 42.0% - 42.5% ] 42.16% | 598,269 | 9.8% |
[ 42.5% - 43.0% ] 42.87% | 110,508 | 11.6% |
[ 43.0% - 43.5% ] 43.28% | 75,873 | 24.5% |
[ 43.5% - 44.0% ] 43.83% | 91,391 | 27.5% |
[ 44.0% - 44.5% ] 44.39% | 148,590 | 10.8% |
[ 44.5% - 45.0% ] 44.82% | 482,124 | 15.8% |
[ 45.0% - 45.5% ] 45.22% | 593,729 | 10.4% |
[ 45.5% - 46.0% ] 45.83% | 373,110 | 15.6% |
[ 46.0% - 46.5% ] 46.19% | 463,452 | 24.1% |
[ 46.5% - 47.0% ] 46.77% | 137,110 | 26.4% |
[ 47.0% - 47.5% ] 47.24% | 236,458 | 9.8% |
[ 47.5% - 48.0% ] 47.68% | 205,023 | 26.1% |
[ 48.0% - 48.5% ] 48.33% | 305,734 | 15.1% |
[ 48.5% - 49.0% ] 48.82% | 322,007 | 15.0% |
[ 49.0% - 49.5% ] 49.21% | 730,765 | 20.5% |
[ 49.5% - 50.0% ] 49.72% | 640,814 | 14.3% |
[ 50.0% - 50.5% ] 50.31% | 165,718 | 18.8% |
[ 50.5% - 51.0% ] 50.72% | 847,079 | 19.3% |
[ 51.0% - 51.5% ] 51.26% | 845,868 | 25.1% |
[ 51.5% - 52.0% ] 51.86% | 169,522 | 17.4% |
[ 52.0% - 52.5% ] 52.17% | 277,496 | 20.1% |
[ 52.5% - 53.0% ] 52.70% | 841,252 | 19.1% |
[ 53.0% - 53.5% ] 53.28% | 708,122 | 17.8% |
[ 53.5% - 54.0% ] 53.70% | 775,935 | 21.7% |
[ 54.0% - 54.5% ] 54.25% | 710,208 | 14.3% |
[ 54.5% - 55.0% ] 54.86% | 871,806 | 18.4% |
[ 55.0% - 55.5% ] 55.28% | 858,618 | 21.8% |
[ 55.5% - 56.0% ] 55.80% | 369,253 | 23.8% |
[ 56.0% - 56.5% ] 56.21% | 1,289,951 | 23.3% |
[ 56.5% - 57.0% ] 56.74% | 890,335 | 20.9% |
[ 57.0% - 57.5% ] 57.22% | 816,229 | 19.5% |
[ 57.5% - 58.0% ] 57.72% | 1,501,212 | 15.2% |
[ 58.0% - 58.5% ] 58.27% | 1,525,733 | 24.9% |
[ 58.5% - 59.0% ] 58.89% | 2,639,001 | 20.7% |
[ 59.0% - 59.5% ] 59.24% | 1,733,432 | 23.5% |
[ 59.5% - 60.0% ] 59.75% | 1,249,515 | 23.7% |
[ 60.0% - 60.5% ] 60.31% | 1,202,541 | 21.3% |
[ 60.5% - 61.0% ] 60.77% | 1,154,157 | 17.6% |
[ 61.0% - 61.5% ] 61.19% | 1,594,488 | 19.1% |
[ 61.5% - 62.0% ] 61.77% | 1,934,213 | 21.4% |
[ 62.0% - 62.5% ] 62.24% | 1,537,503 | 22.5% |
[ 62.5% - 63.0% ] 62.74% | 1,597,129 | 19.2% |
[ 63.0% - 63.5% ] 63.23% | 1,320,314 | 20.1% |
[ 63.5% - 64.0% ] 63.68% | 10,447,094 | 6.5% |
[ 64.0% - 64.5% ] 64.09% | 5,381,391 | 18.2% |
[ 64.5% - 65.0% ] 64.74% | 1,580,590 | 23.2% |
[ 65.0% - 65.5% ] 65.26% | 2,389,585 | 20.4% |
[ 65.5% - 66.0% ] 65.77% | 1,749,851 | 18.2% |
[ 66.0% - 66.5% ] 66.26% | 3,249,176 | 17.7% |
[ 66.5% - 67.0% ] 66.73% | 1,734,903 | 22.6% |
[ 67.0% - 67.5% ] 67.25% | 2,370,040 | 22.1% |
[ 67.5% - 68.0% ] 67.79% | 2,889,312 | 22.5% |
[ 68.0% - 68.5% ] 68.25% | 2,833,093 | 22.1% |
[ 68.5% - 69.0% ] 68.69% | 2,414,630 | 19.8% |
[ 69.0% - 69.5% ] 69.26% | 2,241,168 | 22.0% |
[ 69.5% - 70.0% ] 69.73% | 2,702,223 | 20.4% |
[ 70.0% - 70.5% ] 70.24% | 2,779,026 | 24.0% |
[ 70.5% - 71.0% ] 70.73% | 3,116,656 | 22.5% |
[ 71.0% - 71.5% ] 71.14% | 5,103,826 | 17.5% |
[ 71.5% - 72.0% ] 71.76% | 3,347,129 | 18.8% |
[ 72.0% - 72.5% ] 72.27% | 2,970,242 | 26.5% |
[ 72.5% - 73.0% ] 72.73% | 3,317,191 | 20.9% |
[ 73.0% - 73.5% ] 73.24% | 2,756,536 | 21.9% |
[ 73.5% - 74.0% ] 73.76% | 3,199,595 | 20.2% |
[ 74.0% - 74.5% ] 74.31% | 2,915,737 | 21.2% |
[ 74.5% - 75.0% ] 74.75% | 4,175,960 | 23.7% |
[ 75.0% - 75.5% ] 75.25% | 5,520,882 | 23.6% |
[ 75.5% - 76.0% ] 75.72% | 3,606,989 | 21.1% |
[ 76.0% - 76.5% ] 76.24% | 4,199,810 | 19.2% |
[ 76.5% - 77.0% ] 76.76% | 3,755,828 | 22.4% |
[ 77.0% - 77.5% ] 77.27% | 4,307,260 | 20.9% |
[ 77.5% - 78.0% ] 77.77% | 4,422,535 | 22.6% |
[ 78.0% - 78.5% ] 78.23% | 3,713,166 | 24.2% |
[ 78.5% - 79.0% ] 78.77% | 5,553,782 | 21.9% |
[ 79.0% - 79.5% ] 79.23% | 4,831,490 | 22.0% |
[ 79.5% - 80.0% ] 79.73% | 7,119,849 | 16.3% |
[ 80.0% - 80.5% ] 80.27% | 5,454,626 | 20.2% |
[ 80.5% - 81.0% ] 80.74% | 5,940,700 | 21.7% |
[ 81.0% - 81.5% ] 81.22% | 5,652,749 | 20.8% |
[ 81.5% - 82.0% ] 81.75% | 5,996,380 | 19.8% |
[ 82.0% - 82.5% ] 82.30% | 4,128,725 | 22.0% |
[ 82.5% - 83.0% ] 82.75% | 5,950,225 | 20.1% |
[ 83.0% - 83.5% ] 83.26% | 6,090,872 | 22.4% |
[ 83.5% - 84.0% ] 83.77% | 5,016,215 | 21.2% |
[ 84.0% - 84.5% ] 84.23% | 5,916,651 | 21.4% |
[ 84.5% - 85.0% ] 84.77% | 5,437,513 | 21.3% |
[ 85.0% - 85.5% ] 85.27% | 8,578,604 | 18.0% |
[ 85.5% - 86.0% ] 85.76% | 8,815,875 | 20.0% |
[ 86.0% - 86.5% ] 86.20% | 8,311,999 | 19.2% |
[ 86.5% - 87.0% ] 86.75% | 7,145,463 | 20.1% |
[ 87.0% - 87.5% ] 87.25% | 7,943,558 | 20.5% |
[ 87.5% - 88.0% ] 87.78% | 7,694,904 | 21.2% |
[ 88.0% - 88.5% ] 88.24% | 9,928,485 | 22.3% |
[ 88.5% - 89.0% ] 88.76% | 8,913,736 | 20.6% |
[ 89.0% - 89.5% ] 89.26% | 10,233,492 | 20.3% |
[ 89.5% - 90.0% ] 89.74% | 11,685,065 | 20.0% |
[ 90.0% - 90.5% ] 90.24% | 9,875,679 | 20.8% |
[ 90.5% - 91.0% ] 90.75% | 10,773,818 | 20.9% |
[ 91.0% - 91.5% ] 91.26% | 12,107,408 | 20.7% |
[ 91.5% - 92.0% ] 91.77% | 11,964,286 | 19.8% |
[ 92.0% - 92.5% ] 92.26% | 11,608,758 | 21.7% |
[ 92.5% - 93.0% ] 92.76% | 12,629,633 | 21.6% |
[ 93.0% - 93.5% ] 93.25% | 13,088,957 | 21.5% |
[ 93.5% - 94.0% ] 93.76% | 13,689,338 | 21.7% |
[ 94.0% - 94.5% ] 94.25% | 14,475,728 | 21.7% |
[ 94.5% - 95.0% ] 94.74% | 13,480,964 | 23.0% |
[ 95.0% - 95.5% ] 95.25% | 13,907,822 | 23.2% |
[ 95.5% - 96.0% ] 95.75% | 14,662,928 | 22.7% |
[ 96.0% - 96.5% ] 96.25% | 14,882,470 | 23.3% |
[ 96.5% - 97.0% ] 96.76% | 15,705,776 | 23.5% |
[ 97.0% - 97.5% ] 97.26% | 15,813,010 | 23.5% |
[ 97.5% - 98.0% ] 97.76% | 16,639,911 | 24.1% |
[ 98.0% - 98.5% ] 98.25% | 15,739,697 | 24.7% |
[ 98.5% - 99.0% ] 98.75% | 15,899,957 | 24.7% |
[ 99.0% - 99.5% ] 99.24% | 14,916,809 | 25.6% |
[ 99.5% - 100.0% ] 99.84% | 17,095,194 | 27.7% |