Romanian 3 or more Vehicles in Household

COMPARE

Romanian
Race
Ancestry
AfghanAfricanAlaska NativeAlaskan AthabascanAlbanianAleutAlsatianAmericanApacheArabArapahoArgentineanArmenianAssyrian/Chaldean/SyriacAustralianAustrianBahamianBangladeshiBarbadianBasqueBelgianBelizeanBermudanBhutaneseBlackfeetBolivianBrazilianBritishBritish West IndianBulgarianBurmeseCajunCambodianCanadianCape VerdeanCarpatho RusynCelticCentral AmericanCentral American IndianCherokeeCheyenneChickasawChileanChineseChippewaChoctawColombianColvilleComancheCosta RicanCreeCreekCroatianCrowCubanCypriotCzechCzechoslovakianDanishDelawareDominicanDutchDutch West IndianEastern EuropeanEcuadorianEgyptianEnglishEstonianEthiopianEuropeanFijianFilipinoFinnishFrenchFrench American IndianFrench CanadianGermanGerman RussianGhanaianGreekGuamanian/ChamorroGuatemalanGuyaneseHaitianHmongHonduranHopiHoumaHungarianIcelanderIndian (Asian)IndonesianInupiatIranianIraqiIrishIroquoisIsraeliItalianJamaicanJapaneseJordanianKenyanKiowaKoreanLaotianLatvianLebaneseLiberianLithuanianLumbeeLuxembourgerMacedonianMalaysianMalteseMarshalleseMenomineeMexicanMexican American IndianMongolianMoroccanNative HawaiianNavajoNepaleseNew ZealanderNicaraguanNigerianNorthern EuropeanNorwegianOkinawanOsageOttawaPaiutePakistaniPalestinianPanamanianParaguayanPennsylvania GermanPeruvianPimaPolishPortuguesePotawatomiPuebloPuerto RicanPuget Sound SalishRomanianRussianSalvadoranSamoanScandinavianScotch-IrishScottishSeminoleSenegaleseSerbianShoshoneSierra LeoneanSiouxSlavicSlovakSloveneSomaliSouth AfricanSouth AmericanSouth American IndianSoviet UnionSpaniardSpanishSpanish AmericanSpanish American IndianSri LankanSubsaharan AfricanSudaneseSwedishSwissSyrianTaiwaneseThaiTlingit-HaidaTohono O'OdhamTonganTrinidadian and TobagonianTsimshianTurkishU.S. Virgin IslanderUgandanUkrainianUruguayanUteVenezuelanVietnameseWelshWest IndianYakamaYaquiYugoslavianYumanYup'ikZimbabwean
Immigration
NonimmigrantsImmigrantsAfghanistanAfricaAlbaniaArgentinaArmeniaAsiaAustraliaAustriaBahamasBangladeshBarbadosBelarusBelgiumBelizeBoliviaBosnia and HerzegovinaBrazilBulgariaBurma/MyanmarCabo VerdeCambodiaCameroonCanadaCaribbeanCentral AmericaChileChinaColombiaCongoCosta RicaCroatiaCubaCzechoslovakiaDenmarkDominicaDominican RepublicEastern AfricaEastern AsiaEastern EuropeEcuadorEgyptEl SalvadorEnglandEritreaEthiopiaEuropeFijiFranceGermanyGhanaGreeceGrenadaGuatemalaGuyanaHaitiHondurasHong KongHungaryIndiaIndonesiaIranIraqIrelandIsraelItalyJamaicaJapanJordanKazakhstanKenyaKoreaKuwaitLaosLatin AmericaLatviaLebanonLiberiaLithuaniaMalaysiaMexicoMicronesiaMiddle AfricaMoldovaMoroccoNepalNetherlandsNicaraguaNigeriaNorth AmericaNorth MacedoniaNorthern AfricaNorthern EuropeNorwayOceaniaPakistanPanamaPeruPhilippinesPolandPortugalRomaniaRussiaSaudi ArabiaScotlandSenegalSerbiaSierra LeoneSingaporeSomaliaSouth AfricaSouth AmericaSouth Central AsiaSouth Eastern AsiaSouthern EuropeSpainSri LankaSt. Vincent and the GrenadinesSudanSwedenSwitzerlandSyriaTaiwanThailandTrinidad and TobagoTurkeyUgandaUkraineUruguayUzbekistanVenezuelaVietnamWest IndiesWestern AfricaWestern AsiaWestern EuropeYemenZaireZimbabweAzores
Select to Compare
Race
Ancestry
AfghanAfricanAlaska NativeAlaskan AthabascanAlbanianAleutAlsatianAmericanApacheArabArapahoArgentineanArmenianAssyrian/Chaldean/SyriacAustralianAustrianBahamianBangladeshiBarbadianBasqueBelgianBelizeanBermudanBhutaneseBlackfeetBolivianBrazilianBritishBritish West IndianBulgarianBurmeseCajunCambodianCanadianCape VerdeanCarpatho RusynCelticCentral AmericanCentral American IndianCherokeeCheyenneChickasawChileanChineseChippewaChoctawColombianColvilleComancheCosta RicanCreeCreekCroatianCrowCubanCypriotCzechCzechoslovakianDanishDelawareDominicanDutchDutch West IndianEastern EuropeanEcuadorianEgyptianEnglishEstonianEthiopianEuropeanFijianFilipinoFinnishFrenchFrench American IndianFrench CanadianGermanGerman RussianGhanaianGreekGuamanian/ChamorroGuatemalanGuyaneseHaitianHmongHonduranHopiHoumaHungarianIcelanderIndian (Asian)IndonesianInupiatIranianIraqiIrishIroquoisIsraeliItalianJamaicanJapaneseJordanianKenyanKiowaKoreanLaotianLatvianLebaneseLiberianLithuanianLumbeeLuxembourgerMacedonianMalaysianMalteseMarshalleseMenomineeMexicanMexican American IndianMongolianMoroccanNative HawaiianNavajoNepaleseNew ZealanderNicaraguanNigerianNorthern EuropeanNorwegianOkinawanOsageOttawaPaiutePakistaniPalestinianPanamanianParaguayanPennsylvania GermanPeruvianPimaPolishPortuguesePotawatomiPuebloPuerto RicanPuget Sound SalishRussianSalvadoranSamoanScandinavianScotch-IrishScottishSeminoleSenegaleseSerbianShoshoneSierra LeoneanSiouxSlavicSlovakSloveneSomaliSouth AfricanSouth AmericanSouth American IndianSoviet UnionSpaniardSpanishSpanish AmericanSpanish American IndianSri LankanSubsaharan AfricanSudaneseSwedishSwissSyrianTaiwaneseThaiTlingit-HaidaTohono O'OdhamTonganTrinidadian and TobagonianTsimshianTurkishU.S. Virgin IslanderUgandanUkrainianUruguayanUteVenezuelanVietnameseWelshWest IndianYakamaYaquiYugoslavianYumanYup'ikZimbabwean
Immigration
NonimmigrantsImmigrantsAfghanistanAfricaAlbaniaArgentinaArmeniaAsiaAustraliaAustriaBahamasBangladeshBarbadosBelarusBelgiumBelizeBoliviaBosnia and HerzegovinaBrazilBulgariaBurma/MyanmarCabo VerdeCambodiaCameroonCanadaCaribbeanCentral AmericaChileChinaColombiaCongoCosta RicaCroatiaCubaCzechoslovakiaDenmarkDominicaDominican RepublicEastern AfricaEastern AsiaEastern EuropeEcuadorEgyptEl SalvadorEnglandEritreaEthiopiaEuropeFijiFranceGermanyGhanaGreeceGrenadaGuatemalaGuyanaHaitiHondurasHong KongHungaryIndiaIndonesiaIranIraqIrelandIsraelItalyJamaicaJapanJordanKazakhstanKenyaKoreaKuwaitLaosLatin AmericaLatviaLebanonLiberiaLithuaniaMalaysiaMexicoMicronesiaMiddle AfricaMoldovaMoroccoNepalNetherlandsNicaraguaNigeriaNorth AmericaNorth MacedoniaNorthern AfricaNorthern EuropeNorwayOceaniaPakistanPanamaPeruPhilippinesPolandPortugalRomaniaRussiaSaudi ArabiaScotlandSenegalSerbiaSierra LeoneSingaporeSomaliaSouth AfricaSouth AmericaSouth Central AsiaSouth Eastern AsiaSouthern EuropeSpainSri LankaSt. Vincent and the GrenadinesSudanSwedenSwitzerlandSyriaTaiwanThailandTrinidad and TobagoTurkeyUgandaUkraineUruguayUzbekistanVenezuelaVietnamWest IndiesWestern AfricaWestern AsiaWestern EuropeYemenZaireZimbabweAzores
3 or more Vehicles in Household
Income
Poverty
Unemployment
Labor Participation
Family Structure
Vehicle Availability
Education Level
Disability

Romanian 3 or more Vehicles in Household
Fair

19.3%
3+ VEHICLES AVAILABLE
37.1/ 100
METRIC RATING
181st/ 347
METRIC RANK

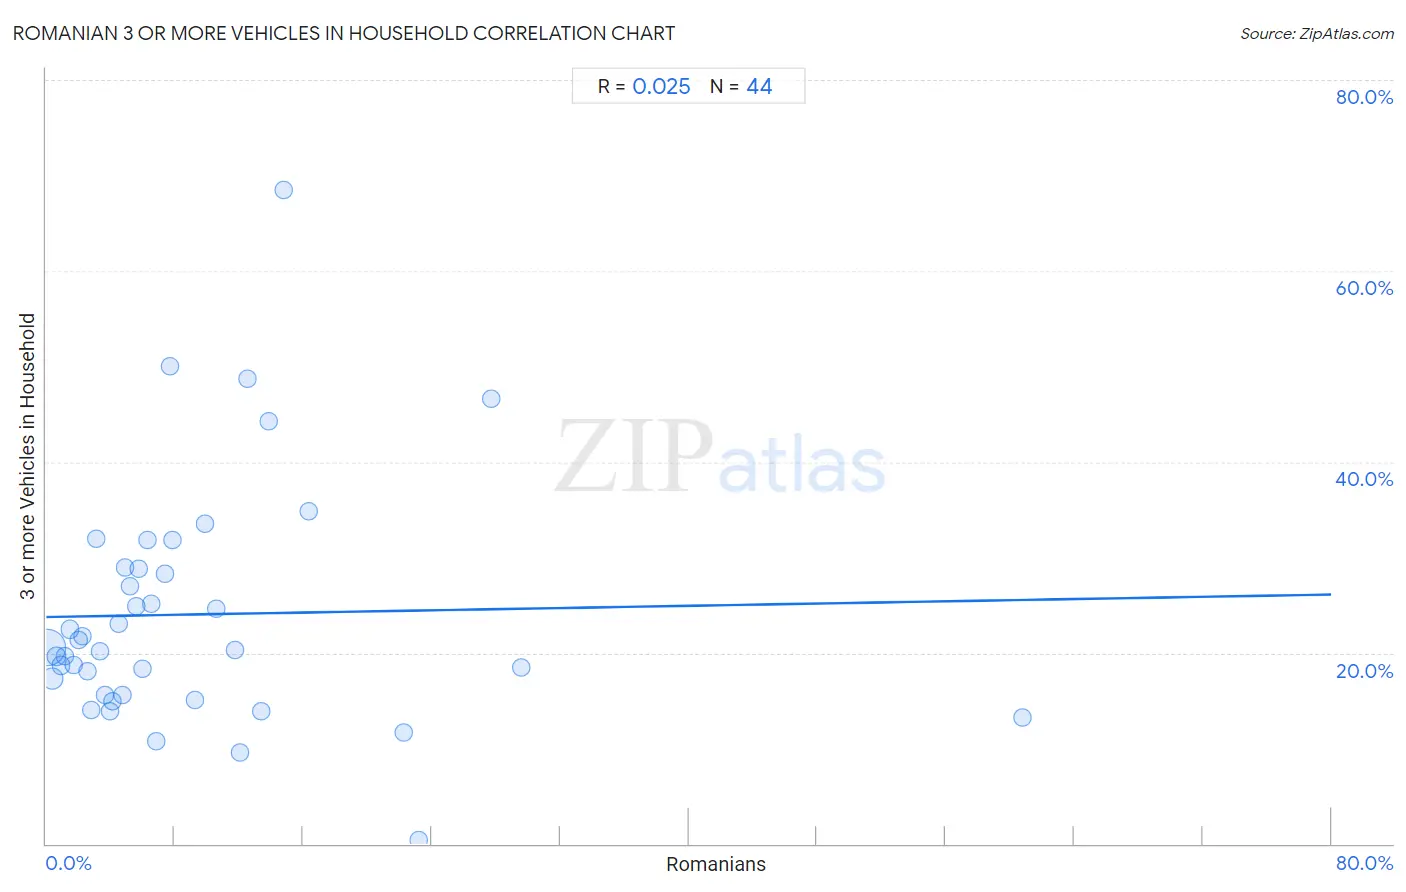
Romanian 3 or more Vehicles in Household Correlation Chart

The statistical analysis conducted on geographies consisting of 377,618,048 people shows no correlation between the proportion of Romanians and percentage of households with 3 or more vehicles available in the United States with a correlation coefficient (R) of 0.025 and weighted average of 19.3%. On average, for every 1% (one percent) increase in Romanians within a typical geography, there is an increase of 0.029% in percentage of households with 3 or more vehicles available.
Romanian 3 or more Vehicles in Household
It is essential to understand that the correlation between the percentage of Romanians and percentage of households with 3 or more vehicles available does not imply a direct cause-and-effect relationship. It remains uncertain whether the presence of Romanians influences an upward or downward trend in the level of percentage of households with 3 or more vehicles available within an area, or if Romanians simply ended up residing in those areas with higher or lower levels of percentage of households with 3 or more vehicles available due to other factors.

Demographics Similar to Romanians by 3 or more Vehicles in Household

In terms of 3 or more vehicles in household, the demographic groups most similar to Romanians are South African (19.3%, a difference of 0.030%), Cuban (19.3%, a difference of 0.040%), Cajun (19.3%, a difference of 0.090%), Latvian (19.3%, a difference of 0.11%), and Immigrants from South Central Asia (19.3%, a difference of 0.15%).
DemographicsRating | Rank3 or more Vehicles in Household
Immigrants from South Africa
50.0
/100
|
#174
Average
19.5%
Syrians
47.0
/100
|
#175
Average
19.5%
Iroquois
46.0
/100
|
#176
Average
19.4%
Immigrants from Peru
41.1
/100
|
#177
Average
19.4%
Immigrants from Syria
40.3
/100
|
#178
Average
19.4%
Immigrants from South Central Asia
38.9
/100
|
#179
Fair
19.3%
South Africans
37.5
/100
|
#180
Fair
19.3%
Romanians
37.1
/100
|
#181
Fair
19.3%
Cubans
36.6
/100
|
#182
Fair
19.3%
Cajuns
36.0
/100
|
#183
Fair
19.3%
Latvians
35.7
/100
|
#184
Fair
19.3%
Immigrants from Sri Lanka
30.7
/100
|
#185
Fair
19.2%
Immigrants from Sweden
29.0
/100
|
#186
Fair
19.2%
Immigrants from Hong Kong
28.3
/100
|
#187
Fair
19.2%
Immigrants from Kuwait
26.1
/100
|
#188
Fair
19.1%

Romanian 3 or more Vehicles in Household Correlation Summary

MeasurementRomanian Data3 or more Vehicles in Household Data
Minimum0.10%0.45%
Maximum60.8%68.5%
Range60.7%68.0%
Mean9.1%24.0%
Median5.9%20.5%
Interquartile 25% (IQ1)3.0%15.6%
Interquartile 75% (IQ3)11.9%28.9%
Interquartile Range (IQR)9.0%13.3%
Standard Deviation (Sample)10.7%12.5%
Standard Deviation (Population)10.5%12.4%

Correlation Details

Romanian PercentileSample Size3 or more Vehicles in Household
[
0.0%
-
0.5%
]
0.10%
284,420,85420.6%
[
0.0%
-
0.5%
]
0.36%
62,592,93417.3%
[
0.5%
-
1.0%
]
0.66%
15,545,41819.6%
[
0.5%
-
1.0%
]
0.93%
7,453,96118.7%
[
1.0%
-
1.5%
]
1.19%
3,347,09619.7%
[
1.0%
-
1.5%
]
1.46%
1,442,10522.5%
[
1.5%
-
2.0%
]
1.75%
927,31918.7%
[
2.0%
-
2.5%
]
2.02%
582,78921.3%
[
2.0%
-
2.5%
]
2.28%
341,55221.7%
[
2.5%
-
3.0%
]
2.53%
297,83218.1%
[
2.5%
-
3.0%
]
2.83%
217,72014.0%
[
3.0%
-
3.5%
]
3.09%
39,24731.9%
[
3.0%
-
3.5%
]
3.35%
120,66520.2%
[
3.5%
-
4.0%
]
3.63%
85,73915.6%
[
3.5%
-
4.0%
]
3.94%
64,91913.9%
[
4.0%
-
4.5%
]
4.13%
65,77415.0%
[
4.0%
-
4.5%
]
4.49%
7,82523.0%
[
4.5%
-
5.0%
]
4.78%
3,36815.6%
[
4.5%
-
5.0%
]
4.93%
3,89829.0%
[
5.0%
-
5.5%
]
5.22%
7,06527.0%
[
5.5%
-
6.0%
]
5.58%
3,56624.8%
[
5.5%
-
6.0%
]
5.79%
18,32328.9%
[
5.5%
-
6.0%
]
5.97%
4,83918.3%
[
6.0%
-
6.5%
]
6.30%
54031.8%
[
6.5%
-
7.0%
]
6.57%
4,90325.1%
[
6.5%
-
7.0%
]
6.84%
3,85810.7%
[
7.0%
-
7.5%
]
7.41%
37828.3%
[
7.5%
-
8.0%
]
7.69%
1350.0%
[
7.5%
-
8.0%
]
7.84%
5131.8%
[
9.0%
-
9.5%
]
9.30%
1,99015.1%
[
9.5%
-
10.0%
]
9.90%
3,58633.5%
[
10.5%
-
11.0%
]
10.55%
67324.7%
[
11.5%
-
12.0%
]
11.74%
42620.3%
[
12.0%
-
12.5%
]
12.10%
1,8859.6%
[
12.0%
-
12.5%
]
12.50%
4048.7%
[
13.0%
-
13.5%
]
13.36%
24713.8%
[
13.5%
-
14.0%
]
13.88%
35344.2%
[
14.5%
-
15.0%
]
14.75%
27868.5%
[
16.0%
-
16.5%
]
16.36%
22034.8%
[
22.0%
-
22.5%
]
22.22%
78311.6%
[
23.0%
-
23.5%
]
23.18%
9620.45%
[
27.5%
-
28.0%
]
27.70%
1,66846.6%
[
29.5%
-
30.0%
]
29.59%
9818.5%
[
60.5%
-
61.0%
]
60.76%
28813.3%