Pennsylvania German 3 or more Vehicles in Household
COMPARE
Pennsylvania German
Select to Compare
3 or more Vehicles in Household
Pennsylvania German 3 or more Vehicles in Household
22.3%
3+ VEHICLES AVAILABLE
100.0/ 100
METRIC RATING
57th/ 347
METRIC RANK
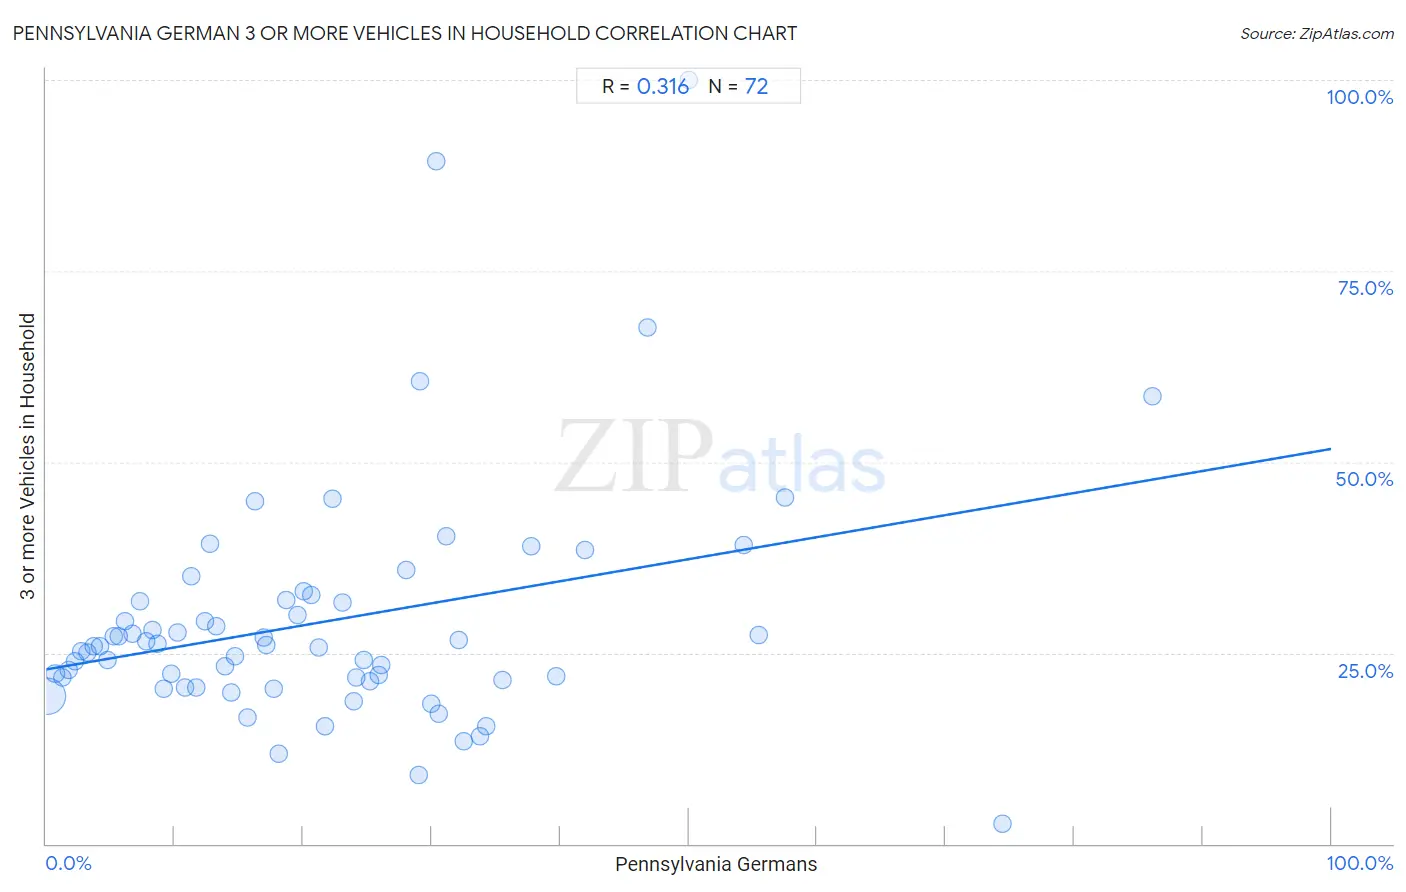
Pennsylvania German 3 or more Vehicles in Household Correlation Chart
The statistical analysis conducted on geographies consisting of 234,054,154 people shows a mild positive correlation between the proportion of Pennsylvania Germans and percentage of households with 3 or more vehicles available in the United States with a correlation coefficient (R) of 0.316 and weighted average of 22.3%. On average, for every 1% (one percent) increase in Pennsylvania Germans within a typical geography, there is an increase of 0.29% in percentage of households with 3 or more vehicles available.
It is essential to understand that the correlation between the percentage of Pennsylvania Germans and percentage of households with 3 or more vehicles available does not imply a direct cause-and-effect relationship. It remains uncertain whether the presence of Pennsylvania Germans influences an upward or downward trend in the level of percentage of households with 3 or more vehicles available within an area, or if Pennsylvania Germans simply ended up residing in those areas with higher or lower levels of percentage of households with 3 or more vehicles available due to other factors.
Demographics Similar to Pennsylvania Germans by 3 or more Vehicles in Household
In terms of 3 or more vehicles in household, the demographic groups most similar to Pennsylvania Germans are Spaniard (22.3%, a difference of 0.13%), Hispanic or Latino (22.4%, a difference of 0.16%), Immigrants from Laos (22.4%, a difference of 0.18%), Navajo (22.3%, a difference of 0.19%), and Finnish (22.3%, a difference of 0.28%).
| Demographics | Rating | Rank | 3 or more Vehicles in Household |
| Sioux | 100.0 /100 | #50 | Exceptional 22.6% |
| Whites/Caucasians | 100.0 /100 | #51 | Exceptional 22.6% |
| Welsh | 100.0 /100 | #52 | Exceptional 22.6% |
| Czechs | 100.0 /100 | #53 | Exceptional 22.5% |
| Crow | 100.0 /100 | #54 | Exceptional 22.5% |
| Immigrants from Laos | 100.0 /100 | #55 | Exceptional 22.4% |
| Hispanics or Latinos | 100.0 /100 | #56 | Exceptional 22.4% |
| Pennsylvania Germans | 100.0 /100 | #57 | Exceptional 22.3% |
| Spaniards | 100.0 /100 | #58 | Exceptional 22.3% |
| Navajo | 100.0 /100 | #59 | Exceptional 22.3% |
| Finns | 99.9 /100 | #60 | Exceptional 22.3% |
| Bhutanese | 99.9 /100 | #61 | Exceptional 22.2% |
| Fijians | 99.9 /100 | #62 | Exceptional 22.2% |
| Chickasaw | 99.9 /100 | #63 | Exceptional 22.2% |
| Immigrants from Taiwan | 99.9 /100 | #64 | Exceptional 22.1% |
Pennsylvania German 3 or more Vehicles in Household Correlation Summary
| Measurement | Pennsylvania German Data | 3 or more Vehicles in Household Data |
| Minimum | 0.058% | 2.6% |
| Maximum | 86.0% | 100.0% |
| Range | 86.0% | 97.4% |
| Mean | 21.7% | 29.1% |
| Median | 18.4% | 25.9% |
| Interquartile 25% (IQ1) | 8.9% | 21.4% |
| Interquartile 75% (IQ3) | 30.2% | 31.8% |
| Interquartile Range (IQR) | 21.3% | 10.4% |
| Standard Deviation (Sample) | 17.1% | 15.7% |
| Standard Deviation (Population) | 17.0% | 15.6% |
Correlation Details
| Pennsylvania German Percentile | Sample Size | 3 or more Vehicles in Household |
[ 0.0% - 0.5% ] 0.058% | 222,115,873 | 19.3% |
[ 0.5% - 1.0% ] 0.72% | 5,485,757 | 22.3% |
[ 1.0% - 1.5% ] 1.23% | 2,115,874 | 21.8% |
[ 1.5% - 2.0% ] 1.72% | 1,378,470 | 22.7% |
[ 2.0% - 2.5% ] 2.22% | 670,299 | 23.9% |
[ 2.5% - 3.0% ] 2.76% | 487,154 | 25.2% |
[ 3.0% - 3.5% ] 3.23% | 363,928 | 25.1% |
[ 3.5% - 4.0% ] 3.74% | 239,229 | 25.9% |
[ 4.0% - 4.5% ] 4.15% | 269,222 | 25.9% |
[ 4.5% - 5.0% ] 4.75% | 174,488 | 24.1% |
[ 5.0% - 5.5% ] 5.28% | 114,012 | 27.1% |
[ 5.5% - 6.0% ] 5.67% | 83,739 | 27.1% |
[ 6.0% - 6.5% ] 6.14% | 59,934 | 29.1% |
[ 6.5% - 7.0% ] 6.75% | 104,329 | 27.6% |
[ 7.0% - 7.5% ] 7.25% | 27,414 | 31.8% |
[ 7.5% - 8.0% ] 7.81% | 23,099 | 26.6% |
[ 8.0% - 8.5% ] 8.26% | 52,911 | 28.0% |
[ 8.5% - 9.0% ] 8.66% | 38,844 | 26.2% |
[ 9.0% - 9.5% ] 9.14% | 16,425 | 20.2% |
[ 9.5% - 10.0% ] 9.74% | 17,973 | 22.3% |
[ 10.0% - 10.5% ] 10.25% | 25,045 | 27.7% |
[ 10.5% - 11.0% ] 10.81% | 35,137 | 20.5% |
[ 11.0% - 11.5% ] 11.33% | 2,595 | 35.1% |
[ 11.5% - 12.0% ] 11.68% | 23,395 | 20.5% |
[ 12.0% - 12.5% ] 12.37% | 19,489 | 29.1% |
[ 12.5% - 13.0% ] 12.70% | 2,221 | 39.3% |
[ 13.0% - 13.5% ] 13.23% | 11,508 | 28.5% |
[ 13.5% - 14.0% ] 13.95% | 803 | 23.2% |
[ 14.0% - 14.5% ] 14.44% | 4,334 | 19.8% |
[ 14.5% - 15.0% ] 14.68% | 6,708 | 24.6% |
[ 15.5% - 16.0% ] 15.68% | 1,524 | 16.5% |
[ 16.0% - 16.5% ] 16.27% | 2,753 | 44.9% |
[ 16.5% - 17.0% ] 16.89% | 11,314 | 27.0% |
[ 17.0% - 17.5% ] 17.14% | 3,658 | 26.1% |
[ 17.5% - 18.0% ] 17.73% | 976 | 20.2% |
[ 18.0% - 18.5% ] 18.13% | 6,917 | 11.8% |
[ 18.5% - 19.0% ] 18.66% | 938 | 31.8% |
[ 19.5% - 20.0% ] 19.54% | 1,034 | 30.0% |
[ 20.0% - 20.5% ] 20.06% | 1,899 | 33.1% |
[ 20.5% - 21.0% ] 20.66% | 847 | 32.5% |
[ 21.0% - 21.5% ] 21.17% | 463 | 25.8% |
[ 21.5% - 22.0% ] 21.69% | 4,763 | 15.4% |
[ 22.0% - 22.5% ] 22.31% | 4,576 | 45.2% |
[ 23.0% - 23.5% ] 23.06% | 2,090 | 31.6% |
[ 23.5% - 24.0% ] 23.92% | 1,522 | 18.7% |
[ 24.0% - 24.5% ] 24.12% | 2,156 | 21.8% |
[ 24.5% - 25.0% ] 24.71% | 3,419 | 24.1% |
[ 25.0% - 25.5% ] 25.24% | 5,376 | 21.2% |
[ 25.5% - 26.0% ] 25.83% | 302 | 22.0% |
[ 26.0% - 26.5% ] 26.07% | 560 | 23.4% |
[ 28.0% - 28.5% ] 28.00% | 200 | 35.9% |
[ 28.5% - 29.0% ] 28.96% | 259 | 9.0% |
[ 29.0% - 29.5% ] 29.09% | 55 | 60.5% |
[ 29.5% - 30.0% ] 29.92% | 1,514 | 18.3% |
[ 30.0% - 30.5% ] 30.38% | 79 | 89.3% |
[ 30.5% - 31.0% ] 30.50% | 318 | 17.1% |
[ 31.0% - 31.5% ] 31.12% | 1,417 | 40.3% |
[ 32.0% - 32.5% ] 32.06% | 499 | 26.7% |
[ 32.5% - 33.0% ] 32.54% | 16,090 | 13.5% |
[ 33.5% - 34.0% ] 33.78% | 370 | 14.0% |
[ 34.0% - 34.5% ] 34.24% | 2,030 | 15.5% |
[ 35.0% - 35.5% ] 35.47% | 406 | 21.5% |
[ 37.5% - 38.0% ] 37.73% | 432 | 39.0% |
[ 39.5% - 40.0% ] 39.65% | 2,290 | 21.9% |
[ 41.5% - 42.0% ] 41.94% | 31 | 38.5% |
[ 46.5% - 47.0% ] 46.84% | 316 | 67.6% |
[ 50.0% - 50.5% ] 50.00% | 12 | 100.0% |
[ 54.0% - 54.5% ] 54.29% | 70 | 39.1% |
[ 55.0% - 55.5% ] 55.45% | 101 | 27.3% |
[ 57.5% - 58.0% ] 57.53% | 146 | 45.3% |
[ 74.0% - 74.5% ] 74.45% | 137 | 2.6% |
[ 86.0% - 86.5% ] 86.05% | 86 | 58.6% |