Mexican 3 or more Vehicles in Household
COMPARE
Mexican
Select to Compare
3 or more Vehicles in Household
Mexican 3 or more Vehicles in Household
24.7%
3+ VEHICLES AVAILABLE
100.0/ 100
METRIC RATING
13th/ 347
METRIC RANK
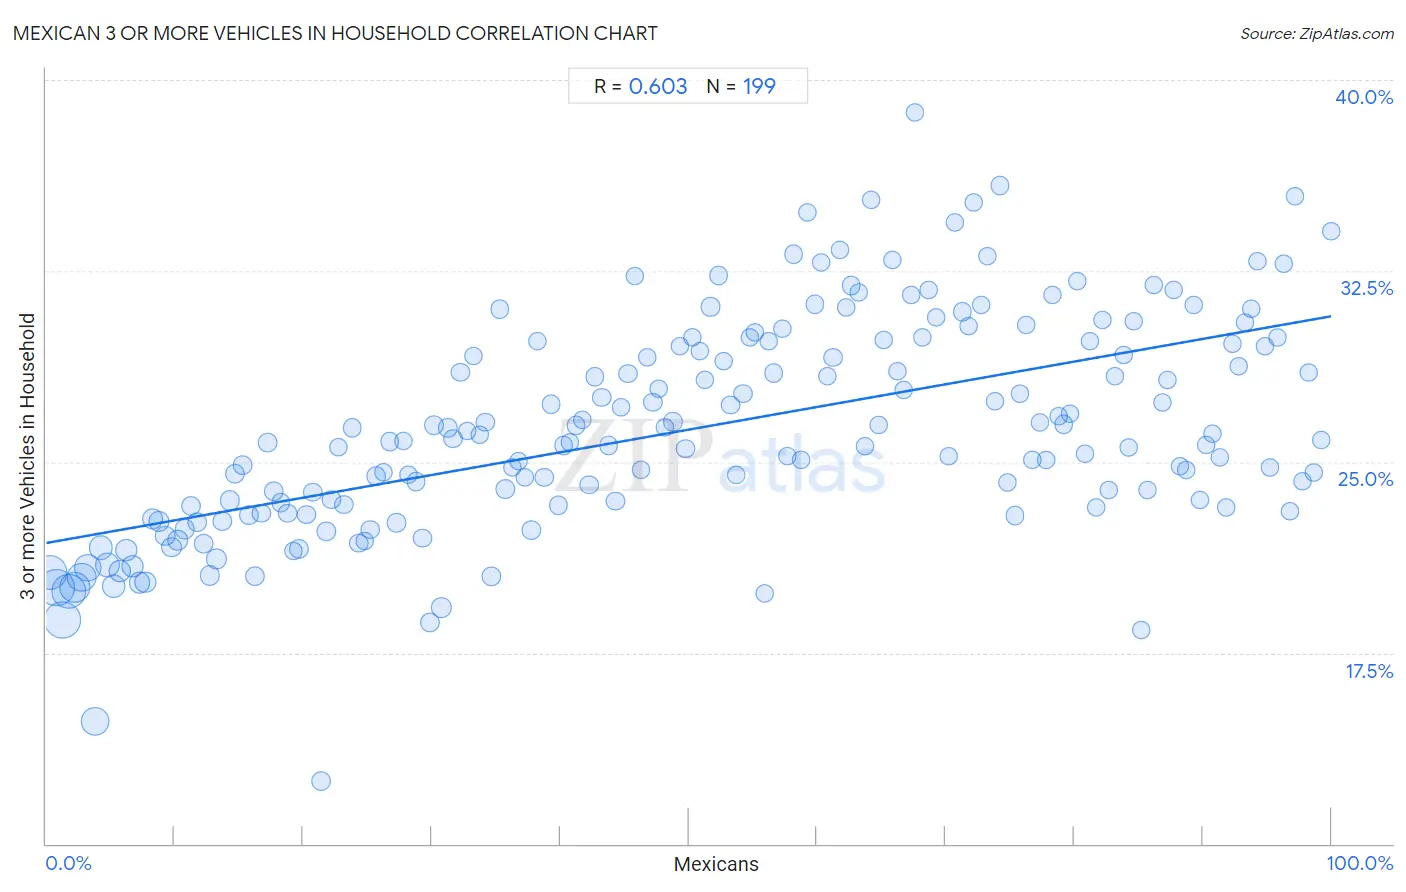
Mexican 3 or more Vehicles in Household Correlation Chart
The statistical analysis conducted on geographies consisting of 564,088,785 people shows a significant positive correlation between the proportion of Mexicans and percentage of households with 3 or more vehicles available in the United States with a correlation coefficient (R) of 0.603 and weighted average of 24.7%. On average, for every 1% (one percent) increase in Mexicans within a typical geography, there is an increase of 0.089% in percentage of households with 3 or more vehicles available.
It is essential to understand that the correlation between the percentage of Mexicans and percentage of households with 3 or more vehicles available does not imply a direct cause-and-effect relationship. It remains uncertain whether the presence of Mexicans influences an upward or downward trend in the level of percentage of households with 3 or more vehicles available within an area, or if Mexicans simply ended up residing in those areas with higher or lower levels of percentage of households with 3 or more vehicles available due to other factors.
Demographics Similar to Mexicans by 3 or more Vehicles in Household
In terms of 3 or more vehicles in household, the demographic groups most similar to Mexicans are Danish (24.7%, a difference of 0.080%), Immigrants from Mexico (24.6%, a difference of 0.44%), Shoshone (24.9%, a difference of 0.77%), Nepalese (24.9%, a difference of 0.87%), and Native Hawaiian (24.9%, a difference of 0.96%).
| Demographics | Rating | Rank | 3 or more Vehicles in Household |
| Immigrants from Fiji | 100.0 /100 | #6 | Exceptional 26.1% |
| Colville | 100.0 /100 | #7 | Exceptional 25.8% |
| Samoans | 100.0 /100 | #8 | Exceptional 25.0% |
| Native Hawaiians | 100.0 /100 | #9 | Exceptional 24.9% |
| Nepalese | 100.0 /100 | #10 | Exceptional 24.9% |
| Shoshone | 100.0 /100 | #11 | Exceptional 24.9% |
| Danes | 100.0 /100 | #12 | Exceptional 24.7% |
| Mexicans | 100.0 /100 | #13 | Exceptional 24.7% |
| Immigrants from Mexico | 100.0 /100 | #14 | Exceptional 24.6% |
| Hawaiians | 100.0 /100 | #15 | Exceptional 24.3% |
| Basques | 100.0 /100 | #16 | Exceptional 24.3% |
| Koreans | 100.0 /100 | #17 | Exceptional 24.1% |
| Norwegians | 100.0 /100 | #18 | Exceptional 23.9% |
| Chinese | 100.0 /100 | #19 | Exceptional 23.9% |
| Paiute | 100.0 /100 | #20 | Exceptional 23.8% |
Mexican 3 or more Vehicles in Household Correlation Summary
| Measurement | Mexican Data | 3 or more Vehicles in Household Data |
| Minimum | 0.28% | 12.5% |
| Maximum | 100.0% | 38.7% |
| Range | 99.7% | 26.3% |
| Mean | 49.9% | 26.3% |
| Median | 49.7% | 25.8% |
| Interquartile 25% (IQ1) | 24.8% | 23.2% |
| Interquartile 75% (IQ3) | 75.3% | 29.6% |
| Interquartile Range (IQR) | 50.6% | 6.4% |
| Standard Deviation (Sample) | 29.0% | 4.3% |
| Standard Deviation (Population) | 28.9% | 4.3% |
Correlation Details
| Mexican Percentile | Sample Size | 3 or more Vehicles in Household |
[ 0.0% - 0.5% ] 0.28% | 40,087,479 | 20.7% |
[ 0.5% - 1.0% ] 0.75% | 45,592,011 | 20.1% |
[ 1.0% - 1.5% ] 1.25% | 46,031,277 | 18.8% |
[ 1.5% - 2.0% ] 1.75% | 39,711,475 | 19.9% |
[ 2.0% - 2.5% ] 2.23% | 31,669,832 | 20.1% |
[ 2.5% - 3.0% ] 2.74% | 25,602,517 | 20.5% |
[ 3.0% - 3.5% ] 3.23% | 20,292,432 | 20.8% |
[ 3.5% - 4.0% ] 3.81% | 24,051,174 | 14.8% |
[ 4.0% - 4.5% ] 4.26% | 14,380,703 | 21.6% |
[ 4.5% - 5.0% ] 4.75% | 15,392,042 | 21.0% |
[ 5.0% - 5.5% ] 5.26% | 12,597,334 | 20.1% |
[ 5.5% - 6.0% ] 5.74% | 10,198,007 | 20.7% |
[ 6.0% - 6.5% ] 6.27% | 8,788,625 | 21.5% |
[ 6.5% - 7.0% ] 6.76% | 9,092,070 | 20.9% |
[ 7.0% - 7.5% ] 7.26% | 8,474,702 | 20.2% |
[ 7.5% - 8.0% ] 7.72% | 7,540,414 | 20.3% |
[ 8.0% - 8.5% ] 8.25% | 5,506,072 | 22.8% |
[ 8.5% - 9.0% ] 8.75% | 5,268,125 | 22.7% |
[ 9.0% - 9.5% ] 9.24% | 5,045,440 | 22.1% |
[ 9.5% - 10.0% ] 9.73% | 4,441,444 | 21.6% |
[ 10.0% - 10.5% ] 10.24% | 5,116,495 | 21.9% |
[ 10.5% - 11.0% ] 10.77% | 4,409,523 | 22.4% |
[ 11.0% - 11.5% ] 11.26% | 4,368,630 | 23.3% |
[ 11.5% - 12.0% ] 11.76% | 4,633,946 | 22.6% |
[ 12.0% - 12.5% ] 12.24% | 3,470,418 | 21.8% |
[ 12.5% - 13.0% ] 12.72% | 4,036,995 | 20.5% |
[ 13.0% - 13.5% ] 13.27% | 5,164,927 | 21.2% |
[ 13.5% - 14.0% ] 13.73% | 3,990,980 | 22.7% |
[ 14.0% - 14.5% ] 14.25% | 3,765,336 | 23.5% |
[ 14.5% - 15.0% ] 14.73% | 3,215,242 | 24.5% |
[ 15.0% - 15.5% ] 15.26% | 2,436,552 | 24.9% |
[ 15.5% - 16.0% ] 15.76% | 2,367,838 | 22.9% |
[ 16.0% - 16.5% ] 16.23% | 3,314,812 | 20.5% |
[ 16.5% - 17.0% ] 16.75% | 2,505,374 | 23.0% |
[ 17.0% - 17.5% ] 17.24% | 2,575,452 | 25.8% |
[ 17.5% - 18.0% ] 17.73% | 3,074,452 | 23.9% |
[ 18.0% - 18.5% ] 18.25% | 2,232,112 | 23.4% |
[ 18.5% - 19.0% ] 18.76% | 2,436,814 | 23.0% |
[ 19.0% - 19.5% ] 19.25% | 1,522,467 | 21.5% |
[ 19.5% - 20.0% ] 19.69% | 2,231,877 | 21.6% |
[ 20.0% - 20.5% ] 20.24% | 2,028,639 | 22.9% |
[ 20.5% - 21.0% ] 20.75% | 1,616,873 | 23.8% |
[ 21.0% - 21.5% ] 21.35% | 3,912,724 | 12.5% |
[ 21.5% - 22.0% ] 21.78% | 2,572,498 | 22.3% |
[ 22.0% - 22.5% ] 22.20% | 1,915,810 | 23.5% |
[ 22.5% - 23.0% ] 22.74% | 1,512,719 | 25.6% |
[ 23.0% - 23.5% ] 23.18% | 2,284,938 | 23.3% |
[ 23.5% - 24.0% ] 23.79% | 1,511,880 | 26.3% |
[ 24.0% - 24.5% ] 24.29% | 2,984,365 | 21.8% |
[ 24.5% - 25.0% ] 24.77% | 1,332,121 | 21.9% |
[ 25.0% - 25.5% ] 25.24% | 1,951,774 | 22.3% |
[ 25.5% - 26.0% ] 25.66% | 3,585,255 | 24.4% |
[ 26.0% - 26.5% ] 26.22% | 1,266,208 | 24.6% |
[ 26.5% - 27.0% ] 26.73% | 1,323,014 | 25.8% |
[ 27.0% - 27.5% ] 27.24% | 1,657,227 | 22.6% |
[ 27.5% - 28.0% ] 27.81% | 1,431,020 | 25.8% |
[ 28.0% - 28.5% ] 28.19% | 1,425,815 | 24.5% |
[ 28.5% - 29.0% ] 28.76% | 1,211,015 | 24.2% |
[ 29.0% - 29.5% ] 29.30% | 3,003,115 | 22.0% |
[ 29.5% - 30.0% ] 29.85% | 3,386,133 | 18.7% |
[ 30.0% - 30.5% ] 30.19% | 1,866,233 | 26.4% |
[ 30.5% - 31.0% ] 30.78% | 5,515,585 | 19.3% |
[ 31.0% - 31.5% ] 31.27% | 1,406,268 | 26.3% |
[ 31.5% - 32.0% ] 31.66% | 609,183 | 25.9% |
[ 32.0% - 32.5% ] 32.22% | 891,449 | 28.5% |
[ 32.5% - 33.0% ] 32.75% | 1,314,008 | 26.2% |
[ 33.0% - 33.5% ] 33.23% | 1,402,125 | 29.2% |
[ 33.5% - 34.0% ] 33.74% | 1,164,542 | 26.1% |
[ 34.0% - 34.5% ] 34.19% | 1,410,454 | 26.6% |
[ 34.5% - 35.0% ] 34.64% | 2,494,289 | 20.5% |
[ 35.0% - 35.5% ] 35.30% | 994,564 | 31.0% |
[ 35.5% - 36.0% ] 35.72% | 1,590,018 | 23.9% |
[ 36.0% - 36.5% ] 36.24% | 532,648 | 24.8% |
[ 36.5% - 37.0% ] 36.73% | 929,137 | 25.0% |
[ 37.0% - 37.5% ] 37.24% | 816,108 | 24.4% |
[ 37.5% - 38.0% ] 37.74% | 2,442,836 | 22.3% |
[ 38.0% - 38.5% ] 38.20% | 402,886 | 29.7% |
[ 38.5% - 39.0% ] 38.76% | 761,890 | 24.4% |
[ 39.0% - 39.5% ] 39.26% | 747,331 | 27.3% |
[ 39.5% - 40.0% ] 39.85% | 1,539,959 | 23.3% |
[ 40.0% - 40.5% ] 40.24% | 687,361 | 25.6% |
[ 40.5% - 41.0% ] 40.78% | 738,849 | 25.8% |
[ 41.0% - 41.5% ] 41.25% | 1,103,994 | 26.4% |
[ 41.5% - 42.0% ] 41.73% | 806,799 | 26.6% |
[ 42.0% - 42.5% ] 42.24% | 1,001,409 | 24.1% |
[ 42.5% - 43.0% ] 42.73% | 651,366 | 28.3% |
[ 43.0% - 43.5% ] 43.23% | 496,212 | 27.5% |
[ 43.5% - 44.0% ] 43.73% | 960,991 | 25.6% |
[ 44.0% - 44.5% ] 44.30% | 633,963 | 23.5% |
[ 44.5% - 45.0% ] 44.74% | 889,886 | 27.2% |
[ 45.0% - 45.5% ] 45.26% | 730,309 | 28.5% |
[ 45.5% - 46.0% ] 45.77% | 871,496 | 32.3% |
[ 46.0% - 46.5% ] 46.29% | 1,150,215 | 24.7% |
[ 46.5% - 47.0% ] 46.78% | 990,772 | 29.1% |
[ 47.0% - 47.5% ] 47.20% | 1,121,773 | 27.3% |
[ 47.5% - 48.0% ] 47.66% | 218,790 | 27.9% |
[ 48.0% - 48.5% ] 48.16% | 518,538 | 26.3% |
[ 48.5% - 49.0% ] 48.77% | 889,766 | 26.6% |
[ 49.0% - 49.5% ] 49.29% | 493,661 | 29.6% |
[ 49.5% - 50.0% ] 49.75% | 547,249 | 25.5% |
[ 50.0% - 50.5% ] 50.28% | 703,504 | 29.9% |
[ 50.5% - 51.0% ] 50.85% | 684,098 | 29.4% |
[ 51.0% - 51.5% ] 51.29% | 674,082 | 28.2% |
[ 51.5% - 52.0% ] 51.70% | 312,914 | 31.1% |
[ 52.0% - 52.5% ] 52.34% | 673,288 | 32.3% |
[ 52.5% - 53.0% ] 52.71% | 522,047 | 28.9% |
[ 53.0% - 53.5% ] 53.25% | 329,811 | 27.2% |
[ 53.5% - 54.0% ] 53.69% | 127,813 | 24.5% |
[ 54.0% - 54.5% ] 54.23% | 506,954 | 27.7% |
[ 54.5% - 55.0% ] 54.80% | 356,689 | 29.9% |
[ 55.0% - 55.5% ] 55.16% | 792,015 | 30.1% |
[ 55.5% - 56.0% ] 55.92% | 1,730,904 | 19.8% |
[ 56.0% - 56.5% ] 56.21% | 290,747 | 29.7% |
[ 56.5% - 57.0% ] 56.65% | 408,192 | 28.5% |
[ 57.0% - 57.5% ] 57.31% | 392,992 | 30.2% |
[ 57.5% - 58.0% ] 57.69% | 573,497 | 25.2% |
[ 58.0% - 58.5% ] 58.19% | 726,156 | 33.2% |
[ 58.5% - 59.0% ] 58.76% | 834,106 | 25.1% |
[ 59.0% - 59.5% ] 59.24% | 527,005 | 34.8% |
[ 59.5% - 60.0% ] 59.79% | 424,542 | 31.2% |
[ 60.0% - 60.5% ] 60.32% | 408,029 | 32.8% |
[ 60.5% - 61.0% ] 60.76% | 476,104 | 28.4% |
[ 61.0% - 61.5% ] 61.23% | 281,769 | 29.1% |
[ 61.5% - 62.0% ] 61.76% | 217,628 | 33.3% |
[ 62.0% - 62.5% ] 62.26% | 270,005 | 31.1% |
[ 62.5% - 63.0% ] 62.63% | 449,820 | 31.9% |
[ 63.0% - 63.5% ] 63.21% | 305,076 | 31.7% |
[ 63.5% - 64.0% ] 63.73% | 195,267 | 25.6% |
[ 64.0% - 64.5% ] 64.15% | 567,789 | 35.3% |
[ 64.5% - 65.0% ] 64.82% | 168,536 | 26.5% |
[ 65.0% - 65.5% ] 65.21% | 203,836 | 29.8% |
[ 65.5% - 66.0% ] 65.89% | 445,746 | 32.9% |
[ 66.0% - 66.5% ] 66.24% | 176,886 | 28.5% |
[ 66.5% - 67.0% ] 66.71% | 296,860 | 27.8% |
[ 67.0% - 67.5% ] 67.29% | 307,379 | 31.6% |
[ 67.5% - 68.0% ] 67.62% | 344,341 | 38.7% |
[ 68.0% - 68.5% ] 68.21% | 466,331 | 29.9% |
[ 68.5% - 69.0% ] 68.71% | 210,860 | 31.8% |
[ 69.0% - 69.5% ] 69.26% | 492,465 | 30.7% |
[ 70.0% - 70.5% ] 70.20% | 224,662 | 25.2% |
[ 70.5% - 71.0% ] 70.71% | 504,353 | 34.4% |
[ 71.0% - 71.5% ] 71.26% | 545,003 | 30.9% |
[ 71.5% - 72.0% ] 71.75% | 581,760 | 30.3% |
[ 72.0% - 72.5% ] 72.17% | 193,763 | 35.2% |
[ 72.5% - 73.0% ] 72.78% | 385,758 | 31.2% |
[ 73.0% - 73.5% ] 73.22% | 405,058 | 33.1% |
[ 73.5% - 74.0% ] 73.79% | 190,042 | 27.4% |
[ 74.0% - 74.5% ] 74.21% | 397,460 | 35.9% |
[ 74.5% - 75.0% ] 74.76% | 190,337 | 24.2% |
[ 75.0% - 75.5% ] 75.34% | 392,104 | 22.9% |
[ 75.5% - 76.0% ] 75.81% | 240,043 | 27.7% |
[ 76.0% - 76.5% ] 76.29% | 237,471 | 30.4% |
[ 76.5% - 77.0% ] 76.71% | 855,780 | 25.1% |
[ 77.0% - 77.5% ] 77.31% | 383,451 | 26.6% |
[ 77.5% - 78.0% ] 77.85% | 198,774 | 25.1% |
[ 78.0% - 78.5% ] 78.30% | 148,958 | 31.5% |
[ 78.5% - 79.0% ] 78.83% | 271,829 | 26.8% |
[ 79.0% - 79.5% ] 79.22% | 295,581 | 26.5% |
[ 79.5% - 80.0% ] 79.62% | 121,906 | 26.9% |
[ 80.0% - 80.5% ] 80.24% | 673,592 | 32.1% |
[ 80.5% - 81.0% ] 80.81% | 104,614 | 25.3% |
[ 81.0% - 81.5% ] 81.18% | 325,064 | 29.7% |
[ 81.5% - 82.0% ] 81.74% | 357,068 | 23.2% |
[ 82.0% - 82.5% ] 82.18% | 191,421 | 30.6% |
[ 82.5% - 83.0% ] 82.66% | 105,641 | 23.9% |
[ 83.0% - 83.5% ] 83.15% | 265,359 | 28.4% |
[ 83.5% - 84.0% ] 83.84% | 210,058 | 29.2% |
[ 84.0% - 84.5% ] 84.26% | 285,886 | 25.6% |
[ 84.5% - 85.0% ] 84.67% | 77,718 | 30.5% |
[ 85.0% - 85.5% ] 85.20% | 80,600 | 18.4% |
[ 85.5% - 86.0% ] 85.74% | 23,865 | 23.9% |
[ 86.0% - 86.5% ] 86.16% | 108,513 | 31.9% |
[ 86.5% - 87.0% ] 86.85% | 169,500 | 27.3% |
[ 87.0% - 87.5% ] 87.27% | 246,734 | 28.2% |
[ 87.5% - 88.0% ] 87.70% | 229,461 | 31.8% |
[ 88.0% - 88.5% ] 88.19% | 132,543 | 24.8% |
[ 88.5% - 89.0% ] 88.74% | 80,081 | 24.7% |
[ 89.0% - 89.5% ] 89.27% | 143,906 | 31.1% |
[ 89.5% - 90.0% ] 89.81% | 318,424 | 23.5% |
[ 90.0% - 90.5% ] 90.22% | 360,166 | 25.7% |
[ 90.5% - 91.0% ] 90.73% | 198,315 | 26.1% |
[ 91.0% - 91.5% ] 91.34% | 514,030 | 25.2% |
[ 91.5% - 92.0% ] 91.78% | 292,897 | 23.2% |
[ 92.0% - 92.5% ] 92.33% | 53,933 | 29.6% |
[ 92.5% - 93.0% ] 92.78% | 178,418 | 28.7% |
[ 93.0% - 93.5% ] 93.28% | 94,969 | 30.5% |
[ 93.5% - 94.0% ] 93.77% | 99,641 | 31.0% |
[ 94.0% - 94.5% ] 94.27% | 178,570 | 32.9% |
[ 94.5% - 95.0% ] 94.80% | 121,556 | 29.5% |
[ 95.0% - 95.5% ] 95.26% | 75,709 | 24.8% |
[ 95.5% - 96.0% ] 95.84% | 24,421 | 29.9% |
[ 96.0% - 96.5% ] 96.29% | 28,016 | 32.8% |
[ 96.5% - 97.0% ] 96.77% | 27,923 | 23.0% |
[ 97.0% - 97.5% ] 97.21% | 22,835 | 35.4% |
[ 97.5% - 98.0% ] 97.76% | 41,842 | 24.2% |
[ 98.0% - 98.5% ] 98.25% | 19,383 | 28.5% |
[ 98.5% - 99.0% ] 98.66% | 27,768 | 24.6% |
[ 99.0% - 99.5% ] 99.18% | 16,801 | 25.8% |
[ 99.5% - 100.0% ] 99.95% | 59,896 | 34.1% |