White/Caucasian Male Unemployment
COMPARE
White/Caucasian
Select to Compare
Male Unemployment
White/Caucasian Male Unemployment
5.0%
UNEMPLOYMENT | MALES
97.3/ 100
METRIC RATING
70th/ 347
METRIC RANK
White/Caucasian Male Unemployment Correlation Chart
The statistical analysis conducted on geographies consisting of 569,852,701 people shows a very strong negative correlation between the proportion of Whites/Caucasians and unemployment rate among males in the United States with a correlation coefficient (R) of -0.854 and weighted average of 5.0%. On average, for every 1% (one percent) increase in Whites/Caucasians within a typical geography, there is a decrease of 0.069% in unemployment rate among males.
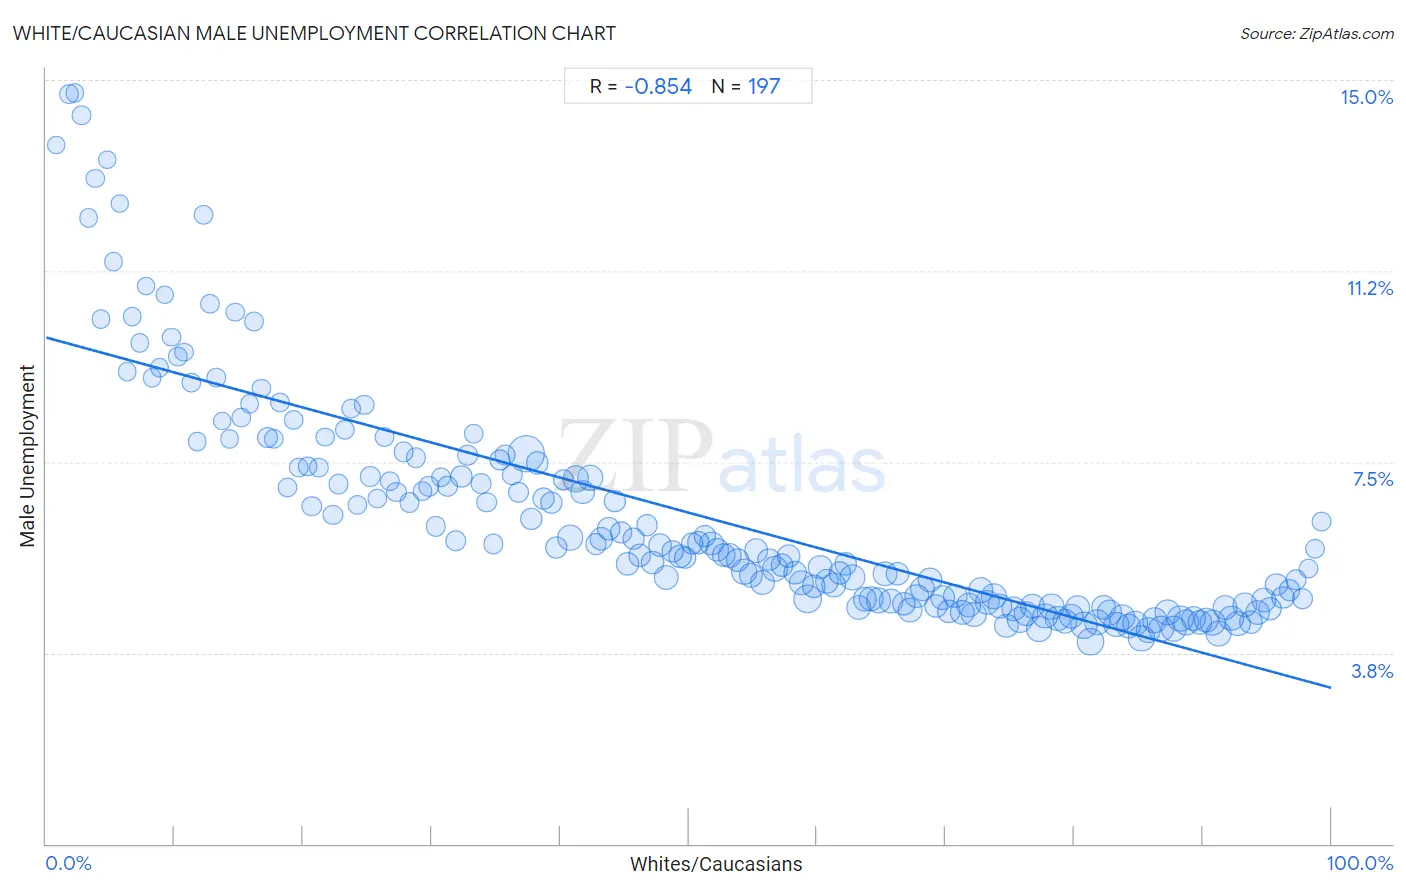
It is essential to understand that the correlation between the percentage of Whites/Caucasians and unemployment rate among males does not imply a direct cause-and-effect relationship. It remains uncertain whether the presence of Whites/Caucasians influences an upward or downward trend in the level of unemployment rate among males within an area, or if Whites/Caucasians simply ended up residing in those areas with higher or lower levels of unemployment rate among males due to other factors.
Demographics Similar to Whites/Caucasians by Male Unemployment
In terms of male unemployment, the demographic groups most similar to Whites/Caucasians are New Zealander (5.0%, a difference of 0.020%), Immigrants from Sweden (5.0%, a difference of 0.050%), Australian (5.0%, a difference of 0.080%), Immigrants from Canada (5.0%, a difference of 0.090%), and Immigrants from South Africa (5.0%, a difference of 0.090%).
| Demographics | Rating | Rank | Male Unemployment |
| Eastern Europeans | 97.9 /100 | #63 | Exceptional 5.0% |
| Celtics | 97.8 /100 | #64 | Exceptional 5.0% |
| Icelanders | 97.6 /100 | #65 | Exceptional 5.0% |
| Finns | 97.5 /100 | #66 | Exceptional 5.0% |
| Immigrants from Canada | 97.5 /100 | #67 | Exceptional 5.0% |
| Australians | 97.4 /100 | #68 | Exceptional 5.0% |
| Immigrants from Sweden | 97.4 /100 | #69 | Exceptional 5.0% |
| Whites/Caucasians | 97.3 /100 | #70 | Exceptional 5.0% |
| New Zealanders | 97.3 /100 | #71 | Exceptional 5.0% |
| Immigrants from South Africa | 97.1 /100 | #72 | Exceptional 5.0% |
| Greeks | 97.0 /100 | #73 | Exceptional 5.0% |
| Immigrants from North America | 96.9 /100 | #74 | Exceptional 5.0% |
| Assyrians/Chaldeans/Syriacs | 96.9 /100 | #75 | Exceptional 5.0% |
| Immigrants from Sudan | 96.5 /100 | #76 | Exceptional 5.0% |
| Iranians | 96.4 /100 | #77 | Exceptional 5.0% |
White/Caucasian Male Unemployment Correlation Summary
| Measurement | White/Caucasian Data | Male Unemployment Data |
| Minimum | 0.78% | 4.0% |
| Maximum | 99.2% | 14.7% |
| Range | 98.5% | 10.8% |
| Mean | 50.2% | 6.5% |
| Median | 50.3% | 5.8% |
| Interquartile 25% (IQ1) | 25.5% | 4.7% |
| Interquartile 75% (IQ3) | 75.0% | 7.4% |
| Interquartile Range (IQR) | 49.5% | 2.7% |
| Standard Deviation (Sample) | 28.5% | 2.3% |
| Standard Deviation (Population) | 28.4% | 2.3% |
Correlation Details
| White/Caucasian Percentile | Sample Size | Male Unemployment |
[ 0.5% - 1.0% ] 0.78% | 66,177 | 13.7% |
[ 1.5% - 2.0% ] 1.77% | 463,608 | 14.7% |
[ 2.0% - 2.5% ] 2.21% | 309,299 | 14.7% |
[ 2.5% - 3.0% ] 2.76% | 531,587 | 14.3% |
[ 3.0% - 3.5% ] 3.26% | 346,598 | 12.3% |
[ 3.5% - 4.0% ] 3.80% | 516,440 | 13.1% |
[ 4.0% - 4.5% ] 4.25% | 458,372 | 10.3% |
[ 4.5% - 5.0% ] 4.75% | 429,226 | 13.4% |
[ 5.0% - 5.5% ] 5.23% | 425,489 | 11.4% |
[ 5.5% - 6.0% ] 5.75% | 359,924 | 12.6% |
[ 6.0% - 6.5% ] 6.27% | 449,183 | 9.3% |
[ 6.5% - 7.0% ] 6.68% | 427,986 | 10.3% |
[ 7.0% - 7.5% ] 7.30% | 354,910 | 9.8% |
[ 7.5% - 8.0% ] 7.78% | 340,295 | 11.0% |
[ 8.0% - 8.5% ] 8.24% | 571,677 | 9.1% |
[ 8.5% - 9.0% ] 8.81% | 667,682 | 9.3% |
[ 9.0% - 9.5% ] 9.25% | 384,693 | 10.8% |
[ 9.5% - 10.0% ] 9.74% | 486,612 | 10.0% |
[ 10.0% - 10.5% ] 10.22% | 439,922 | 9.6% |
[ 10.5% - 11.0% ] 10.73% | 505,661 | 9.7% |
[ 11.0% - 11.5% ] 11.28% | 724,656 | 9.0% |
[ 11.5% - 12.0% ] 11.75% | 471,131 | 7.9% |
[ 12.0% - 12.5% ] 12.21% | 1,175,096 | 12.4% |
[ 12.5% - 13.0% ] 12.75% | 902,468 | 10.6% |
[ 13.0% - 13.5% ] 13.27% | 795,335 | 9.1% |
[ 13.5% - 14.0% ] 13.70% | 433,309 | 8.3% |
[ 14.0% - 14.5% ] 14.27% | 703,761 | 8.0% |
[ 14.5% - 15.0% ] 14.71% | 507,132 | 10.4% |
[ 15.0% - 15.5% ] 15.17% | 873,948 | 8.4% |
[ 15.5% - 16.0% ] 15.81% | 703,760 | 8.6% |
[ 16.0% - 16.5% ] 16.15% | 544,841 | 10.3% |
[ 16.5% - 17.0% ] 16.76% | 674,627 | 8.9% |
[ 17.0% - 17.5% ] 17.25% | 1,686,662 | 8.0% |
[ 17.5% - 18.0% ] 17.71% | 876,550 | 7.9% |
[ 18.0% - 18.5% ] 18.21% | 915,326 | 8.7% |
[ 18.5% - 19.0% ] 18.75% | 949,374 | 7.0% |
[ 19.0% - 19.5% ] 19.26% | 997,473 | 8.3% |
[ 19.5% - 20.0% ] 19.69% | 915,056 | 7.4% |
[ 20.0% - 20.5% ] 20.31% | 749,850 | 7.4% |
[ 20.5% - 21.0% ] 20.67% | 982,638 | 6.6% |
[ 21.0% - 21.5% ] 21.23% | 739,814 | 7.4% |
[ 21.5% - 22.0% ] 21.70% | 681,965 | 8.0% |
[ 22.0% - 22.5% ] 22.31% | 1,092,309 | 6.5% |
[ 22.5% - 23.0% ] 22.71% | 1,269,262 | 7.1% |
[ 23.0% - 23.5% ] 23.23% | 1,189,514 | 8.1% |
[ 23.5% - 24.0% ] 23.75% | 1,058,160 | 8.5% |
[ 24.0% - 24.5% ] 24.24% | 1,077,996 | 6.7% |
[ 24.5% - 25.0% ] 24.75% | 1,106,802 | 8.6% |
[ 25.0% - 25.5% ] 25.23% | 1,371,672 | 7.2% |
[ 25.5% - 26.0% ] 25.75% | 1,158,597 | 6.8% |
[ 26.0% - 26.5% ] 26.33% | 1,589,806 | 8.0% |
[ 26.5% - 27.0% ] 26.74% | 1,053,948 | 7.1% |
[ 27.0% - 27.5% ] 27.26% | 1,459,954 | 6.9% |
[ 27.5% - 28.0% ] 27.80% | 1,020,214 | 7.7% |
[ 28.0% - 28.5% ] 28.27% | 1,650,961 | 6.7% |
[ 28.5% - 29.0% ] 28.77% | 1,405,668 | 7.6% |
[ 29.0% - 29.5% ] 29.28% | 982,879 | 6.9% |
[ 29.5% - 30.0% ] 29.74% | 1,620,119 | 7.0% |
[ 30.0% - 30.5% ] 30.32% | 1,522,057 | 6.2% |
[ 30.5% - 31.0% ] 30.75% | 1,171,665 | 7.2% |
[ 31.0% - 31.5% ] 31.24% | 1,704,414 | 7.0% |
[ 31.5% - 32.0% ] 31.87% | 2,364,714 | 5.9% |
[ 32.0% - 32.5% ] 32.29% | 2,332,431 | 7.2% |
[ 32.5% - 33.0% ] 32.77% | 1,586,440 | 7.6% |
[ 33.0% - 33.5% ] 33.27% | 946,853 | 8.0% |
[ 33.5% - 34.0% ] 33.82% | 1,883,855 | 7.1% |
[ 34.0% - 34.5% ] 34.27% | 1,165,781 | 6.7% |
[ 34.5% - 35.0% ] 34.79% | 1,427,448 | 5.9% |
[ 35.0% - 35.5% ] 35.27% | 1,816,823 | 7.5% |
[ 35.5% - 36.0% ] 35.74% | 1,659,158 | 7.6% |
[ 36.0% - 36.5% ] 36.25% | 1,961,847 | 7.2% |
[ 36.5% - 37.0% ] 36.75% | 2,018,062 | 6.9% |
[ 37.0% - 37.5% ] 37.37% | 12,677,130 | 7.7% |
[ 37.5% - 38.0% ] 37.71% | 2,473,939 | 6.4% |
[ 38.0% - 38.5% ] 38.24% | 2,875,745 | 7.5% |
[ 38.5% - 39.0% ] 38.72% | 2,808,637 | 6.8% |
[ 39.0% - 39.5% ] 39.28% | 2,397,194 | 6.7% |
[ 39.5% - 40.0% ] 39.72% | 2,512,225 | 5.8% |
[ 40.0% - 40.5% ] 40.24% | 1,990,902 | 7.1% |
[ 40.5% - 41.0% ] 40.78% | 4,855,575 | 6.0% |
[ 41.0% - 41.5% ] 41.21% | 5,710,276 | 7.2% |
[ 41.5% - 42.0% ] 41.77% | 4,017,196 | 6.9% |
[ 42.0% - 42.5% ] 42.32% | 4,840,719 | 7.2% |
[ 42.5% - 43.0% ] 42.76% | 2,118,203 | 5.9% |
[ 43.0% - 43.5% ] 43.19% | 3,410,048 | 6.0% |
[ 43.5% - 44.0% ] 43.79% | 3,458,193 | 6.2% |
[ 44.0% - 44.5% ] 44.24% | 2,759,173 | 6.7% |
[ 44.5% - 45.0% ] 44.74% | 2,713,750 | 6.1% |
[ 45.0% - 45.5% ] 45.27% | 3,288,941 | 5.5% |
[ 45.5% - 46.0% ] 45.71% | 2,759,887 | 6.0% |
[ 46.0% - 46.5% ] 46.21% | 2,970,590 | 5.7% |
[ 46.5% - 47.0% ] 46.77% | 2,365,953 | 6.3% |
[ 47.0% - 47.5% ] 47.21% | 3,328,542 | 5.5% |
[ 47.5% - 48.0% ] 47.75% | 3,345,614 | 5.9% |
[ 48.0% - 48.5% ] 48.24% | 4,292,111 | 5.2% |
[ 48.5% - 49.0% ] 48.73% | 2,382,682 | 5.7% |
[ 49.0% - 49.5% ] 49.29% | 3,317,784 | 5.7% |
[ 49.5% - 50.0% ] 49.74% | 2,462,092 | 5.6% |
[ 50.0% - 50.5% ] 50.26% | 2,931,661 | 5.9% |
[ 50.5% - 51.0% ] 50.75% | 3,177,804 | 5.9% |
[ 51.0% - 51.5% ] 51.23% | 2,795,286 | 6.0% |
[ 51.5% - 52.0% ] 51.79% | 3,761,027 | 5.9% |
[ 52.0% - 52.5% ] 52.20% | 3,770,331 | 5.8% |
[ 52.5% - 53.0% ] 52.76% | 3,411,999 | 5.7% |
[ 53.0% - 53.5% ] 53.23% | 3,637,450 | 5.7% |
[ 53.5% - 54.0% ] 53.78% | 3,193,145 | 5.6% |
[ 54.0% - 54.5% ] 54.32% | 4,543,024 | 5.3% |
[ 54.5% - 55.0% ] 54.82% | 3,863,786 | 5.3% |
[ 55.0% - 55.5% ] 55.28% | 3,480,567 | 5.8% |
[ 55.5% - 56.0% ] 55.75% | 4,294,359 | 5.1% |
[ 56.0% - 56.5% ] 56.24% | 3,094,740 | 5.6% |
[ 56.5% - 57.0% ] 56.71% | 5,129,697 | 5.4% |
[ 57.0% - 57.5% ] 57.25% | 3,191,778 | 5.5% |
[ 57.5% - 58.0% ] 57.74% | 3,614,509 | 5.6% |
[ 58.0% - 58.5% ] 58.26% | 3,200,532 | 5.3% |
[ 58.5% - 59.0% ] 58.75% | 3,996,968 | 5.1% |
[ 59.0% - 59.5% ] 59.26% | 6,589,409 | 4.8% |
[ 59.5% - 60.0% ] 59.75% | 3,379,687 | 5.1% |
[ 60.0% - 60.5% ] 60.24% | 4,038,377 | 5.4% |
[ 60.5% - 61.0% ] 60.76% | 4,195,151 | 5.2% |
[ 61.0% - 61.5% ] 61.31% | 4,231,806 | 5.1% |
[ 61.5% - 62.0% ] 61.77% | 2,818,871 | 5.3% |
[ 62.0% - 62.5% ] 62.23% | 3,245,548 | 5.5% |
[ 62.5% - 63.0% ] 62.76% | 5,245,172 | 5.2% |
[ 63.0% - 63.5% ] 63.24% | 4,317,278 | 4.6% |
[ 63.5% - 64.0% ] 63.72% | 3,606,024 | 4.8% |
[ 64.0% - 64.5% ] 64.23% | 4,300,935 | 4.8% |
[ 64.5% - 65.0% ] 64.76% | 4,605,022 | 4.8% |
[ 65.0% - 65.5% ] 65.30% | 4,168,897 | 5.3% |
[ 65.5% - 66.0% ] 65.73% | 4,508,311 | 4.8% |
[ 66.0% - 66.5% ] 66.26% | 3,457,157 | 5.3% |
[ 66.5% - 67.0% ] 66.78% | 3,306,275 | 4.7% |
[ 67.0% - 67.5% ] 67.25% | 4,158,012 | 4.6% |
[ 67.5% - 68.0% ] 67.75% | 3,638,413 | 4.9% |
[ 68.0% - 68.5% ] 68.22% | 4,309,633 | 5.0% |
[ 68.5% - 69.0% ] 68.77% | 4,307,322 | 5.2% |
[ 69.0% - 69.5% ] 69.23% | 3,699,113 | 4.7% |
[ 69.5% - 70.0% ] 69.76% | 4,122,715 | 4.8% |
[ 70.0% - 70.5% ] 70.24% | 3,277,009 | 4.6% |
[ 70.5% - 71.0% ] 70.73% | 3,775,950 | 4.9% |
[ 71.0% - 71.5% ] 71.27% | 4,476,570 | 4.5% |
[ 71.5% - 72.0% ] 71.76% | 4,252,976 | 4.7% |
[ 72.0% - 72.5% ] 72.23% | 5,007,250 | 4.5% |
[ 72.5% - 73.0% ] 72.72% | 4,902,503 | 5.0% |
[ 73.0% - 73.5% ] 73.26% | 4,499,724 | 4.7% |
[ 73.5% - 74.0% ] 73.74% | 5,030,475 | 4.9% |
[ 74.0% - 74.5% ] 74.24% | 4,431,997 | 4.7% |
[ 74.5% - 75.0% ] 74.75% | 4,006,537 | 4.3% |
[ 75.0% - 75.5% ] 75.27% | 4,133,034 | 4.6% |
[ 75.5% - 76.0% ] 75.73% | 5,275,434 | 4.4% |
[ 76.0% - 76.5% ] 76.24% | 4,441,963 | 4.5% |
[ 76.5% - 77.0% ] 76.75% | 4,352,756 | 4.7% |
[ 77.0% - 77.5% ] 77.25% | 4,731,244 | 4.2% |
[ 77.5% - 78.0% ] 77.75% | 4,661,343 | 4.5% |
[ 78.0% - 78.5% ] 78.25% | 4,681,750 | 4.7% |
[ 78.5% - 79.0% ] 78.74% | 4,701,901 | 4.4% |
[ 79.0% - 79.5% ] 79.24% | 4,292,420 | 4.4% |
[ 79.5% - 80.0% ] 79.75% | 4,195,594 | 4.5% |
[ 80.0% - 80.5% ] 80.25% | 4,115,821 | 4.6% |
[ 80.5% - 81.0% ] 80.75% | 5,531,418 | 4.3% |
[ 81.0% - 81.5% ] 81.26% | 5,255,265 | 4.0% |
[ 81.5% - 82.0% ] 81.77% | 5,530,949 | 4.4% |
[ 82.0% - 82.5% ] 82.25% | 4,426,843 | 4.6% |
[ 82.5% - 83.0% ] 82.75% | 4,949,052 | 4.5% |
[ 83.0% - 83.5% ] 83.25% | 4,971,131 | 4.3% |
[ 83.5% - 84.0% ] 83.75% | 5,265,550 | 4.4% |
[ 84.0% - 84.5% ] 84.25% | 4,597,857 | 4.3% |
[ 84.5% - 85.0% ] 84.75% | 4,913,798 | 4.3% |
[ 85.0% - 85.5% ] 85.23% | 5,625,390 | 4.0% |
[ 85.5% - 86.0% ] 85.76% | 4,970,453 | 4.2% |
[ 86.0% - 86.5% ] 86.25% | 4,740,924 | 4.4% |
[ 86.5% - 87.0% ] 86.74% | 5,261,105 | 4.2% |
[ 87.0% - 87.5% ] 87.26% | 5,192,666 | 4.5% |
[ 87.5% - 88.0% ] 87.75% | 5,138,854 | 4.2% |
[ 88.0% - 88.5% ] 88.26% | 5,352,654 | 4.4% |
[ 88.5% - 89.0% ] 88.75% | 5,201,757 | 4.3% |
[ 89.0% - 89.5% ] 89.25% | 4,583,255 | 4.4% |
[ 89.5% - 90.0% ] 89.74% | 4,398,062 | 4.3% |
[ 90.0% - 90.5% ] 90.25% | 4,152,123 | 4.4% |
[ 90.5% - 91.0% ] 90.76% | 4,977,471 | 4.3% |
[ 91.0% - 91.5% ] 91.25% | 5,366,221 | 4.1% |
[ 91.5% - 92.0% ] 91.74% | 4,219,707 | 4.6% |
[ 92.0% - 92.5% ] 92.24% | 5,005,525 | 4.4% |
[ 92.5% - 93.0% ] 92.75% | 4,604,798 | 4.3% |
[ 93.0% - 93.5% ] 93.24% | 4,455,492 | 4.7% |
[ 93.5% - 94.0% ] 93.75% | 3,910,407 | 4.4% |
[ 94.0% - 94.5% ] 94.25% | 4,219,639 | 4.5% |
[ 94.5% - 95.0% ] 94.75% | 4,134,276 | 4.8% |
[ 95.0% - 95.5% ] 95.26% | 3,466,276 | 4.6% |
[ 95.5% - 96.0% ] 95.76% | 3,141,269 | 5.1% |
[ 96.0% - 96.5% ] 96.25% | 2,687,176 | 4.8% |
[ 96.5% - 97.0% ] 96.75% | 2,324,044 | 5.0% |
[ 97.0% - 97.5% ] 97.25% | 2,010,551 | 5.2% |
[ 97.5% - 98.0% ] 97.74% | 1,762,849 | 4.8% |
[ 98.0% - 98.5% ] 98.25% | 1,198,235 | 5.4% |
[ 98.5% - 99.0% ] 98.73% | 886,850 | 5.8% |
[ 99.0% - 99.5% ] 99.24% | 498,144 | 6.3% |