White/Caucasian Median Family Income
COMPARE
White/Caucasian
Select to Compare
Median Family Income
White/Caucasian Median Family Income
$99,800
FAMILY INCOME
18.7/ 100
METRIC RATING
202nd/ 347
METRIC RANK
White/Caucasian Median Family Income Correlation Chart
The statistical analysis conducted on geographies consisting of 582,814,142 people shows a strong positive correlation between the proportion of Whites/Caucasians and median family income in the United States with a correlation coefficient (R) of 0.750 and weighted average of $99,800. On average, for every 1% (one percent) increase in Whites/Caucasians within a typical geography, there is an increase of $395 in median family income.
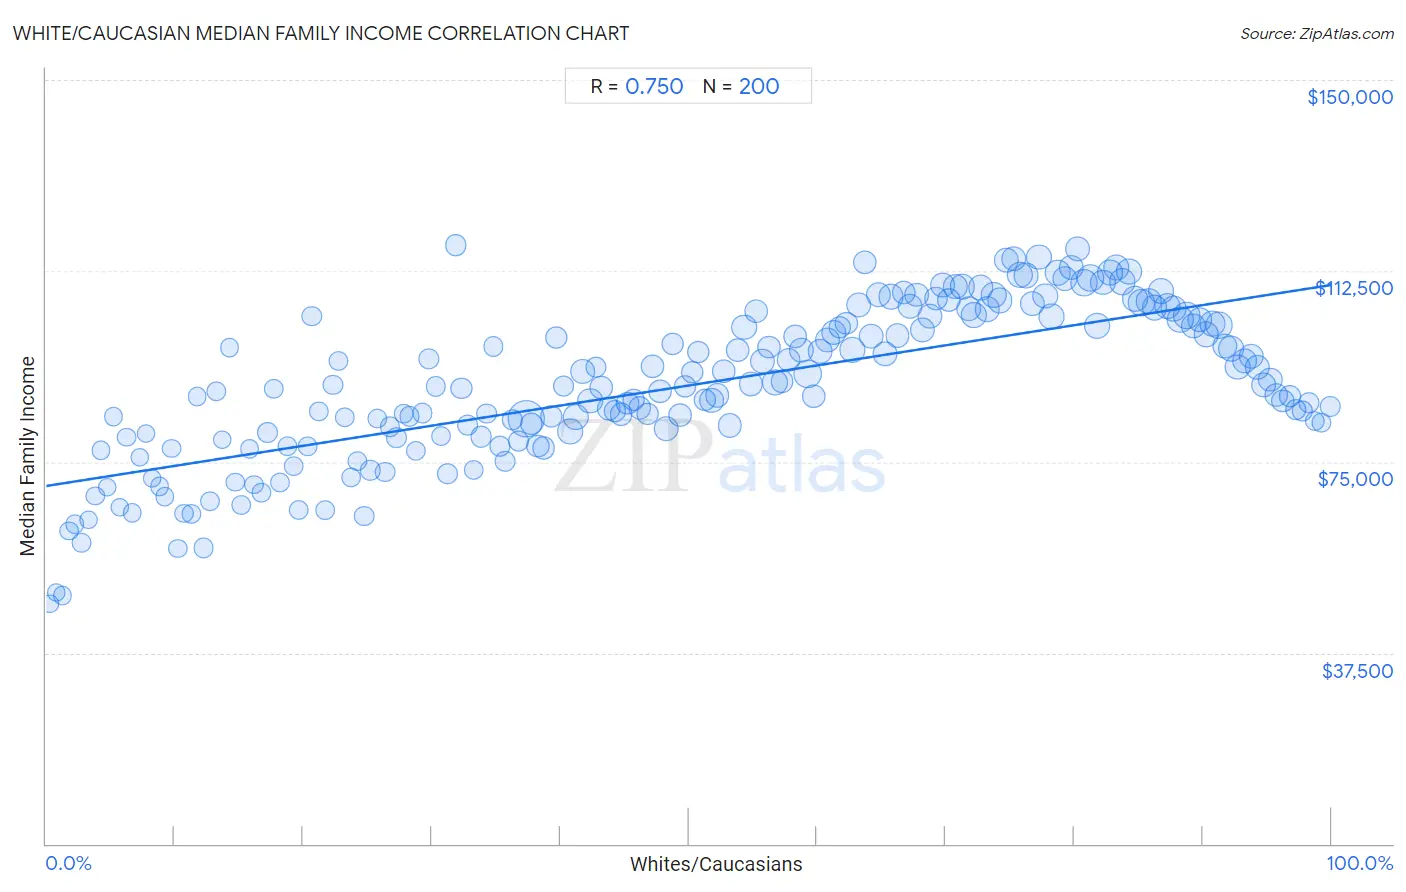
It is essential to understand that the correlation between the percentage of Whites/Caucasians and median family income does not imply a direct cause-and-effect relationship. It remains uncertain whether the presence of Whites/Caucasians influences an upward or downward trend in the level of median family income within an area, or if Whites/Caucasians simply ended up residing in those areas with higher or lower levels of median family income due to other factors.
Demographics Similar to Whites/Caucasians by Median Family Income
In terms of median family income, the demographic groups most similar to Whites/Caucasians are Immigrants from Thailand ($99,840, a difference of 0.040%), Spanish ($99,977, a difference of 0.18%), Scotch-Irish ($99,591, a difference of 0.21%), Yugoslavian ($100,119, a difference of 0.32%), and Immigrants from Africa ($100,256, a difference of 0.46%).
| Demographics | Rating | Rank | Median Family Income |
| Immigrants from South America | 23.9 /100 | #195 | Fair $100,414 |
| Samoans | 23.3 /100 | #196 | Fair $100,344 |
| Immigrants from Cameroon | 22.8 /100 | #197 | Fair $100,289 |
| Immigrants from Africa | 22.5 /100 | #198 | Fair $100,256 |
| Yugoslavians | 21.3 /100 | #199 | Fair $100,119 |
| Spanish | 20.1 /100 | #200 | Fair $99,977 |
| Immigrants from Thailand | 19.0 /100 | #201 | Poor $99,840 |
| Whites/Caucasians | 18.7 /100 | #202 | Poor $99,800 |
| Scotch-Irish | 17.1 /100 | #203 | Poor $99,591 |
| Ghanaians | 12.6 /100 | #204 | Poor $98,877 |
| Hawaiians | 12.5 /100 | #205 | Poor $98,869 |
| Immigrants from Iraq | 12.1 /100 | #206 | Poor $98,786 |
| Aleuts | 11.6 /100 | #207 | Poor $98,702 |
| Immigrants from Uruguay | 9.2 /100 | #208 | Tragic $98,205 |
| Immigrants from Colombia | 8.7 /100 | #209 | Tragic $98,067 |
White/Caucasian Median Family Income Correlation Summary
| Measurement | White/Caucasian Data | Median Family Income Data |
| Minimum | 0.32% | $47,087 |
| Maximum | 99.9% | $117,539 |
| Range | 99.6% | $70,452 |
| Mean | 50.0% | $89,997 |
| Median | 50.0% | $89,813 |
| Interquartile 25% (IQ1) | 25.0% | $80,036 |
| Interquartile 75% (IQ3) | 75.0% | $102,904 |
| Interquartile Range (IQR) | 50.0% | $22,868 |
| Standard Deviation (Sample) | 28.9% | $15,237 |
| Standard Deviation (Population) | 28.9% | $15,199 |
Correlation Details
| White/Caucasian Percentile | Sample Size | Median Family Income |
[ 0.0% - 0.5% ] 0.32% | 61,732 | $47,087 |
[ 0.5% - 1.0% ] 0.79% | 69,471 | $49,294 |
[ 1.0% - 1.5% ] 1.26% | 175,197 | $48,761 |
[ 1.5% - 2.0% ] 1.77% | 466,514 | $61,432 |
[ 2.0% - 2.5% ] 2.21% | 314,064 | $62,781 |
[ 2.5% - 3.0% ] 2.76% | 532,566 | $59,128 |
[ 3.0% - 3.5% ] 3.26% | 350,544 | $63,686 |
[ 3.5% - 4.0% ] 3.80% | 509,716 | $68,288 |
[ 4.0% - 4.5% ] 4.25% | 459,042 | $77,255 |
[ 4.5% - 5.0% ] 4.75% | 432,999 | $70,053 |
[ 5.0% - 5.5% ] 5.23% | 436,408 | $83,888 |
[ 5.5% - 6.0% ] 5.75% | 363,201 | $66,065 |
[ 6.0% - 6.5% ] 6.27% | 451,262 | $79,818 |
[ 6.5% - 7.0% ] 6.68% | 427,162 | $65,012 |
[ 7.0% - 7.5% ] 7.30% | 354,307 | $75,831 |
[ 7.5% - 8.0% ] 7.78% | 341,508 | $80,498 |
[ 8.0% - 8.5% ] 8.24% | 573,416 | $71,728 |
[ 8.5% - 9.0% ] 8.81% | 670,309 | $70,122 |
[ 9.0% - 9.5% ] 9.25% | 386,525 | $68,215 |
[ 9.5% - 10.0% ] 9.74% | 491,922 | $77,663 |
[ 10.0% - 10.5% ] 10.22% | 437,392 | $58,044 |
[ 10.5% - 11.0% ] 10.73% | 510,568 | $64,927 |
[ 11.0% - 11.5% ] 11.28% | 720,788 | $64,819 |
[ 11.5% - 12.0% ] 11.75% | 472,781 | $87,854 |
[ 12.0% - 12.5% ] 12.21% | 1,176,727 | $58,132 |
[ 12.5% - 13.0% ] 12.75% | 906,249 | $67,317 |
[ 13.0% - 13.5% ] 13.27% | 798,631 | $88,809 |
[ 13.5% - 14.0% ] 13.70% | 436,258 | $79,395 |
[ 14.0% - 14.5% ] 14.27% | 710,588 | $97,470 |
[ 14.5% - 15.0% ] 14.71% | 510,898 | $71,011 |
[ 15.0% - 15.5% ] 15.17% | 878,062 | $66,625 |
[ 15.5% - 16.0% ] 15.81% | 705,241 | $77,517 |
[ 16.0% - 16.5% ] 16.15% | 545,164 | $70,499 |
[ 16.5% - 17.0% ] 16.76% | 688,272 | $68,927 |
[ 17.0% - 17.5% ] 17.25% | 1,693,071 | $80,712 |
[ 17.5% - 18.0% ] 17.71% | 873,791 | $89,382 |
[ 18.0% - 18.5% ] 18.21% | 918,634 | $70,833 |
[ 18.5% - 19.0% ] 18.75% | 951,804 | $78,020 |
[ 19.0% - 19.5% ] 19.26% | 999,999 | $74,181 |
[ 19.5% - 20.0% ] 19.69% | 919,156 | $65,461 |
[ 20.0% - 20.5% ] 20.31% | 756,968 | $78,056 |
[ 20.5% - 21.0% ] 20.67% | 993,622 | $103,667 |
[ 21.0% - 21.5% ] 21.23% | 740,776 | $84,921 |
[ 21.5% - 22.0% ] 21.70% | 687,566 | $65,441 |
[ 22.0% - 22.5% ] 22.31% | 1,091,690 | $90,054 |
[ 22.5% - 23.0% ] 22.71% | 1,274,248 | $94,748 |
[ 23.0% - 23.5% ] 23.23% | 1,194,080 | $83,734 |
[ 23.5% - 24.0% ] 23.75% | 1,058,166 | $71,907 |
[ 24.0% - 24.5% ] 24.24% | 1,082,278 | $75,172 |
[ 24.5% - 25.0% ] 24.75% | 1,123,390 | $64,409 |
[ 25.0% - 25.5% ] 25.23% | 1,374,857 | $73,384 |
[ 25.5% - 26.0% ] 25.75% | 1,164,160 | $83,515 |
[ 26.0% - 26.5% ] 26.33% | 1,586,849 | $73,011 |
[ 26.5% - 27.0% ] 26.74% | 1,054,206 | $81,897 |
[ 27.0% - 27.5% ] 27.26% | 1,467,146 | $79,766 |
[ 27.5% - 28.0% ] 27.80% | 1,024,372 | $84,567 |
[ 28.0% - 28.5% ] 28.27% | 1,652,112 | $83,901 |
[ 28.5% - 29.0% ] 28.77% | 1,419,132 | $77,122 |
[ 29.0% - 29.5% ] 29.28% | 994,154 | $84,587 |
[ 29.5% - 30.0% ] 29.74% | 1,622,908 | $95,284 |
[ 30.0% - 30.5% ] 30.32% | 1,527,822 | $89,783 |
[ 30.5% - 31.0% ] 30.75% | 1,174,942 | $80,141 |
[ 31.0% - 31.5% ] 31.24% | 1,709,398 | $72,674 |
[ 31.5% - 32.0% ] 31.87% | 2,370,006 | $117,539 |
[ 32.0% - 32.5% ] 32.29% | 2,339,456 | $89,415 |
[ 32.5% - 33.0% ] 32.77% | 1,599,906 | $82,229 |
[ 33.0% - 33.5% ] 33.27% | 950,382 | $73,409 |
[ 33.5% - 34.0% ] 33.82% | 1,887,381 | $79,931 |
[ 34.0% - 34.5% ] 34.27% | 1,171,915 | $84,411 |
[ 34.5% - 35.0% ] 34.79% | 1,436,019 | $97,695 |
[ 35.0% - 35.5% ] 35.27% | 1,817,980 | $78,040 |
[ 35.5% - 36.0% ] 35.73% | 1,654,836 | $75,136 |
[ 36.0% - 36.5% ] 36.25% | 1,973,634 | $83,281 |
[ 36.5% - 37.0% ] 36.75% | 2,022,046 | $79,080 |
[ 37.0% - 37.5% ] 37.37% | 12,680,455 | $83,395 |
[ 37.5% - 38.0% ] 37.71% | 2,488,706 | $82,386 |
[ 38.0% - 38.5% ] 38.25% | 2,883,926 | $78,119 |
[ 38.5% - 39.0% ] 38.72% | 2,813,152 | $77,719 |
[ 39.0% - 39.5% ] 39.28% | 2,417,472 | $83,863 |
[ 39.5% - 40.0% ] 39.72% | 2,515,311 | $99,504 |
[ 40.0% - 40.5% ] 40.24% | 2,002,622 | $89,849 |
[ 40.5% - 41.0% ] 40.78% | 4,866,764 | $80,987 |
[ 41.0% - 41.5% ] 41.21% | 5,711,725 | $83,794 |
[ 41.5% - 42.0% ] 41.77% | 4,024,480 | $92,827 |
[ 42.0% - 42.5% ] 42.32% | 4,850,503 | $86,984 |
[ 42.5% - 43.0% ] 42.76% | 2,122,488 | $93,628 |
[ 43.0% - 43.5% ] 43.19% | 3,437,670 | $89,697 |
[ 43.5% - 44.0% ] 43.79% | 3,475,035 | $85,325 |
[ 44.0% - 44.5% ] 44.24% | 2,772,430 | $84,998 |
[ 44.5% - 45.0% ] 44.74% | 2,721,332 | $84,361 |
[ 45.0% - 45.5% ] 45.27% | 3,313,099 | $86,527 |
[ 45.5% - 46.0% ] 45.71% | 2,783,084 | $87,272 |
[ 46.0% - 46.5% ] 46.21% | 2,971,236 | $85,661 |
[ 46.5% - 47.0% ] 46.77% | 2,388,696 | $84,447 |
[ 47.0% - 47.5% ] 47.21% | 3,354,616 | $93,668 |
[ 47.5% - 48.0% ] 47.75% | 3,352,242 | $88,903 |
[ 48.0% - 48.5% ] 48.24% | 4,291,137 | $81,566 |
[ 48.5% - 49.0% ] 48.73% | 2,385,726 | $98,136 |
[ 49.0% - 49.5% ] 49.29% | 3,330,987 | $84,230 |
[ 49.5% - 50.0% ] 49.74% | 2,471,444 | $89,843 |
[ 50.0% - 50.5% ] 50.26% | 2,952,567 | $92,657 |
[ 50.5% - 51.0% ] 50.75% | 3,217,968 | $96,594 |
[ 51.0% - 51.5% ] 51.23% | 2,800,176 | $87,093 |
[ 51.5% - 52.0% ] 51.79% | 3,780,958 | $87,113 |
[ 52.0% - 52.5% ] 52.20% | 3,791,514 | $88,074 |
[ 52.5% - 53.0% ] 52.76% | 3,452,164 | $92,754 |
[ 53.0% - 53.5% ] 53.23% | 3,654,449 | $82,148 |
[ 53.5% - 54.0% ] 53.78% | 3,222,598 | $96,933 |
[ 54.0% - 54.5% ] 54.32% | 4,571,436 | $101,391 |
[ 54.5% - 55.0% ] 54.82% | 3,912,373 | $90,358 |
[ 55.0% - 55.5% ] 55.28% | 3,497,744 | $104,582 |
[ 55.5% - 56.0% ] 55.75% | 4,331,251 | $94,827 |
[ 56.0% - 56.5% ] 56.24% | 3,128,768 | $97,530 |
[ 56.5% - 57.0% ] 56.71% | 5,192,102 | $90,547 |
[ 57.0% - 57.5% ] 57.25% | 3,199,397 | $90,783 |
[ 57.5% - 58.0% ] 57.74% | 3,635,713 | $95,119 |
[ 58.0% - 58.5% ] 58.26% | 3,214,703 | $99,581 |
[ 58.5% - 59.0% ] 58.75% | 4,031,484 | $96,858 |
[ 59.0% - 59.5% ] 59.26% | 6,616,397 | $92,315 |
[ 59.5% - 60.0% ] 59.75% | 3,432,171 | $87,809 |
[ 60.0% - 60.5% ] 60.24% | 4,086,384 | $96,682 |
[ 60.5% - 61.0% ] 60.76% | 4,278,319 | $98,853 |
[ 61.0% - 61.5% ] 61.31% | 4,265,823 | $100,400 |
[ 61.5% - 62.0% ] 61.77% | 2,848,751 | $101,392 |
[ 62.0% - 62.5% ] 62.23% | 3,276,871 | $102,224 |
[ 62.5% - 63.0% ] 62.76% | 5,275,425 | $97,023 |
[ 63.0% - 63.5% ] 63.24% | 4,332,764 | $105,880 |
[ 63.5% - 64.0% ] 63.73% | 3,649,796 | $114,276 |
[ 64.0% - 64.5% ] 64.23% | 4,345,904 | $99,606 |
[ 64.5% - 65.0% ] 64.76% | 4,651,919 | $107,851 |
[ 65.0% - 65.5% ] 65.30% | 4,185,029 | $96,270 |
[ 65.5% - 66.0% ] 65.73% | 4,576,836 | $107,479 |
[ 66.0% - 66.5% ] 66.26% | 3,487,918 | $99,801 |
[ 66.5% - 67.0% ] 66.78% | 3,364,481 | $108,166 |
[ 67.0% - 67.5% ] 67.25% | 4,215,517 | $105,510 |
[ 67.5% - 68.0% ] 67.75% | 3,705,846 | $107,865 |
[ 68.0% - 68.5% ] 68.23% | 4,365,287 | $100,849 |
[ 68.5% - 69.0% ] 68.77% | 4,343,840 | $103,545 |
[ 69.0% - 69.5% ] 69.23% | 3,717,236 | $107,020 |
[ 69.5% - 70.0% ] 69.76% | 4,177,105 | $109,759 |
[ 70.0% - 70.5% ] 70.24% | 3,343,405 | $106,748 |
[ 70.5% - 71.0% ] 70.73% | 3,827,219 | $109,460 |
[ 71.0% - 71.5% ] 71.27% | 4,509,728 | $109,436 |
[ 71.5% - 72.0% ] 71.76% | 4,294,117 | $105,105 |
[ 72.0% - 72.5% ] 72.22% | 5,042,429 | $103,764 |
[ 72.5% - 73.0% ] 72.72% | 4,935,043 | $109,145 |
[ 73.0% - 73.5% ] 73.26% | 4,568,661 | $105,009 |
[ 73.5% - 74.0% ] 73.74% | 5,107,249 | $107,775 |
[ 74.0% - 74.5% ] 74.24% | 4,502,620 | $106,727 |
[ 74.5% - 75.0% ] 74.75% | 4,080,616 | $114,617 |
[ 75.0% - 75.5% ] 75.27% | 4,255,296 | $114,914 |
[ 75.5% - 76.0% ] 75.73% | 5,314,555 | $111,765 |
[ 76.0% - 76.5% ] 76.24% | 4,504,545 | $111,585 |
[ 76.5% - 77.0% ] 76.75% | 4,451,266 | $106,011 |
[ 77.0% - 77.5% ] 77.25% | 4,792,285 | $115,256 |
[ 77.5% - 78.0% ] 77.75% | 4,715,159 | $107,547 |
[ 78.0% - 78.5% ] 78.25% | 4,747,738 | $103,601 |
[ 78.5% - 79.0% ] 78.74% | 4,797,282 | $112,072 |
[ 79.0% - 79.5% ] 79.24% | 4,390,645 | $110,959 |
[ 79.5% - 80.0% ] 79.75% | 4,260,824 | $113,225 |
[ 80.0% - 80.5% ] 80.25% | 4,173,825 | $116,856 |
[ 80.5% - 81.0% ] 80.75% | 5,612,776 | $110,202 |
[ 81.0% - 81.5% ] 81.26% | 5,329,229 | $111,099 |
[ 81.5% - 82.0% ] 81.77% | 5,638,605 | $101,747 |
[ 82.0% - 82.5% ] 82.25% | 4,534,125 | $110,281 |
[ 82.5% - 83.0% ] 82.75% | 5,032,590 | $112,073 |
[ 83.0% - 83.5% ] 83.25% | 5,110,246 | $113,182 |
[ 83.5% - 84.0% ] 83.75% | 5,377,532 | $110,378 |
[ 84.0% - 84.5% ] 84.25% | 4,706,157 | $112,340 |
[ 84.5% - 85.0% ] 84.75% | 5,024,556 | $106,961 |
[ 85.0% - 85.5% ] 85.23% | 5,760,694 | $106,272 |
[ 85.5% - 86.0% ] 85.76% | 5,142,516 | $106,625 |
[ 86.0% - 86.5% ] 86.25% | 4,882,881 | $105,277 |
[ 86.5% - 87.0% ] 86.74% | 5,404,009 | $108,558 |
[ 87.0% - 87.5% ] 87.26% | 5,313,883 | $105,573 |
[ 87.5% - 88.0% ] 87.75% | 5,306,131 | $105,021 |
[ 88.0% - 88.5% ] 88.26% | 5,554,077 | $102,954 |
[ 88.5% - 89.0% ] 88.75% | 5,367,418 | $103,766 |
[ 89.0% - 89.5% ] 89.25% | 4,708,458 | $101,724 |
[ 89.5% - 90.0% ] 89.74% | 4,552,750 | $102,854 |
[ 90.0% - 90.5% ] 90.25% | 4,331,502 | $100,044 |
[ 90.5% - 91.0% ] 90.76% | 5,232,684 | $102,096 |
[ 91.0% - 91.5% ] 91.25% | 5,635,432 | $101,877 |
[ 91.5% - 92.0% ] 91.75% | 4,494,873 | $97,722 |
[ 92.0% - 92.5% ] 92.24% | 5,268,087 | $97,284 |
[ 92.5% - 93.0% ] 92.75% | 4,873,535 | $93,645 |
[ 93.0% - 93.5% ] 93.24% | 4,772,603 | $94,835 |
[ 93.5% - 94.0% ] 93.75% | 4,256,979 | $95,639 |
[ 94.0% - 94.5% ] 94.25% | 4,499,744 | $93,552 |
[ 94.5% - 95.0% ] 94.75% | 4,478,884 | $90,088 |
[ 95.0% - 95.5% ] 95.26% | 3,815,902 | $91,166 |
[ 95.5% - 96.0% ] 95.76% | 3,413,981 | $88,159 |
[ 96.0% - 96.5% ] 96.25% | 3,037,273 | $86,983 |
[ 96.5% - 97.0% ] 96.75% | 2,676,435 | $87,837 |
[ 97.0% - 97.5% ] 97.25% | 2,310,623 | $85,235 |
[ 97.5% - 98.0% ] 97.74% | 2,052,391 | $84,969 |
[ 98.0% - 98.5% ] 98.25% | 1,496,759 | $86,670 |
[ 98.5% - 99.0% ] 98.73% | 1,160,854 | $82,966 |
[ 99.0% - 99.5% ] 99.24% | 703,705 | $82,644 |
[ 99.5% - 100.0% ] 99.91% | 1,395,092 | $85,823 |