White/Caucasian Median Female Earnings
COMPARE
White/Caucasian
Select to Compare
Median Female Earnings
White/Caucasian Median Female Earnings
$37,531
EARNINGS | FEMALES
1.1/ 100
METRIC RATING
254th/ 347
METRIC RANK
White/Caucasian Median Female Earnings Correlation Chart
The statistical analysis conducted on geographies consisting of 581,839,033 people shows a mild positive correlation between the proportion of Whites/Caucasians and median female earnings in the United States with a correlation coefficient (R) of 0.332 and weighted average of $37,531. On average, for every 1% (one percent) increase in Whites/Caucasians within a typical geography, there is an increase of $34 in median female earnings.
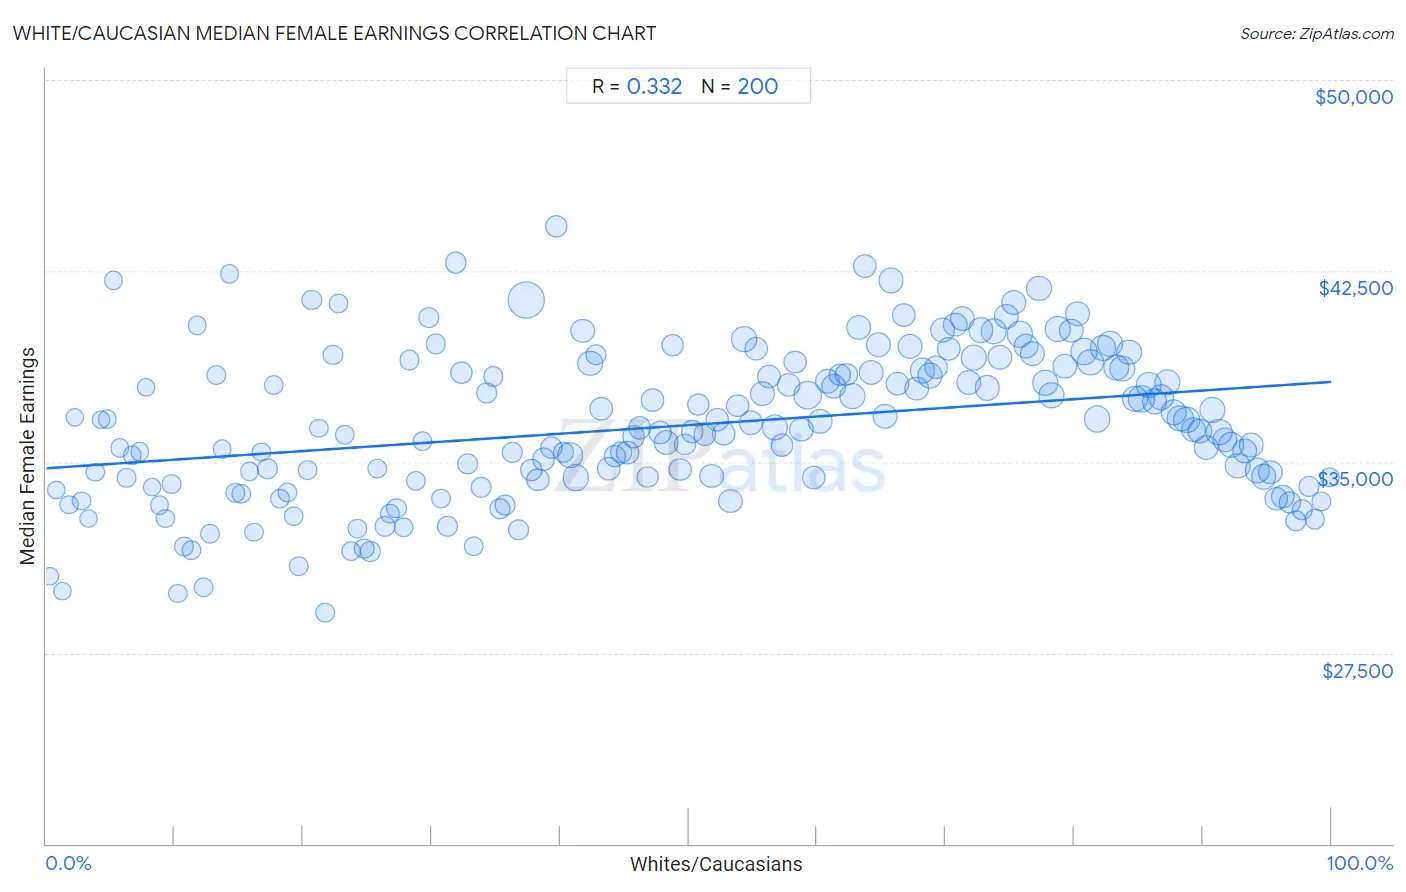
It is essential to understand that the correlation between the percentage of Whites/Caucasians and median female earnings does not imply a direct cause-and-effect relationship. It remains uncertain whether the presence of Whites/Caucasians influences an upward or downward trend in the level of median female earnings within an area, or if Whites/Caucasians simply ended up residing in those areas with higher or lower levels of median female earnings due to other factors.
Demographics Similar to Whites/Caucasians by Median Female Earnings
In terms of median female earnings, the demographic groups most similar to Whites/Caucasians are Colville ($37,514, a difference of 0.040%), Samoan ($37,498, a difference of 0.090%), Hawaiian ($37,497, a difference of 0.090%), Belizean ($37,429, a difference of 0.27%), and Scotch-Irish ($37,383, a difference of 0.39%).
| Demographics | Rating | Rank | Median Female Earnings |
| Immigrants from Somalia | 2.4 /100 | #247 | Tragic $37,914 |
| Alaskan Athabascans | 2.3 /100 | #248 | Tragic $37,905 |
| Swiss | 2.3 /100 | #249 | Tragic $37,904 |
| Immigrants from Iraq | 2.2 /100 | #250 | Tragic $37,864 |
| Welsh | 2.1 /100 | #251 | Tragic $37,856 |
| Immigrants from Dominica | 2.0 /100 | #252 | Tragic $37,825 |
| Danes | 1.6 /100 | #253 | Tragic $37,730 |
| Whites/Caucasians | 1.1 /100 | #254 | Tragic $37,531 |
| Colville | 1.1 /100 | #255 | Tragic $37,514 |
| Samoans | 1.0 /100 | #256 | Tragic $37,498 |
| Hawaiians | 1.0 /100 | #257 | Tragic $37,497 |
| Belizeans | 0.9 /100 | #258 | Tragic $37,429 |
| Scotch-Irish | 0.8 /100 | #259 | Tragic $37,383 |
| Dutch | 0.7 /100 | #260 | Tragic $37,339 |
| Malaysians | 0.7 /100 | #261 | Tragic $37,298 |
White/Caucasian Median Female Earnings Correlation Summary
| Measurement | White/Caucasian Data | Median Female Earnings Data |
| Minimum | 0.32% | $29,061 |
| Maximum | 99.9% | $44,249 |
| Range | 99.6% | $15,187 |
| Mean | 50.0% | $36,445 |
| Median | 50.0% | $36,298 |
| Interquartile 25% (IQ1) | 25.0% | $34,375 |
| Interquartile 75% (IQ3) | 75.0% | $38,681 |
| Interquartile Range (IQR) | 50.0% | $4,306 |
| Standard Deviation (Sample) | 28.9% | $2,956 |
| Standard Deviation (Population) | 28.9% | $2,949 |
Correlation Details
| White/Caucasian Percentile | Sample Size | Median Female Earnings |
[ 0.0% - 0.5% ] 0.32% | 60,500 | $30,501 |
[ 0.5% - 1.0% ] 0.79% | 69,385 | $33,904 |
[ 1.0% - 1.5% ] 1.26% | 174,174 | $29,901 |
[ 1.5% - 2.0% ] 1.77% | 466,731 | $33,314 |
[ 2.0% - 2.5% ] 2.21% | 307,533 | $36,744 |
[ 2.5% - 3.0% ] 2.76% | 528,425 | $33,468 |
[ 3.0% - 3.5% ] 3.26% | 347,445 | $32,761 |
[ 3.5% - 4.0% ] 3.80% | 514,549 | $34,598 |
[ 4.0% - 4.5% ] 4.25% | 459,229 | $36,662 |
[ 4.5% - 5.0% ] 4.75% | 430,406 | $36,687 |
[ 5.0% - 5.5% ] 5.23% | 435,921 | $42,127 |
[ 5.5% - 6.0% ] 5.75% | 363,028 | $35,543 |
[ 6.0% - 6.5% ] 6.27% | 451,612 | $34,380 |
[ 6.5% - 7.0% ] 6.68% | 427,547 | $35,251 |
[ 7.0% - 7.5% ] 7.30% | 352,938 | $35,401 |
[ 7.5% - 8.0% ] 7.78% | 338,894 | $37,916 |
[ 8.0% - 8.5% ] 8.24% | 572,291 | $34,002 |
[ 8.5% - 9.0% ] 8.81% | 671,061 | $33,307 |
[ 9.0% - 9.5% ] 9.25% | 385,327 | $32,787 |
[ 9.5% - 10.0% ] 9.74% | 492,254 | $34,136 |
[ 10.0% - 10.5% ] 10.22% | 432,774 | $29,829 |
[ 10.5% - 11.0% ] 10.73% | 510,468 | $31,675 |
[ 11.0% - 11.5% ] 11.27% | 717,367 | $31,528 |
[ 11.5% - 12.0% ] 11.75% | 473,734 | $40,356 |
[ 12.0% - 12.5% ] 12.21% | 1,176,882 | $30,088 |
[ 12.5% - 13.0% ] 12.75% | 905,572 | $32,198 |
[ 13.0% - 13.5% ] 13.27% | 796,706 | $38,402 |
[ 13.5% - 14.0% ] 13.70% | 436,983 | $35,510 |
[ 14.0% - 14.5% ] 14.27% | 711,984 | $42,382 |
[ 14.5% - 15.0% ] 14.71% | 507,425 | $33,797 |
[ 15.0% - 15.5% ] 15.17% | 877,037 | $33,770 |
[ 15.5% - 16.0% ] 15.81% | 704,441 | $34,642 |
[ 16.0% - 16.5% ] 16.16% | 540,123 | $32,234 |
[ 16.5% - 17.0% ] 16.76% | 689,360 | $35,388 |
[ 17.0% - 17.5% ] 17.25% | 1,691,427 | $34,742 |
[ 17.5% - 18.0% ] 17.71% | 877,790 | $38,032 |
[ 18.0% - 18.5% ] 18.21% | 918,370 | $33,541 |
[ 18.5% - 19.0% ] 18.75% | 951,926 | $33,782 |
[ 19.0% - 19.5% ] 19.26% | 998,838 | $32,875 |
[ 19.5% - 20.0% ] 19.69% | 909,958 | $30,903 |
[ 20.0% - 20.5% ] 20.31% | 756,766 | $34,674 |
[ 20.5% - 21.0% ] 20.67% | 992,427 | $41,379 |
[ 21.0% - 21.5% ] 21.23% | 736,688 | $36,325 |
[ 21.5% - 22.0% ] 21.70% | 686,852 | $29,061 |
[ 22.0% - 22.5% ] 22.31% | 1,092,537 | $39,195 |
[ 22.5% - 23.0% ] 22.71% | 1,275,214 | $41,216 |
[ 23.0% - 23.5% ] 23.23% | 1,195,674 | $36,049 |
[ 23.5% - 24.0% ] 23.75% | 1,057,249 | $31,493 |
[ 24.0% - 24.5% ] 24.24% | 1,083,544 | $32,396 |
[ 24.5% - 25.0% ] 24.75% | 1,122,405 | $31,581 |
[ 25.0% - 25.5% ] 25.23% | 1,373,294 | $31,471 |
[ 25.5% - 26.0% ] 25.75% | 1,165,870 | $34,723 |
[ 26.0% - 26.5% ] 26.33% | 1,586,090 | $32,487 |
[ 26.5% - 27.0% ] 26.74% | 1,056,645 | $32,961 |
[ 27.0% - 27.5% ] 27.26% | 1,467,231 | $33,182 |
[ 27.5% - 28.0% ] 27.81% | 1,026,327 | $32,427 |
[ 28.0% - 28.5% ] 28.27% | 1,648,603 | $39,009 |
[ 28.5% - 29.0% ] 28.77% | 1,421,578 | $34,254 |
[ 29.0% - 29.5% ] 29.28% | 989,247 | $35,822 |
[ 29.5% - 30.0% ] 29.74% | 1,621,650 | $40,651 |
[ 30.0% - 30.5% ] 30.32% | 1,525,424 | $39,619 |
[ 30.5% - 31.0% ] 30.75% | 1,173,923 | $33,568 |
[ 31.0% - 31.5% ] 31.24% | 1,704,823 | $32,468 |
[ 31.5% - 32.0% ] 31.87% | 2,361,692 | $42,811 |
[ 32.0% - 32.5% ] 32.29% | 2,338,818 | $38,499 |
[ 32.5% - 33.0% ] 32.77% | 1,598,339 | $34,926 |
[ 33.0% - 33.5% ] 33.27% | 949,168 | $31,692 |
[ 33.5% - 34.0% ] 33.82% | 1,886,523 | $34,016 |
[ 34.0% - 34.5% ] 34.27% | 1,170,748 | $37,714 |
[ 34.5% - 35.0% ] 34.79% | 1,429,435 | $38,364 |
[ 35.0% - 35.5% ] 35.27% | 1,821,361 | $33,146 |
[ 35.5% - 36.0% ] 35.73% | 1,654,406 | $33,306 |
[ 36.0% - 36.5% ] 36.25% | 1,967,757 | $35,361 |
[ 36.5% - 37.0% ] 36.75% | 2,021,400 | $32,343 |
[ 37.0% - 37.5% ] 37.37% | 12,678,643 | $41,350 |
[ 37.5% - 38.0% ] 37.71% | 2,487,922 | $34,658 |
[ 38.0% - 38.5% ] 38.24% | 2,886,213 | $34,287 |
[ 38.5% - 39.0% ] 38.72% | 2,812,095 | $35,101 |
[ 39.0% - 39.5% ] 39.28% | 2,415,789 | $35,559 |
[ 39.5% - 40.0% ] 39.72% | 2,516,756 | $44,249 |
[ 40.0% - 40.5% ] 40.24% | 2,008,845 | $35,387 |
[ 40.5% - 41.0% ] 40.78% | 4,861,139 | $35,249 |
[ 41.0% - 41.5% ] 41.21% | 5,720,267 | $34,370 |
[ 41.5% - 42.0% ] 41.77% | 4,021,225 | $40,155 |
[ 42.0% - 42.5% ] 42.32% | 4,852,778 | $38,867 |
[ 42.5% - 43.0% ] 42.76% | 2,120,903 | $39,212 |
[ 43.0% - 43.5% ] 43.19% | 3,448,103 | $37,095 |
[ 43.5% - 44.0% ] 43.79% | 3,475,414 | $34,736 |
[ 44.0% - 44.5% ] 44.24% | 2,768,519 | $35,219 |
[ 44.5% - 45.0% ] 44.74% | 2,730,807 | $35,365 |
[ 45.0% - 45.5% ] 45.27% | 3,313,553 | $35,366 |
[ 45.5% - 46.0% ] 45.71% | 2,782,937 | $35,983 |
[ 46.0% - 46.5% ] 46.21% | 2,980,186 | $36,332 |
[ 46.5% - 47.0% ] 46.77% | 2,393,699 | $34,404 |
[ 47.0% - 47.5% ] 47.21% | 3,354,452 | $37,416 |
[ 47.5% - 48.0% ] 47.75% | 3,356,825 | $36,146 |
[ 48.0% - 48.5% ] 48.24% | 4,308,201 | $35,742 |
[ 48.5% - 49.0% ] 48.73% | 2,400,320 | $39,578 |
[ 49.0% - 49.5% ] 49.29% | 3,332,214 | $34,700 |
[ 49.5% - 50.0% ] 49.74% | 2,472,845 | $35,681 |
[ 50.0% - 50.5% ] 50.26% | 2,950,570 | $36,196 |
[ 50.5% - 51.0% ] 50.75% | 3,215,552 | $37,253 |
[ 51.0% - 51.5% ] 51.23% | 2,800,313 | $36,087 |
[ 51.5% - 52.0% ] 51.79% | 3,773,684 | $34,455 |
[ 52.0% - 52.5% ] 52.20% | 3,794,638 | $36,645 |
[ 52.5% - 53.0% ] 52.76% | 3,452,209 | $36,122 |
[ 53.0% - 53.5% ] 53.23% | 3,665,813 | $33,459 |
[ 53.5% - 54.0% ] 53.78% | 3,229,155 | $37,209 |
[ 54.0% - 54.5% ] 54.32% | 4,574,047 | $39,816 |
[ 54.5% - 55.0% ] 54.82% | 3,921,625 | $36,534 |
[ 55.0% - 55.5% ] 55.28% | 3,503,313 | $39,445 |
[ 55.5% - 56.0% ] 55.75% | 4,332,600 | $37,696 |
[ 56.0% - 56.5% ] 56.24% | 3,121,471 | $38,369 |
[ 56.5% - 57.0% ] 56.71% | 5,200,120 | $36,337 |
[ 57.0% - 57.5% ] 57.25% | 3,202,678 | $35,640 |
[ 57.5% - 58.0% ] 57.74% | 3,632,719 | $38,038 |
[ 58.0% - 58.5% ] 58.26% | 3,211,382 | $38,920 |
[ 58.5% - 59.0% ] 58.75% | 4,040,501 | $36,271 |
[ 59.0% - 59.5% ] 59.26% | 6,617,857 | $37,627 |
[ 59.5% - 60.0% ] 59.75% | 3,433,389 | $34,390 |
[ 60.0% - 60.5% ] 60.24% | 4,103,544 | $36,596 |
[ 60.5% - 61.0% ] 60.76% | 4,280,254 | $38,145 |
[ 61.0% - 61.5% ] 61.31% | 4,263,626 | $37,962 |
[ 61.5% - 62.0% ] 61.77% | 2,875,224 | $38,422 |
[ 62.0% - 62.5% ] 62.23% | 3,280,650 | $38,428 |
[ 62.5% - 63.0% ] 62.76% | 5,272,383 | $37,587 |
[ 63.0% - 63.5% ] 63.24% | 4,336,918 | $40,289 |
[ 63.5% - 64.0% ] 63.73% | 3,657,147 | $42,674 |
[ 64.0% - 64.5% ] 64.23% | 4,355,923 | $38,510 |
[ 64.5% - 65.0% ] 64.76% | 4,643,347 | $39,594 |
[ 65.0% - 65.5% ] 65.30% | 4,198,122 | $36,806 |
[ 65.5% - 66.0% ] 65.73% | 4,576,630 | $42,133 |
[ 66.0% - 66.5% ] 66.26% | 3,498,412 | $38,081 |
[ 66.5% - 67.0% ] 66.78% | 3,369,625 | $40,753 |
[ 67.0% - 67.5% ] 67.25% | 4,209,430 | $39,527 |
[ 67.5% - 68.0% ] 67.75% | 3,708,097 | $37,892 |
[ 68.0% - 68.5% ] 68.23% | 4,359,847 | $38,586 |
[ 68.5% - 69.0% ] 68.77% | 4,350,673 | $38,388 |
[ 69.0% - 69.5% ] 69.23% | 3,710,830 | $38,709 |
[ 69.5% - 70.0% ] 69.76% | 4,177,817 | $40,186 |
[ 70.0% - 70.5% ] 70.24% | 3,343,413 | $39,424 |
[ 70.5% - 71.0% ] 70.73% | 3,850,485 | $40,388 |
[ 71.0% - 71.5% ] 71.27% | 4,503,938 | $40,643 |
[ 71.5% - 72.0% ] 71.76% | 4,303,746 | $38,141 |
[ 72.0% - 72.5% ] 72.23% | 5,040,217 | $39,118 |
[ 72.5% - 73.0% ] 72.72% | 4,929,642 | $40,188 |
[ 73.0% - 73.5% ] 73.26% | 4,568,572 | $37,902 |
[ 73.5% - 74.0% ] 73.74% | 5,096,041 | $40,139 |
[ 74.0% - 74.5% ] 74.24% | 4,489,154 | $39,107 |
[ 74.5% - 75.0% ] 74.75% | 4,080,267 | $40,731 |
[ 75.0% - 75.5% ] 75.27% | 4,266,217 | $41,279 |
[ 75.5% - 76.0% ] 75.73% | 5,331,584 | $40,010 |
[ 76.0% - 76.5% ] 76.24% | 4,500,218 | $39,549 |
[ 76.5% - 77.0% ] 76.75% | 4,460,236 | $39,254 |
[ 77.0% - 77.5% ] 77.25% | 4,788,880 | $41,807 |
[ 77.5% - 78.0% ] 77.75% | 4,728,520 | $38,095 |
[ 78.0% - 78.5% ] 78.26% | 4,756,443 | $37,614 |
[ 78.5% - 79.0% ] 78.74% | 4,794,352 | $40,221 |
[ 79.0% - 79.5% ] 79.24% | 4,384,889 | $38,743 |
[ 79.5% - 80.0% ] 79.75% | 4,256,477 | $40,155 |
[ 80.0% - 80.5% ] 80.25% | 4,178,029 | $40,805 |
[ 80.5% - 81.0% ] 80.75% | 5,602,135 | $39,327 |
[ 81.0% - 81.5% ] 81.26% | 5,335,891 | $38,913 |
[ 81.5% - 82.0% ] 81.77% | 5,623,175 | $36,695 |
[ 82.0% - 82.5% ] 82.25% | 4,527,778 | $39,479 |
[ 82.5% - 83.0% ] 82.75% | 5,022,767 | $39,655 |
[ 83.0% - 83.5% ] 83.25% | 5,095,649 | $38,709 |
[ 83.5% - 84.0% ] 83.75% | 5,382,532 | $38,653 |
[ 84.0% - 84.5% ] 84.25% | 4,688,641 | $39,300 |
[ 84.5% - 85.0% ] 84.75% | 5,009,170 | $37,458 |
[ 85.0% - 85.5% ] 85.23% | 5,771,366 | $37,484 |
[ 85.5% - 86.0% ] 85.76% | 5,130,277 | $37,999 |
[ 86.0% - 86.5% ] 86.25% | 4,866,272 | $37,385 |
[ 86.5% - 87.0% ] 86.74% | 5,390,226 | $37,536 |
[ 87.0% - 87.5% ] 87.26% | 5,290,123 | $38,118 |
[ 87.5% - 88.0% ] 87.75% | 5,268,874 | $36,946 |
[ 88.0% - 88.5% ] 88.26% | 5,531,490 | $36,712 |
[ 88.5% - 89.0% ] 88.75% | 5,347,390 | $36,652 |
[ 89.0% - 89.5% ] 89.25% | 4,693,284 | $36,266 |
[ 89.5% - 90.0% ] 89.75% | 4,539,499 | $36,195 |
[ 90.0% - 90.5% ] 90.25% | 4,299,829 | $35,575 |
[ 90.5% - 91.0% ] 90.76% | 5,197,153 | $37,038 |
[ 91.0% - 91.5% ] 91.25% | 5,615,254 | $36,171 |
[ 91.5% - 92.0% ] 91.75% | 4,464,249 | $35,870 |
[ 92.0% - 92.5% ] 92.24% | 5,247,298 | $35,678 |
[ 92.5% - 93.0% ] 92.75% | 4,853,470 | $34,845 |
[ 93.0% - 93.5% ] 93.24% | 4,738,211 | $35,421 |
[ 93.5% - 94.0% ] 93.75% | 4,224,411 | $35,645 |
[ 94.0% - 94.5% ] 94.26% | 4,464,151 | $34,667 |
[ 94.5% - 95.0% ] 94.75% | 4,428,657 | $34,418 |
[ 95.0% - 95.5% ] 95.26% | 3,768,984 | $34,580 |
[ 95.5% - 96.0% ] 95.76% | 3,390,455 | $33,539 |
[ 96.0% - 96.5% ] 96.25% | 2,996,276 | $33,638 |
[ 96.5% - 97.0% ] 96.75% | 2,643,130 | $33,397 |
[ 97.0% - 97.5% ] 97.25% | 2,261,061 | $32,688 |
[ 97.5% - 98.0% ] 97.74% | 2,005,602 | $33,119 |
[ 98.0% - 98.5% ] 98.25% | 1,445,017 | $34,048 |
[ 98.5% - 99.0% ] 98.73% | 1,119,246 | $32,744 |
[ 99.0% - 99.5% ] 99.24% | 676,556 | $33,433 |
[ 99.5% - 100.0% ] 99.90% | 1,191,256 | $34,395 |