White/Caucasian Median Household Income
COMPARE
White/Caucasian
Select to Compare
Median Household Income
White/Caucasian Median Household Income
$82,029
HOUSEHOLD INCOME
12.2/ 100
METRIC RATING
218th/ 347
METRIC RANK
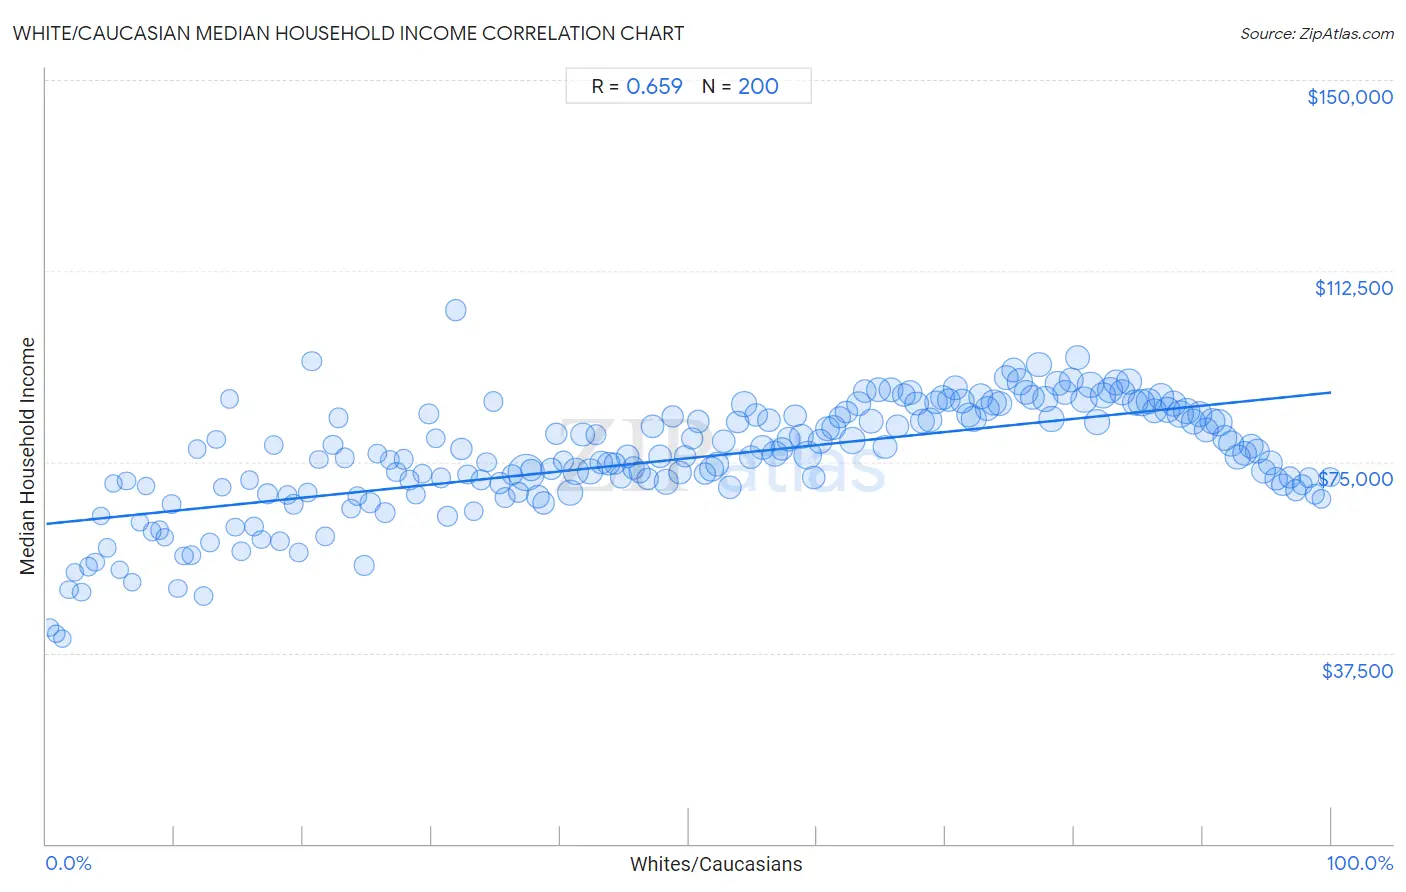
White/Caucasian Median Household Income Correlation Chart
The statistical analysis conducted on geographies consisting of 583,274,044 people shows a significant positive correlation between the proportion of Whites/Caucasians and median household income in the United States with a correlation coefficient (R) of 0.659 and weighted average of $82,029. On average, for every 1% (one percent) increase in Whites/Caucasians within a typical geography, there is an increase of $258 in median household income.
It is essential to understand that the correlation between the percentage of Whites/Caucasians and median household income does not imply a direct cause-and-effect relationship. It remains uncertain whether the presence of Whites/Caucasians influences an upward or downward trend in the level of median household income within an area, or if Whites/Caucasians simply ended up residing in those areas with higher or lower levels of median household income due to other factors.
Demographics Similar to Whites/Caucasians by Median Household Income
In terms of median household income, the demographic groups most similar to Whites/Caucasians are Ecuadorian ($82,070, a difference of 0.050%), Yugoslavian ($82,186, a difference of 0.19%), Vietnamese ($82,248, a difference of 0.27%), Panamanian ($82,272, a difference of 0.30%), and Nigerian ($81,725, a difference of 0.37%).
| Demographics | Rating | Rank | Median Household Income |
| Salvadorans | 15.4 /100 | #211 | Poor $82,449 |
| Venezuelans | 15.3 /100 | #212 | Poor $82,432 |
| Nepalese | 15.1 /100 | #213 | Poor $82,410 |
| Panamanians | 14.0 /100 | #214 | Poor $82,272 |
| Vietnamese | 13.8 /100 | #215 | Poor $82,248 |
| Yugoslavians | 13.3 /100 | #216 | Poor $82,186 |
| Ecuadorians | 12.5 /100 | #217 | Poor $82,070 |
| Whites/Caucasians | 12.2 /100 | #218 | Poor $82,029 |
| Nigerians | 10.3 /100 | #219 | Poor $81,725 |
| Immigrants from Venezuela | 9.0 /100 | #220 | Tragic $81,506 |
| Immigrants from Ghana | 9.0 /100 | #221 | Tragic $81,489 |
| Immigrants from Nigeria | 7.7 /100 | #222 | Tragic $81,236 |
| Immigrants from El Salvador | 7.6 /100 | #223 | Tragic $81,213 |
| Malaysians | 7.0 /100 | #224 | Tragic $81,064 |
| Scotch-Irish | 6.6 /100 | #225 | Tragic $80,972 |
White/Caucasian Median Household Income Correlation Summary
| Measurement | White/Caucasian Data | Median Household Income Data |
| Minimum | 0.32% | $40,196 |
| Maximum | 99.9% | $104,886 |
| Range | 99.6% | $64,690 |
| Mean | 50.0% | $75,721 |
| Median | 50.0% | $76,251 |
| Interquartile 25% (IQ1) | 25.0% | $70,055 |
| Interquartile 75% (IQ3) | 75.0% | $84,369 |
| Interquartile Range (IQR) | 50.0% | $14,314 |
| Standard Deviation (Sample) | 28.9% | $11,326 |
| Standard Deviation (Population) | 28.9% | $11,297 |
Correlation Details
| White/Caucasian Percentile | Sample Size | Median Household Income |
[ 0.0% - 0.5% ] 0.32% | 61,758 | $42,568 |
[ 0.5% - 1.0% ] 0.80% | 72,052 | $41,213 |
[ 1.0% - 1.5% ] 1.26% | 176,218 | $40,196 |
[ 1.5% - 2.0% ] 1.77% | 470,009 | $49,836 |
[ 2.0% - 2.5% ] 2.21% | 313,824 | $53,234 |
[ 2.5% - 3.0% ] 2.76% | 534,170 | $49,360 |
[ 3.0% - 3.5% ] 3.26% | 350,754 | $54,409 |
[ 3.5% - 4.0% ] 3.80% | 515,068 | $55,251 |
[ 4.0% - 4.5% ] 4.25% | 458,847 | $64,379 |
[ 4.5% - 5.0% ] 4.75% | 433,932 | $58,103 |
[ 5.0% - 5.5% ] 5.23% | 438,766 | $70,721 |
[ 5.5% - 6.0% ] 5.75% | 362,403 | $53,877 |
[ 6.0% - 6.5% ] 6.27% | 451,269 | $71,278 |
[ 6.5% - 7.0% ] 6.68% | 428,491 | $51,349 |
[ 7.0% - 7.5% ] 7.30% | 354,095 | $63,180 |
[ 7.5% - 8.0% ] 7.78% | 342,871 | $70,254 |
[ 8.0% - 8.5% ] 8.24% | 572,477 | $61,369 |
[ 8.5% - 9.0% ] 8.81% | 670,423 | $61,561 |
[ 9.0% - 9.5% ] 9.25% | 386,381 | $60,149 |
[ 9.5% - 10.0% ] 9.74% | 491,828 | $66,708 |
[ 10.0% - 10.5% ] 10.22% | 437,295 | $50,136 |
[ 10.5% - 11.0% ] 10.73% | 511,416 | $56,583 |
[ 11.0% - 11.5% ] 11.28% | 728,134 | $56,603 |
[ 11.5% - 12.0% ] 11.75% | 474,382 | $77,456 |
[ 12.0% - 12.5% ] 12.21% | 1,176,863 | $48,686 |
[ 12.5% - 13.0% ] 12.75% | 906,565 | $59,251 |
[ 13.0% - 13.5% ] 13.27% | 800,536 | $79,389 |
[ 13.5% - 14.0% ] 13.70% | 437,657 | $70,046 |
[ 14.0% - 14.5% ] 14.27% | 710,985 | $87,440 |
[ 14.5% - 15.0% ] 14.71% | 511,475 | $62,145 |
[ 15.0% - 15.5% ] 15.17% | 875,973 | $57,516 |
[ 15.5% - 16.0% ] 15.81% | 706,331 | $71,461 |
[ 16.0% - 16.5% ] 16.15% | 545,083 | $62,330 |
[ 16.5% - 17.0% ] 16.76% | 689,828 | $59,724 |
[ 17.0% - 17.5% ] 17.25% | 1,693,665 | $68,679 |
[ 17.5% - 18.0% ] 17.71% | 877,973 | $78,229 |
[ 18.0% - 18.5% ] 18.21% | 919,824 | $59,522 |
[ 18.5% - 19.0% ] 18.75% | 953,307 | $68,500 |
[ 19.0% - 19.5% ] 19.26% | 1,001,318 | $66,666 |
[ 19.5% - 20.0% ] 19.69% | 918,749 | $57,287 |
[ 20.0% - 20.5% ] 20.31% | 756,607 | $69,036 |
[ 20.5% - 21.0% ] 20.67% | 993,479 | $94,847 |
[ 21.0% - 21.5% ] 21.23% | 740,920 | $75,454 |
[ 21.5% - 22.0% ] 21.70% | 687,807 | $60,321 |
[ 22.0% - 22.5% ] 22.31% | 1,093,149 | $78,284 |
[ 22.5% - 23.0% ] 22.71% | 1,272,166 | $83,612 |
[ 23.0% - 23.5% ] 23.23% | 1,195,285 | $75,738 |
[ 23.5% - 24.0% ] 23.75% | 1,058,975 | $65,771 |
[ 24.0% - 24.5% ] 24.24% | 1,082,818 | $68,335 |
[ 24.5% - 25.0% ] 24.75% | 1,122,924 | $54,675 |
[ 25.0% - 25.5% ] 25.23% | 1,376,404 | $66,945 |
[ 25.5% - 26.0% ] 25.75% | 1,164,618 | $76,704 |
[ 26.0% - 26.5% ] 26.33% | 1,587,937 | $65,021 |
[ 26.5% - 27.0% ] 26.74% | 1,061,774 | $75,384 |
[ 27.0% - 27.5% ] 27.26% | 1,469,237 | $72,986 |
[ 27.5% - 28.0% ] 27.80% | 1,021,827 | $75,512 |
[ 28.0% - 28.5% ] 28.27% | 1,652,070 | $71,342 |
[ 28.5% - 29.0% ] 28.77% | 1,419,132 | $68,544 |
[ 29.0% - 29.5% ] 29.28% | 993,831 | $72,675 |
[ 29.5% - 30.0% ] 29.74% | 1,621,939 | $84,429 |
[ 30.0% - 30.5% ] 30.32% | 1,527,300 | $79,629 |
[ 30.5% - 31.0% ] 30.75% | 1,174,251 | $71,850 |
[ 31.0% - 31.5% ] 31.24% | 1,710,544 | $64,375 |
[ 31.5% - 32.0% ] 31.87% | 2,369,970 | $104,886 |
[ 32.0% - 32.5% ] 32.29% | 2,341,529 | $77,530 |
[ 32.5% - 33.0% ] 32.77% | 1,603,008 | $72,537 |
[ 33.0% - 33.5% ] 33.27% | 946,717 | $65,201 |
[ 33.5% - 34.0% ] 33.82% | 1,887,381 | $71,389 |
[ 34.0% - 34.5% ] 34.27% | 1,172,493 | $74,945 |
[ 34.5% - 35.0% ] 34.79% | 1,436,569 | $86,894 |
[ 35.0% - 35.5% ] 35.27% | 1,820,673 | $70,828 |
[ 35.5% - 36.0% ] 35.73% | 1,657,836 | $68,064 |
[ 36.0% - 36.5% ] 36.25% | 1,974,347 | $72,512 |
[ 36.5% - 37.0% ] 36.75% | 2,022,407 | $68,995 |
[ 37.0% - 37.5% ] 37.37% | 12,681,545 | $72,959 |
[ 37.5% - 38.0% ] 37.71% | 2,491,557 | $73,341 |
[ 38.0% - 38.5% ] 38.25% | 2,886,277 | $68,208 |
[ 38.5% - 39.0% ] 38.72% | 2,811,248 | $66,910 |
[ 39.0% - 39.5% ] 39.28% | 2,419,388 | $73,620 |
[ 39.5% - 40.0% ] 39.72% | 2,518,195 | $80,558 |
[ 40.0% - 40.5% ] 40.24% | 2,010,047 | $75,203 |
[ 40.5% - 41.0% ] 40.78% | 4,863,360 | $68,998 |
[ 41.0% - 41.5% ] 41.21% | 5,714,316 | $73,089 |
[ 41.5% - 42.0% ] 41.77% | 4,024,455 | $80,379 |
[ 42.0% - 42.5% ] 42.32% | 4,851,427 | $73,189 |
[ 42.5% - 43.0% ] 42.76% | 2,123,524 | $80,371 |
[ 43.0% - 43.5% ] 43.19% | 3,449,663 | $74,854 |
[ 43.5% - 44.0% ] 43.79% | 3,481,125 | $74,565 |
[ 44.0% - 44.5% ] 44.24% | 2,771,604 | $74,709 |
[ 44.5% - 45.0% ] 44.74% | 2,726,195 | $72,075 |
[ 45.0% - 45.5% ] 45.27% | 3,315,910 | $76,139 |
[ 45.5% - 46.0% ] 45.71% | 2,784,811 | $73,789 |
[ 46.0% - 46.5% ] 46.21% | 2,977,473 | $72,944 |
[ 46.5% - 47.0% ] 46.77% | 2,393,523 | $71,599 |
[ 47.0% - 47.5% ] 47.21% | 3,357,987 | $81,925 |
[ 47.5% - 48.0% ] 47.75% | 3,355,461 | $76,099 |
[ 48.0% - 48.5% ] 48.24% | 4,304,719 | $71,075 |
[ 48.5% - 49.0% ] 48.73% | 2,385,998 | $83,995 |
[ 49.0% - 49.5% ] 49.29% | 3,330,485 | $72,983 |
[ 49.5% - 50.0% ] 49.74% | 2,472,273 | $76,057 |
[ 50.0% - 50.5% ] 50.26% | 2,954,084 | $79,552 |
[ 50.5% - 51.0% ] 50.75% | 3,219,447 | $83,007 |
[ 51.0% - 51.5% ] 51.23% | 2,800,335 | $72,762 |
[ 51.5% - 52.0% ] 51.79% | 3,782,089 | $73,547 |
[ 52.0% - 52.5% ] 52.20% | 3,794,256 | $74,555 |
[ 52.5% - 53.0% ] 52.76% | 3,453,037 | $79,089 |
[ 53.0% - 53.5% ] 53.23% | 3,655,894 | $70,064 |
[ 53.5% - 54.0% ] 53.78% | 3,223,687 | $82,818 |
[ 54.0% - 54.5% ] 54.32% | 4,571,261 | $86,306 |
[ 54.5% - 55.0% ] 54.82% | 3,913,636 | $75,926 |
[ 55.0% - 55.5% ] 55.28% | 3,500,744 | $84,202 |
[ 55.5% - 56.0% ] 55.75% | 4,332,382 | $77,814 |
[ 56.0% - 56.5% ] 56.24% | 3,125,239 | $83,202 |
[ 56.5% - 57.0% ] 56.71% | 5,197,579 | $76,506 |
[ 57.0% - 57.5% ] 57.25% | 3,200,818 | $77,525 |
[ 57.5% - 58.0% ] 57.74% | 3,644,885 | $79,423 |
[ 58.0% - 58.5% ] 58.26% | 3,214,850 | $84,037 |
[ 58.5% - 59.0% ] 58.75% | 4,037,284 | $79,927 |
[ 59.0% - 59.5% ] 59.26% | 6,617,948 | $76,364 |
[ 59.5% - 60.0% ] 59.75% | 3,432,017 | $72,001 |
[ 60.0% - 60.5% ] 60.24% | 4,088,455 | $79,117 |
[ 60.5% - 61.0% ] 60.76% | 4,283,113 | $81,470 |
[ 61.0% - 61.5% ] 61.31% | 4,264,045 | $81,661 |
[ 61.5% - 62.0% ] 61.77% | 2,846,747 | $83,709 |
[ 62.0% - 62.5% ] 62.23% | 3,277,538 | $84,812 |
[ 62.5% - 63.0% ] 62.76% | 5,275,776 | $79,175 |
[ 63.0% - 63.5% ] 63.24% | 4,336,986 | $86,359 |
[ 63.5% - 64.0% ] 63.73% | 3,651,808 | $88,951 |
[ 64.0% - 64.5% ] 64.23% | 4,351,092 | $82,881 |
[ 64.5% - 65.0% ] 64.76% | 4,650,877 | $89,124 |
[ 65.0% - 65.5% ] 65.30% | 4,188,506 | $77,935 |
[ 65.5% - 66.0% ] 65.73% | 4,576,673 | $89,202 |
[ 66.0% - 66.5% ] 66.26% | 3,499,687 | $82,072 |
[ 66.5% - 67.0% ] 66.78% | 3,367,733 | $88,206 |
[ 67.0% - 67.5% ] 67.25% | 4,221,019 | $88,533 |
[ 67.5% - 68.0% ] 67.75% | 3,703,016 | $86,513 |
[ 68.0% - 68.5% ] 68.23% | 4,367,240 | $83,050 |
[ 68.5% - 69.0% ] 68.77% | 4,344,978 | $83,194 |
[ 69.0% - 69.5% ] 69.23% | 3,719,006 | $86,763 |
[ 69.5% - 70.0% ] 69.76% | 4,175,556 | $87,595 |
[ 70.0% - 70.5% ] 70.24% | 3,350,682 | $87,115 |
[ 70.5% - 71.0% ] 70.73% | 3,827,010 | $89,531 |
[ 71.0% - 71.5% ] 71.27% | 4,513,898 | $86,954 |
[ 71.5% - 72.0% ] 71.76% | 4,301,231 | $84,247 |
[ 72.0% - 72.5% ] 72.22% | 5,039,764 | $83,489 |
[ 72.5% - 73.0% ] 72.72% | 4,938,504 | $87,810 |
[ 73.0% - 73.5% ] 73.26% | 4,570,476 | $85,444 |
[ 73.5% - 74.0% ] 73.74% | 5,111,500 | $86,760 |
[ 74.0% - 74.5% ] 74.24% | 4,504,630 | $86,363 |
[ 74.5% - 75.0% ] 74.75% | 4,079,350 | $91,469 |
[ 75.0% - 75.5% ] 75.27% | 4,266,298 | $92,936 |
[ 75.5% - 76.0% ] 75.73% | 5,318,431 | $90,720 |
[ 76.0% - 76.5% ] 76.24% | 4,504,286 | $88,632 |
[ 76.5% - 77.0% ] 76.75% | 4,460,101 | $87,741 |
[ 77.0% - 77.5% ] 77.25% | 4,792,395 | $94,139 |
[ 77.5% - 78.0% ] 77.75% | 4,718,419 | $87,358 |
[ 78.0% - 78.5% ] 78.26% | 4,749,120 | $83,415 |
[ 78.5% - 79.0% ] 78.74% | 4,805,147 | $90,466 |
[ 79.0% - 79.5% ] 79.24% | 4,394,778 | $88,653 |
[ 79.5% - 80.0% ] 79.75% | 4,262,144 | $91,048 |
[ 80.0% - 80.5% ] 80.25% | 4,174,219 | $95,469 |
[ 80.5% - 81.0% ] 80.75% | 5,604,199 | $87,192 |
[ 81.0% - 81.5% ] 81.26% | 5,335,294 | $90,126 |
[ 81.5% - 82.0% ] 81.77% | 5,641,295 | $82,825 |
[ 82.0% - 82.5% ] 82.25% | 4,535,383 | $88,049 |
[ 82.5% - 83.0% ] 82.75% | 5,030,492 | $89,211 |
[ 83.0% - 83.5% ] 83.25% | 5,109,680 | $90,584 |
[ 83.5% - 84.0% ] 83.75% | 5,379,211 | $88,694 |
[ 84.0% - 84.5% ] 84.25% | 4,708,455 | $90,715 |
[ 84.5% - 85.0% ] 84.75% | 5,030,164 | $86,715 |
[ 85.0% - 85.5% ] 85.23% | 5,765,773 | $86,711 |
[ 85.5% - 86.0% ] 85.76% | 5,145,583 | $86,882 |
[ 86.0% - 86.5% ] 86.25% | 4,884,551 | $85,025 |
[ 86.5% - 87.0% ] 86.74% | 5,411,185 | $87,834 |
[ 87.0% - 87.5% ] 87.26% | 5,320,020 | $85,280 |
[ 87.5% - 88.0% ] 87.75% | 5,305,738 | $86,462 |
[ 88.0% - 88.5% ] 88.26% | 5,554,083 | $84,359 |
[ 88.5% - 89.0% ] 88.75% | 5,373,402 | $84,906 |
[ 89.0% - 89.5% ] 89.25% | 4,707,594 | $82,915 |
[ 89.5% - 90.0% ] 89.75% | 4,560,963 | $84,379 |
[ 90.0% - 90.5% ] 90.25% | 4,333,920 | $81,332 |
[ 90.5% - 91.0% ] 90.76% | 5,237,331 | $82,946 |
[ 91.0% - 91.5% ] 91.25% | 5,633,194 | $82,660 |
[ 91.5% - 92.0% ] 91.75% | 4,494,537 | $79,666 |
[ 92.0% - 92.5% ] 92.24% | 5,269,456 | $78,490 |
[ 92.5% - 93.0% ] 92.75% | 4,882,010 | $75,967 |
[ 93.0% - 93.5% ] 93.24% | 4,777,437 | $76,715 |
[ 93.5% - 94.0% ] 93.75% | 4,264,523 | $77,991 |
[ 94.0% - 94.5% ] 94.25% | 4,509,394 | $77,126 |
[ 94.5% - 95.0% ] 94.75% | 4,481,889 | $73,120 |
[ 95.0% - 95.5% ] 95.26% | 3,818,221 | $74,768 |
[ 95.5% - 96.0% ] 95.76% | 3,425,246 | $71,679 |
[ 96.0% - 96.5% ] 96.25% | 3,036,447 | $70,511 |
[ 96.5% - 97.0% ] 96.75% | 2,686,218 | $71,895 |
[ 97.0% - 97.5% ] 97.25% | 2,313,135 | $69,507 |
[ 97.5% - 98.0% ] 97.74% | 2,064,372 | $70,484 |
[ 98.0% - 98.5% ] 98.25% | 1,496,776 | $71,933 |
[ 98.5% - 99.0% ] 98.73% | 1,162,882 | $68,643 |
[ 99.0% - 99.5% ] 99.24% | 708,111 | $67,723 |
[ 99.5% - 100.0% ] 99.91% | 1,448,689 | $72,024 |