Immigrants from Congo 2 or more Vehicles in Household
COMPARE
Immigrants from Congo
Select to Compare
2 or more Vehicles in Household
Immigrants from Congo 2 or more Vehicles in Household
52.1%
2+ VEHICLES AVAILABLE
0.3/ 100
METRIC RATING
265th/ 347
METRIC RANK
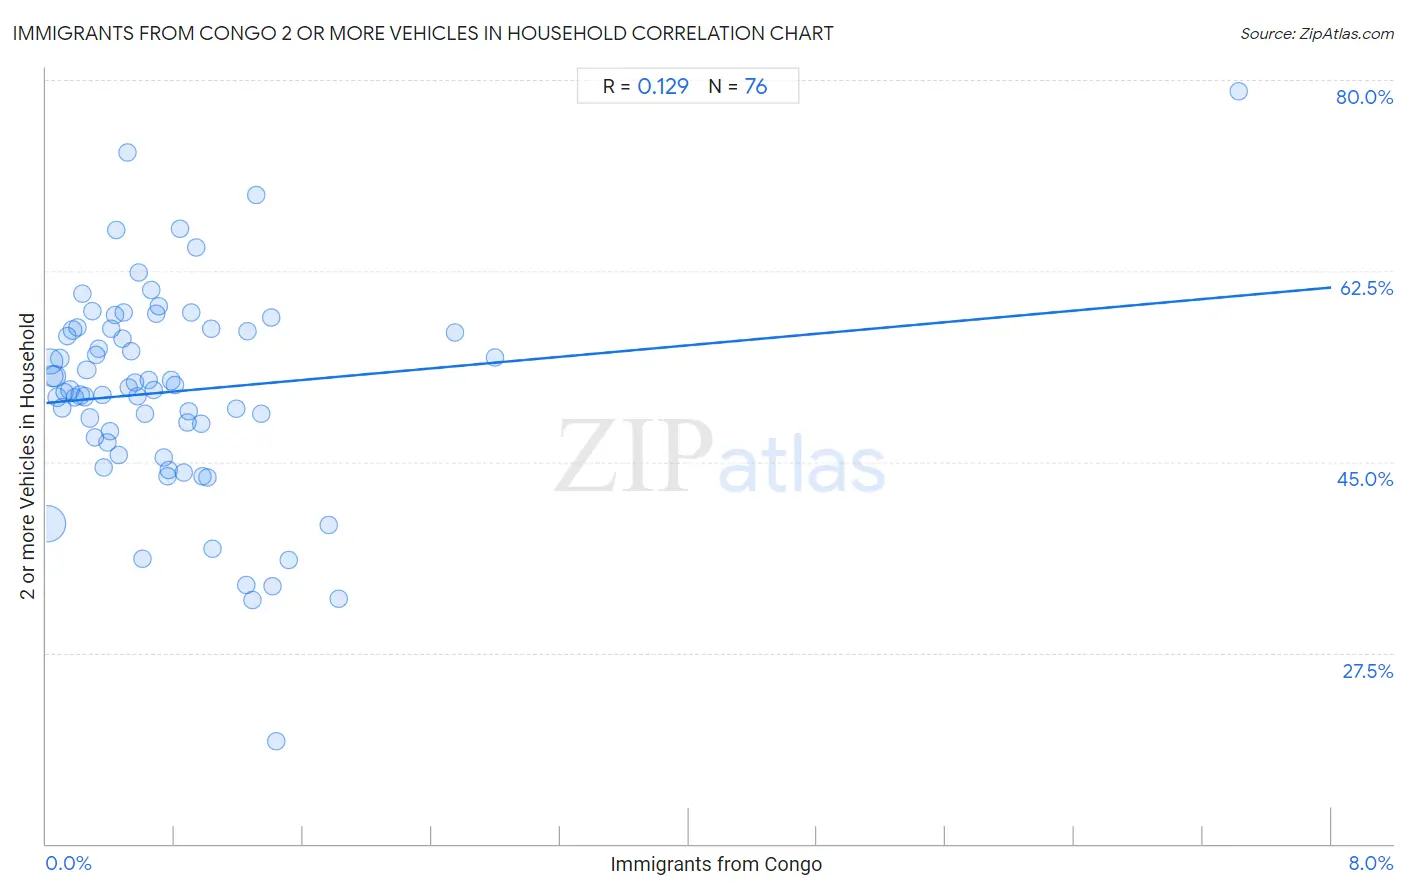
Immigrants from Congo 2 or more Vehicles in Household Correlation Chart
The statistical analysis conducted on geographies consisting of 92,104,745 people shows a poor positive correlation between the proportion of Immigrants from Congo and percentage of households with 2 or more vehicles available in the United States with a correlation coefficient (R) of 0.129 and weighted average of 52.1%. On average, for every 1% (one percent) increase in Immigrants from Congo within a typical geography, there is an increase of 1.3% in percentage of households with 2 or more vehicles available.
It is essential to understand that the correlation between the percentage of Immigrants from Congo and percentage of households with 2 or more vehicles available does not imply a direct cause-and-effect relationship. It remains uncertain whether the presence of Immigrants from Congo influences an upward or downward trend in the level of percentage of households with 2 or more vehicles available within an area, or if Immigrants from Congo simply ended up residing in those areas with higher or lower levels of percentage of households with 2 or more vehicles available due to other factors.
Demographics Similar to Immigrants from Congo by 2 or more Vehicles in Household
In terms of 2 or more vehicles in household, the demographic groups most similar to Immigrants from Congo are Immigrants from France (52.0%, a difference of 0.14%), Immigrants from Colombia (52.0%, a difference of 0.19%), Pima (52.0%, a difference of 0.20%), Honduran (52.0%, a difference of 0.20%), and Immigrants from Ireland (52.0%, a difference of 0.22%).
| Demographics | Rating | Rank | 2 or more Vehicles in Household |
| Central American Indians | 0.6 /100 | #258 | Tragic 52.5% |
| Alsatians | 0.6 /100 | #259 | Tragic 52.5% |
| Immigrants from Bahamas | 0.5 /100 | #260 | Tragic 52.5% |
| Immigrants from Australia | 0.5 /100 | #261 | Tragic 52.4% |
| Immigrants from Northern Africa | 0.4 /100 | #262 | Tragic 52.3% |
| Immigrants from Southern Europe | 0.4 /100 | #263 | Tragic 52.3% |
| Immigrants from Latvia | 0.4 /100 | #264 | Tragic 52.2% |
| Immigrants from Congo | 0.3 /100 | #265 | Tragic 52.1% |
| Immigrants from France | 0.2 /100 | #266 | Tragic 52.0% |
| Immigrants from Colombia | 0.2 /100 | #267 | Tragic 52.0% |
| Pima | 0.2 /100 | #268 | Tragic 52.0% |
| Hondurans | 0.2 /100 | #269 | Tragic 52.0% |
| Immigrants from Ireland | 0.2 /100 | #270 | Tragic 52.0% |
| South Americans | 0.2 /100 | #271 | Tragic 51.9% |
| Sub-Saharan Africans | 0.2 /100 | #272 | Tragic 51.9% |
Immigrants from Congo 2 or more Vehicles in Household Correlation Summary
| Measurement | Immigrants from Congo Data | 2 or more Vehicles in Household Data |
| Minimum | 0.0062% | 19.4% |
| Maximum | 7.4% | 79.0% |
| Range | 7.4% | 59.6% |
| Mean | 0.78% | 51.4% |
| Median | 0.59% | 51.7% |
| Interquartile 25% (IQ1) | 0.29% | 47.0% |
| Interquartile 75% (IQ3) | 0.97% | 57.1% |
| Interquartile Range (IQR) | 0.68% | 10.1% |
| Standard Deviation (Sample) | 0.95% | 9.7% |
| Standard Deviation (Population) | 0.94% | 9.6% |
Correlation Details
| Immigrants from Congo Percentile | Sample Size | 2 or more Vehicles in Household |
[ 0.0% - 0.5% ] 0.0062% | 37,721,903 | 39.4% |
[ 0.0% - 0.5% ] 0.023% | 14,273,728 | 54.2% |
[ 0.0% - 0.5% ] 0.036% | 7,808,956 | 52.8% |
[ 0.0% - 0.5% ] 0.054% | 7,580,812 | 52.9% |
[ 0.0% - 0.5% ] 0.069% | 3,537,633 | 50.9% |
[ 0.0% - 0.5% ] 0.084% | 3,247,218 | 54.5% |
[ 0.0% - 0.5% ] 0.099% | 1,389,318 | 50.0% |
[ 0.0% - 0.5% ] 0.12% | 1,443,078 | 51.4% |
[ 0.0% - 0.5% ] 0.13% | 722,416 | 56.6% |
[ 0.0% - 0.5% ] 0.14% | 2,336,142 | 51.5% |
[ 0.0% - 0.5% ] 0.16% | 2,348,236 | 57.0% |
[ 0.0% - 0.5% ] 0.18% | 358,173 | 50.9% |
[ 0.0% - 0.5% ] 0.19% | 291,198 | 57.4% |
[ 0.0% - 0.5% ] 0.21% | 1,898,543 | 51.1% |
[ 0.0% - 0.5% ] 0.22% | 434,808 | 60.4% |
[ 0.0% - 0.5% ] 0.24% | 760,186 | 51.0% |
[ 0.0% - 0.5% ] 0.25% | 496,880 | 53.4% |
[ 0.0% - 0.5% ] 0.27% | 585,341 | 49.0% |
[ 0.0% - 0.5% ] 0.28% | 531,836 | 58.8% |
[ 0.0% - 0.5% ] 0.30% | 401,793 | 47.2% |
[ 0.0% - 0.5% ] 0.31% | 383,162 | 54.8% |
[ 0.0% - 0.5% ] 0.33% | 213,823 | 55.4% |
[ 0.0% - 0.5% ] 0.35% | 286,907 | 51.2% |
[ 0.0% - 0.5% ] 0.36% | 146,758 | 44.4% |
[ 0.0% - 0.5% ] 0.38% | 159,165 | 46.8% |
[ 0.0% - 0.5% ] 0.40% | 191,448 | 47.8% |
[ 0.0% - 0.5% ] 0.41% | 123,241 | 57.2% |
[ 0.0% - 0.5% ] 0.42% | 101,543 | 58.4% |
[ 0.0% - 0.5% ] 0.44% | 39,083 | 66.3% |
[ 0.0% - 0.5% ] 0.45% | 28,970 | 45.6% |
[ 0.0% - 0.5% ] 0.47% | 135,564 | 56.2% |
[ 0.0% - 0.5% ] 0.48% | 179,621 | 58.7% |
[ 0.5% - 1.0% ] 0.50% | 9,536 | 73.4% |
[ 0.5% - 1.0% ] 0.51% | 22,546 | 51.8% |
[ 0.5% - 1.0% ] 0.53% | 131,929 | 55.2% |
[ 0.5% - 1.0% ] 0.55% | 27,636 | 52.3% |
[ 0.5% - 1.0% ] 0.56% | 94,019 | 51.0% |
[ 0.5% - 1.0% ] 0.58% | 27,652 | 62.4% |
[ 0.5% - 1.0% ] 0.60% | 38,225 | 36.2% |
[ 0.5% - 1.0% ] 0.62% | 71,872 | 49.4% |
[ 0.5% - 1.0% ] 0.64% | 119,806 | 52.5% |
[ 0.5% - 1.0% ] 0.66% | 24,398 | 60.8% |
[ 0.5% - 1.0% ] 0.67% | 69,456 | 51.6% |
[ 0.5% - 1.0% ] 0.68% | 89,464 | 58.6% |
[ 0.5% - 1.0% ] 0.70% | 63,508 | 59.3% |
[ 0.5% - 1.0% ] 0.74% | 37,809 | 45.4% |
[ 0.5% - 1.0% ] 0.75% | 60,937 | 43.7% |
[ 0.5% - 1.0% ] 0.76% | 96,559 | 44.2% |
[ 0.5% - 1.0% ] 0.78% | 82,734 | 52.4% |
[ 0.5% - 1.0% ] 0.80% | 91,037 | 52.0% |
[ 0.5% - 1.0% ] 0.83% | 26,837 | 66.3% |
[ 0.5% - 1.0% ] 0.86% | 92,643 | 44.0% |
[ 0.5% - 1.0% ] 0.88% | 56,935 | 48.6% |
[ 0.5% - 1.0% ] 0.89% | 27,865 | 49.7% |
[ 0.5% - 1.0% ] 0.90% | 45,419 | 58.7% |
[ 0.5% - 1.0% ] 0.93% | 9,217 | 64.6% |
[ 0.5% - 1.0% ] 0.96% | 90,227 | 48.5% |
[ 0.5% - 1.0% ] 0.97% | 11,081 | 43.7% |
[ 1.0% - 1.5% ] 1.01% | 43,653 | 43.6% |
[ 1.0% - 1.5% ] 1.03% | 64,713 | 57.2% |
[ 1.0% - 1.5% ] 1.04% | 12,355 | 37.0% |
[ 1.0% - 1.5% ] 1.18% | 54,017 | 49.8% |
[ 1.0% - 1.5% ] 1.25% | 40,527 | 33.7% |
[ 1.0% - 1.5% ] 1.26% | 80,672 | 57.0% |
[ 1.0% - 1.5% ] 1.28% | 24,892 | 32.3% |
[ 1.0% - 1.5% ] 1.31% | 13,510 | 69.5% |
[ 1.0% - 1.5% ] 1.34% | 14,363 | 49.4% |
[ 1.0% - 1.5% ] 1.40% | 38,441 | 58.3% |
[ 1.0% - 1.5% ] 1.41% | 13,295 | 33.6% |
[ 1.0% - 1.5% ] 1.43% | 7,666 | 19.4% |
[ 1.5% - 2.0% ] 1.51% | 2,912 | 36.0% |
[ 1.5% - 2.0% ] 1.76% | 2,846 | 39.2% |
[ 1.5% - 2.0% ] 1.82% | 1,483 | 32.5% |
[ 2.5% - 3.0% ] 2.55% | 1,885 | 56.9% |
[ 2.5% - 3.0% ] 2.79% | 5,876 | 54.5% |
[ 7.0% - 7.5% ] 7.42% | 4,809 | 79.0% |