Immigrants from Jamaica 2 or more Vehicles in Household
COMPARE
Immigrants from Jamaica
Select to Compare
2 or more Vehicles in Household
Immigrants from Jamaica 2 or more Vehicles in Household
44.5%
2+ VEHICLES AVAILABLE
0.0/ 100
METRIC RATING
321st/ 347
METRIC RANK
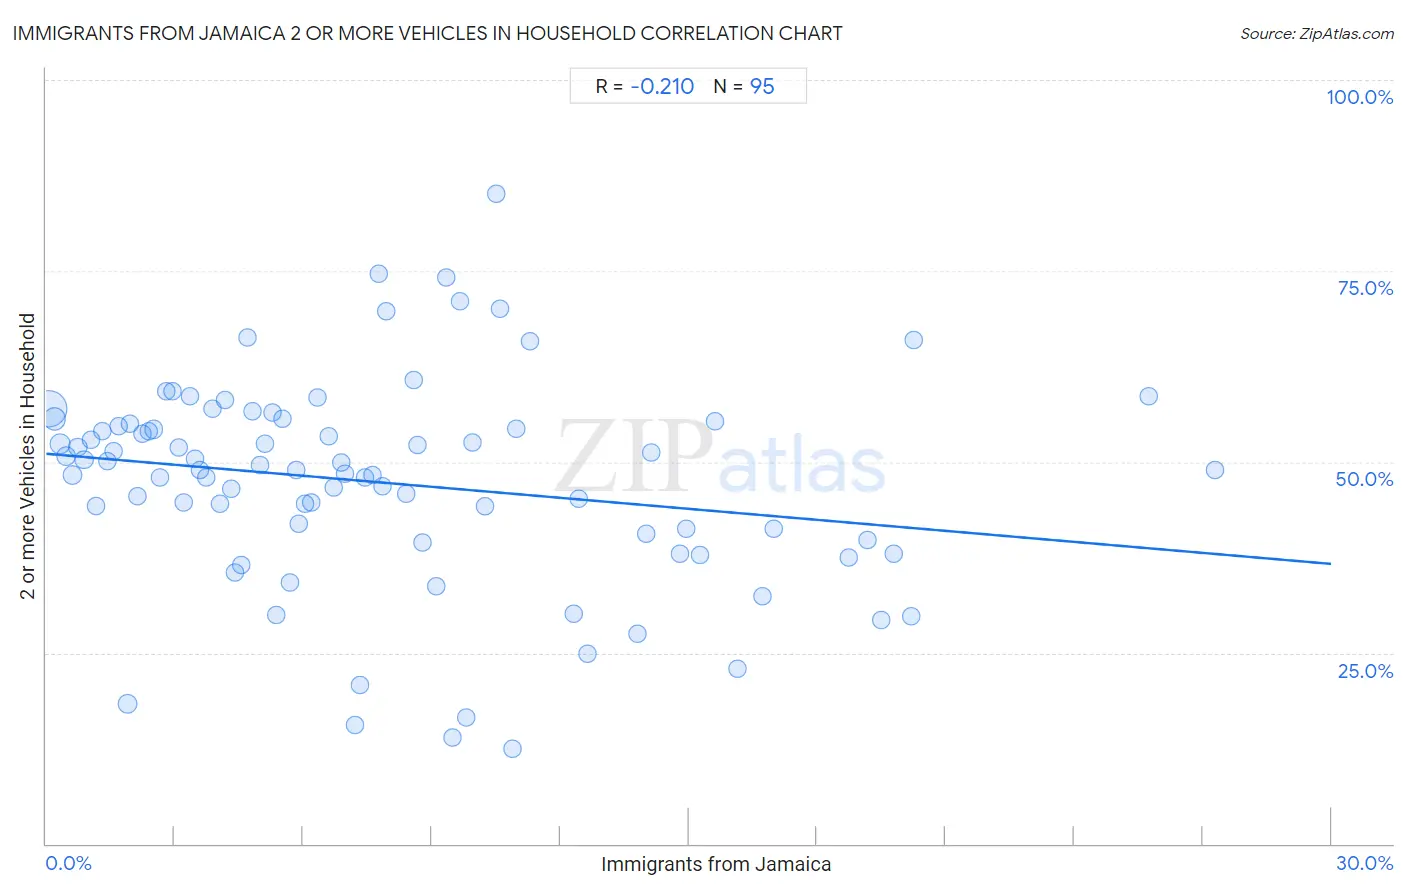
Immigrants from Jamaica 2 or more Vehicles in Household Correlation Chart
The statistical analysis conducted on geographies consisting of 301,616,256 people shows a weak negative correlation between the proportion of Immigrants from Jamaica and percentage of households with 2 or more vehicles available in the United States with a correlation coefficient (R) of -0.210 and weighted average of 44.5%. On average, for every 1% (one percent) increase in Immigrants from Jamaica within a typical geography, there is a decrease of 0.48% in percentage of households with 2 or more vehicles available.
It is essential to understand that the correlation between the percentage of Immigrants from Jamaica and percentage of households with 2 or more vehicles available does not imply a direct cause-and-effect relationship. It remains uncertain whether the presence of Immigrants from Jamaica influences an upward or downward trend in the level of percentage of households with 2 or more vehicles available within an area, or if Immigrants from Jamaica simply ended up residing in those areas with higher or lower levels of percentage of households with 2 or more vehicles available due to other factors.
Demographics Similar to Immigrants from Jamaica by 2 or more Vehicles in Household
In terms of 2 or more vehicles in household, the demographic groups most similar to Immigrants from Jamaica are Senegalese (44.2%, a difference of 0.55%), Immigrants from Caribbean (44.2%, a difference of 0.57%), Immigrants from Cabo Verde (43.3%, a difference of 2.6%), Soviet Union (45.7%, a difference of 2.9%), and Jamaican (45.8%, a difference of 2.9%).
| Demographics | Rating | Rank | 2 or more Vehicles in Household |
| Immigrants from Ghana | 0.0 /100 | #314 | Tragic 47.4% |
| Puerto Ricans | 0.0 /100 | #315 | Tragic 47.1% |
| Cape Verdeans | 0.0 /100 | #316 | Tragic 46.8% |
| Immigrants from Haiti | 0.0 /100 | #317 | Tragic 46.5% |
| Immigrants from Albania | 0.0 /100 | #318 | Tragic 46.0% |
| Jamaicans | 0.0 /100 | #319 | Tragic 45.8% |
| Soviet Union | 0.0 /100 | #320 | Tragic 45.7% |
| Immigrants from Jamaica | 0.0 /100 | #321 | Tragic 44.5% |
| Senegalese | 0.0 /100 | #322 | Tragic 44.2% |
| Immigrants from Caribbean | 0.0 /100 | #323 | Tragic 44.2% |
| Immigrants from Cabo Verde | 0.0 /100 | #324 | Tragic 43.3% |
| Immigrants from West Indies | 0.0 /100 | #325 | Tragic 43.1% |
| Immigrants from Senegal | 0.0 /100 | #326 | Tragic 43.0% |
| Immigrants from Yemen | 0.0 /100 | #327 | Tragic 42.8% |
| Inupiat | 0.0 /100 | #328 | Tragic 42.6% |
Immigrants from Jamaica 2 or more Vehicles in Household Correlation Summary
| Measurement | Immigrants from Jamaica Data | 2 or more Vehicles in Household Data |
| Minimum | 0.055% | 12.4% |
| Maximum | 27.3% | 85.1% |
| Range | 27.2% | 72.7% |
| Mean | 7.9% | 47.3% |
| Median | 6.6% | 49.0% |
| Interquartile 25% (IQ1) | 3.2% | 39.8% |
| Interquartile 75% (IQ3) | 10.9% | 55.0% |
| Interquartile Range (IQR) | 7.7% | 15.2% |
| Standard Deviation (Sample) | 6.0% | 13.8% |
| Standard Deviation (Population) | 6.0% | 13.7% |
Correlation Details
| Immigrants from Jamaica Percentile | Sample Size | 2 or more Vehicles in Household |
[ 0.0% - 0.5% ] 0.055% | 167,367,122 | 56.9% |
[ 0.0% - 0.5% ] 0.19% | 41,829,845 | 55.7% |
[ 0.0% - 0.5% ] 0.33% | 20,480,848 | 52.4% |
[ 0.0% - 0.5% ] 0.47% | 12,809,841 | 50.7% |
[ 0.5% - 1.0% ] 0.61% | 10,852,903 | 48.2% |
[ 0.5% - 1.0% ] 0.74% | 5,749,050 | 51.9% |
[ 0.5% - 1.0% ] 0.89% | 4,775,954 | 50.3% |
[ 1.0% - 1.5% ] 1.04% | 3,487,798 | 52.9% |
[ 1.0% - 1.5% ] 1.16% | 3,519,155 | 44.3% |
[ 1.0% - 1.5% ] 1.30% | 2,592,512 | 54.0% |
[ 1.0% - 1.5% ] 1.42% | 1,673,047 | 50.2% |
[ 1.5% - 2.0% ] 1.57% | 1,949,166 | 51.4% |
[ 1.5% - 2.0% ] 1.70% | 1,526,091 | 54.7% |
[ 1.5% - 2.0% ] 1.89% | 10,070,603 | 18.3% |
[ 1.5% - 2.0% ] 1.96% | 1,082,965 | 55.0% |
[ 2.0% - 2.5% ] 2.12% | 1,081,716 | 45.5% |
[ 2.0% - 2.5% ] 2.26% | 647,271 | 53.6% |
[ 2.0% - 2.5% ] 2.38% | 428,650 | 54.0% |
[ 2.5% - 3.0% ] 2.52% | 583,600 | 54.3% |
[ 2.5% - 3.0% ] 2.66% | 720,416 | 47.9% |
[ 2.5% - 3.0% ] 2.80% | 254,203 | 59.3% |
[ 2.5% - 3.0% ] 2.96% | 434,489 | 59.3% |
[ 3.0% - 3.5% ] 3.08% | 253,880 | 51.8% |
[ 3.0% - 3.5% ] 3.21% | 376,547 | 44.8% |
[ 3.0% - 3.5% ] 3.35% | 455,972 | 58.5% |
[ 3.0% - 3.5% ] 3.48% | 471,391 | 50.4% |
[ 3.5% - 4.0% ] 3.58% | 318,849 | 49.0% |
[ 3.5% - 4.0% ] 3.74% | 206,681 | 47.9% |
[ 3.5% - 4.0% ] 3.89% | 187,534 | 56.9% |
[ 4.0% - 4.5% ] 4.04% | 272,053 | 44.5% |
[ 4.0% - 4.5% ] 4.18% | 225,890 | 58.1% |
[ 4.0% - 4.5% ] 4.31% | 123,551 | 46.5% |
[ 4.0% - 4.5% ] 4.41% | 234,007 | 35.6% |
[ 4.5% - 5.0% ] 4.55% | 232,772 | 36.4% |
[ 4.5% - 5.0% ] 4.69% | 165,879 | 66.3% |
[ 4.5% - 5.0% ] 4.82% | 49,309 | 56.7% |
[ 4.5% - 5.0% ] 5.00% | 287,362 | 49.7% |
[ 5.0% - 5.5% ] 5.11% | 175,410 | 52.4% |
[ 5.0% - 5.5% ] 5.29% | 44,522 | 56.5% |
[ 5.0% - 5.5% ] 5.37% | 135,748 | 30.0% |
[ 5.5% - 6.0% ] 5.53% | 133,648 | 55.6% |
[ 5.5% - 6.0% ] 5.69% | 287,576 | 34.2% |
[ 5.5% - 6.0% ] 5.83% | 149,955 | 49.0% |
[ 5.5% - 6.0% ] 5.89% | 129,918 | 42.0% |
[ 6.0% - 6.5% ] 6.04% | 47,505 | 44.4% |
[ 6.0% - 6.5% ] 6.20% | 52,257 | 44.7% |
[ 6.0% - 6.5% ] 6.32% | 67,094 | 58.5% |
[ 6.5% - 7.0% ] 6.58% | 122,538 | 53.4% |
[ 6.5% - 7.0% ] 6.70% | 92,706 | 46.7% |
[ 6.5% - 7.0% ] 6.88% | 62,464 | 50.0% |
[ 6.5% - 7.0% ] 6.97% | 44,321 | 48.5% |
[ 7.0% - 7.5% ] 7.21% | 146,869 | 15.6% |
[ 7.0% - 7.5% ] 7.33% | 226,738 | 20.8% |
[ 7.0% - 7.5% ] 7.45% | 146,631 | 47.9% |
[ 7.5% - 8.0% ] 7.60% | 17,178 | 48.3% |
[ 7.5% - 8.0% ] 7.77% | 927 | 74.6% |
[ 7.5% - 8.0% ] 7.86% | 175,260 | 46.7% |
[ 7.5% - 8.0% ] 7.94% | 136,315 | 69.7% |
[ 8.0% - 8.5% ] 8.42% | 73,006 | 45.8% |
[ 8.5% - 9.0% ] 8.58% | 2,949 | 60.7% |
[ 8.5% - 9.0% ] 8.67% | 221,580 | 52.3% |
[ 8.5% - 9.0% ] 8.78% | 2,233 | 39.5% |
[ 9.0% - 9.5% ] 9.10% | 22,099 | 33.8% |
[ 9.0% - 9.5% ] 9.33% | 847 | 74.2% |
[ 9.0% - 9.5% ] 9.48% | 44,047 | 13.9% |
[ 9.5% - 10.0% ] 9.65% | 4,674 | 71.1% |
[ 9.5% - 10.0% ] 9.79% | 531 | 16.5% |
[ 9.5% - 10.0% ] 9.94% | 161 | 52.5% |
[ 10.0% - 10.5% ] 10.24% | 13,781 | 44.2% |
[ 10.0% - 10.5% ] 10.50% | 543 | 85.1% |
[ 10.5% - 11.0% ] 10.60% | 151 | 70.0% |
[ 10.5% - 11.0% ] 10.88% | 79,161 | 12.4% |
[ 10.5% - 11.0% ] 10.98% | 24,341 | 54.4% |
[ 11.0% - 11.5% ] 11.29% | 638 | 65.9% |
[ 12.0% - 12.5% ] 12.32% | 68,182 | 30.1% |
[ 12.0% - 12.5% ] 12.44% | 201 | 45.1% |
[ 12.5% - 13.0% ] 12.63% | 128,695 | 24.9% |
[ 13.5% - 14.0% ] 13.81% | 71,862 | 27.5% |
[ 14.0% - 14.5% ] 14.01% | 32,296 | 40.6% |
[ 14.0% - 14.5% ] 14.12% | 21,329 | 51.2% |
[ 14.5% - 15.0% ] 14.81% | 117,452 | 38.0% |
[ 14.5% - 15.0% ] 14.93% | 40,593 | 41.2% |
[ 15.0% - 15.5% ] 15.27% | 62,232 | 37.7% |
[ 15.5% - 16.0% ] 15.63% | 52,792 | 55.3% |
[ 16.0% - 16.5% ] 16.14% | 72,273 | 22.8% |
[ 16.5% - 17.0% ] 16.72% | 84,905 | 32.4% |
[ 16.5% - 17.0% ] 16.98% | 73,987 | 41.2% |
[ 18.5% - 19.0% ] 18.73% | 35,914 | 37.5% |
[ 19.0% - 19.5% ] 19.17% | 52,000 | 39.8% |
[ 19.0% - 19.5% ] 19.50% | 21,977 | 29.3% |
[ 19.5% - 20.0% ] 19.78% | 10,526 | 38.0% |
[ 20.0% - 20.5% ] 20.19% | 852 | 29.8% |
[ 20.0% - 20.5% ] 20.25% | 79 | 66.0% |
[ 25.5% - 26.0% ] 25.74% | 641 | 58.6% |
[ 27.0% - 27.5% ] 27.29% | 2,224 | 48.9% |